Analysis of spectrum occupancy using machine learning algorithms
Full text
Figure
![Fig. 5. Selection of optimal threshold (γ) and optimal splitting range ([Uoc, Loc]) for determining the classification criteria of](https://thumb-us.123doks.com/thumbv2/123dok_us/9464748.452970/24.595.76.573.203.604/selection-optimal-threshold-optimal-splitting-determining-classication-criteria.webp)
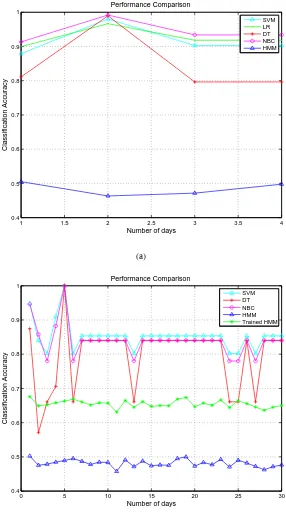
![Fig. 7. (a) Performance comparison of ML algorithms: SVM, DT, NBC, HMM, ’SVM+FFA’ and statistical model [8] using](https://thumb-us.123doks.com/thumbv2/123dok_us/9464748.452970/26.595.164.450.145.675/fig-performance-comparison-algorithms-svm-statistical-model-using.webp)
Related documents
Three optimisations steps are performed for each user type using separate multiple-criteria deci- sion models: (1) McdMD – MDM selection model, (2) McdD – dimensions optimisation
Iceland School of Energy (ISE) has been offering masters programs and short courses in Sustainable Energy Science and Engineering, with a strong focus on
The subjects completed three questionnaires: Thought control strategies, Penn-State Worry Questionnaire and Trait form of State-Trait Anxiety Inventory.. Data were
Alongside the growth of Canary Wharf and regeneration of the wider area, London City Airport, and its growth, has been at the forefront of revitalising the area over the past
explore their relative abundance in T1, T2 and T3 over control 2, we did the KEGG pathways analysis employing colour coded expression tags as described above ( Figure 5
As stated above, the neck pain is a common condition in middle age, and up to now few studies have been conducted on the findings from MRI on neck pain,
CRP levels were not significantly associated with the severity index, although they were associated with specific patient characteristics: colonization by Pseudomonas
Interviews were conducted between November 2011 and January 2012 with 16 experienced educators; two from each of the eight university podiatry programs in Australia and New Zealand.
