warwick.ac.uk/lib-publications
Original citation:
D’Amore, Rosalinda, Ijaz, Umer Zeeshan, Schirmer, Melanie, Kenny, John G., Gregory,
Richard, Darby, Alistair C., Shakya, Migun, Podar, Mircea, Quince, Christopher and Hall, Neil.
(2016) A comprehensive benchmarking study of protocols and sequencing platforms for 16S
rRNA community profiling. BMC Genomics, 17 (1).
Permanent WRAP URL:
http://wrap.warwick.ac.uk/85083
Copyright and reuse:
The Warwick Research Archive Portal (WRAP) makes this work of researchers of the
University of Warwick available open access under the following conditions.
This article is made available under the Creative Commons Attribution 4.0 International
license (CC BY 4.0) and may be reused according to the conditions of the license. For more
details see:
http://creativecommons.org/licenses/by/4.0/
A note on versions:
The version presented in WRAP is the published version, or, version of record, and may be
cited as it appears here.
D’Amoreet al. BMC Genomics (2016) 17:55 DOI 10.1186/s12864-015-2194-9
R E S E A R C H A R T I C L E
Open Access
A comprehensive benchmarking
study of protocols and sequencing
platforms for 16S rRNA community
profiling
Rosalinda D’Amore
1†, Umer Zeeshan Ijaz
2†, Melanie Schirmer
2, John G. Kenny
1, Richard Gregory
1,
Alistair C. Darby
1, Migun Shakya
3, Mircea Podar
4, Christopher Quince
5*and Neil Hall
1*Abstract
Background: In the last 5 years, the rapid pace of innovations and improvements in sequencing technologies has
completely changed the landscape of metagenomic and metagenetic experiments. Therefore, it is critical to benchmark the various methodologies for interrogating the composition of microbial communities, so that we can assess their strengths and limitations. The most common phylogenetic marker for microbial community diversity studies is the 16S ribosomal RNA gene and in the last 10 years the field has moved from sequencing a small number of amplicons and samples to more complex studies where thousands of samples and multiple different gene regions are interrogated.
Results: We assembled 2 synthetic communities with an even (EM) and uneven (UM) distribution of archaeal and
bacterial strains and species, as metagenomic control material, to assess performance of different experimental strategies. The 2 synthetic communities were used in this study, to highlight the limitations and the advantages of the leading sequencing platforms: MiSeq (Illumina), The Pacific Biosciences RSII, 454 GS-FLX/+ (Roche), and IonTorrent (Life Technologies). We describe an extensive survey based on synthetic communities using 3 experimental designs (fusion primers, universal tailed tag, ligated adaptors) across the 9 hypervariable 16S rDNA regions. We demonstrate that library preparation methodology can affect data interpretation due to different error and chimera rates generated during the procedure. The observed community composition was always biased, to a degree that depended on the platform, sequenced region and primer choice. However, crucially, our analysis suggests that 16S rRNA sequencing is still quantitative, in that relative changes in abundance of taxa between samples can be recovered, despite these biases.
Conclusion: We have assessed a range of experimental conditions across several next generation sequencing
platforms using the most up-to-date configurations. We propose that the choice of sequencing platform and experimental design needs to be taken into consideration in the early stage of a project by running a small trial consisting of several hypervariable regions to quantify the discriminatory power of each region. We also suggest that the use of a synthetic community as a positive control would be beneficial to identify the potential biases and procedural drawbacks that may lead to data misinterpretation. The results of this study will serve as a guideline for making decisions on which experimental condition and sequencing platform to consider to achieve the best microbial profiling.
*Correspondence: [email protected]; [email protected] †Equal contributors
5Warwick Medical School, University of Warwick, Warwick CV4 7AL, UK 1Institute of Integrative Biology, University of Liverpool, Liverpool L69 7ZB, UK Full list of author information is available at the end of the article
D’Amoreet al. BMC Genomics (2016) 17:55 Page 2 of 20
Background
Over the last 5 years improvements in sequencing technologies have seen the launching of the Single Molecule, Real-Time (SMRT) DNA Sequencing Sys-tem from Pacific Bioscience; and benchtop sequencers from 454, Life Technologies (now Thermo), and Illu-mina. These technologies have completely changed the way the scientific community have designed and con-ceived experiments in microbial ecology to describe com-munity complexity. With the rapid reduction in the cost of sequencing and improvements in read length and throughput, the field has been completely revolutionized and experimental designs, that before could not even have been attempted due to the high cost involved, have been made achievable. Two approaches have been widely used in practice to describe microbial community struc-ture, 16S rRNA gene profiling and shotgun metagenomic sequencing.
Ribosomal RNA genes are highly conserved and evo-lutionarily stable but differ in their hypervariable region, these features have made them the ideal tool for phylo-genetic studies. Several papers have described the nat-ural variation using in silico analyses [1] and genome sequencing have boosted our knowledge of the biolog-ical world improving ribosomal gene databases which support phylogenetic studies. These improvements have made the 16S rRNA gene the ideal marker for the char-acterization of microbial community diversity [2]. The 16S rRNA gene compromises 9 hypervariable regions, which differ in length, position and taxonomic discrim-ination [3]. Universal primers have been designed and evaluated to amplify the hypervariable regions [4] and primer bias toward particular taxonomic groups has been reported [5, 6]. The variable regions have differ-ent discriminatory power depending on the groups of microbes and amongst the short target regions (<300 bp), the hypervariable region 4 (V4) was generally the most informative [7].
In the last 5 years the most commonly used next generation sequencing platform for amplicon sequenc-ing has been the 454 series of platforms (Roche) [8, 9] and many groups have developed bioinformatics pipelines and denoising algorithms [10–12] that make the 454 a robust approach to investigate microbial diversity. How-ever, Roche have recently announced the withdrawal of the 454 sequencing platforms by 2016 and this has high-lighted the need for an alternative for taxonomic studies. The various sequencing platforms available have differ-ent strengths and weaknesses in read-length, accuracy, time-to-result, and throughput. Longer reads are easier to assign to a taxonomic group because they contain more information but some recent studies have suggested that it is possible to achieve comparable results using shorter target regions [4, 13] and overlapping reads have been
employed [14] to increase the taxonomic discrimination on Illumina platforms.
Also, depending on the community being studied and the nature of the hypotheses posed, different target regions and multiplexing strategies can be employed. Therefore, it is likely that different groups will opt for different study designs. Hence, it is crucial to develop technical solutions and bioinformatics pipelines that can be applied across multiple study designs.
Microbial profiling studies the abundance and the type of organisms within an environmental community. As with most molecular methods, a profiling experiment requires a series of distinct steps, which can potentially introduce errors and may even lead to biases and incorrect findings [15–17].
Even though natural microbial communities are com-posed of a mix of microbes with unknown struc-ture, synthetic microbial communities can be assembled to generate distinct systems with reduced complexity [18–20]. Previous studies have reported the use of a synthetic community as a control material to: investi-gate biases; interroinvesti-gate different software packages; and find the impact of sample preparation, 16S rRNA primer choice, amplicon preparation, direct sampling and library preparation [15, 18–21]. In this study we used two syn-thetic communities assembledin vitroby mixing genomic DNA from 49 bacterial and 10 archaeal species at equal abundance (even community EM) or uneven abundance (uneven community UM as shown in Table 1).
Different amplicon library preparation methodologies have been proposed to unlock the power of next-gen technologies for targeted sequencing [22–26]. The fusion primer design (FP) uses PCR to attach a barcode [22] but is expensive due to the requirement of purchasing long primers that are platform specific for every combination of primer and barcode to pair each sample in a study (e.g., 96 samples×4 variable regions would require a total of 384 primer pairs).
D’Amore
et
al.
BMC
Genomics
(2016) 17:55
Page
3
o
f
2
[image:4.791.68.707.73.530.2]0
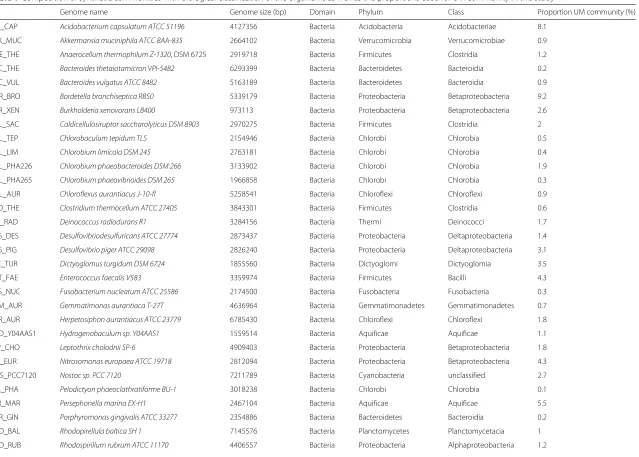
Table 1Composition of synthetic communities with biological classification of the organisms as well as the proportions used for UM community in this study
ID Genome name Genome size (bp) Domain Phylum Class Proportion UM community (%)
ACI_CAP Acidobacterium capsulatum ATCC 51196 4127356 Bacteria Acidobacteria Acidobacteriae 8.1 AKK_MUC Akkermansia muciniphila ATCC BAA-835 2664102 Bacteria Verrucomicrobia Verrucomicrobiae 0.9 ANE_THE Anaerocellum thermophilum Z-1320, DSM 6725 2919718 Bacteria Firmicutes Clostridia 1.2 BAC_THE Bacteroides thetaiotamicron VPI-5482 6293399 Bacteria Bacteroidetes Bacteroidia 0.2 BAC_VUL Bacteroides vulgatus ATCC 8482 5163189 Bacteria Bacteroidetes Bacteroidia 0.9 BOR_BRO Bordetella bronchiseptica RB50 5339179 Bacteria Proteobacteria Betaproteobacteria 9.2 BUR_XEN Burkholderia xenovorans LB400 973113 Bacteria Proteobacteria Betaproteobacteria 2.6 CAL_SAC Caldicellulosiruptor saccharolyticus DSM 8903 2970275 Bacteria Firmicutes Clostridia 2
CHL_TEP Chlorobaculum tepidum TLS 2154946 Bacteria Chlorobi Chlorobia 0.5
CHL_LIM Chlorobium limicola DSM 245 2763181 Bacteria Chlorobi Chlorobia 0.4
CHL_PHA226 Chlorobium phaeobacteroides DSM 266 3133902 Bacteria Chlorobi Chlorobia 1.9 CHL_PHA265 Chlorobium phaeovibrioides DSM 265 1966858 Bacteria Chlorobi Chlorobia 0.3 CHL_AUR Chloroflexus aurantiacus J-10-fl 5258541 Bacteria Chloroflexi Chloroflexi 0.9 CLO_THE Clostridium thermocellum ATCC 27405 3843301 Bacteria Firmicutes Clostridia 0.6
DEI_RAD Deinococcus radiodurans R1 3284156 Bacteria Thermi Deinococci 1.7
DES_DES Desulfovibriodesulfuricans ATCC 27774 2873437 Bacteria Proteobacteria Deltaproteobacteria 1.4 DES_PIG Desulfovibrio piger ATCC 29098 2826240 Bacteria Proteobacteria Deltaproteobacteria 3.1 DIC_TUR Dictyoglomus turgidum DSM 6724 1855560 Bacteria Dictyoglomi Dictyoglomia 3.5
ENT_FAE Enterococcus faecalis V583 3359974 Bacteria Firmicutes Bacilli 4.3
FUS_NUC Fusobacterium nucleatum ATCC 25586 2174500 Bacteria Fusobacteria Fusobacteria 0.3 GEM_AUR Gemmatimonas aurantiaca T-27T 4636964 Bacteria Gemmatimonadetes Gemmatimonadetes 0.7 HER_AUR Herpetosiphon aurantiacus ATCC 23779 6785430 Bacteria Chloroflexi Chloroflexi 1.8 HYD_Y04AAS1 Hydrogenobaculum sp. Y04AAS1 1559514 Bacteria Aquificae Aquificae 1.1 LEP_CHO Leptothrix cholodnii SP-6 4909403 Bacteria Proteobacteria Betaproteobacteria 1.8 NIT_EUR Nitrosomonas europaea ATCC 19718 2812094 Bacteria Proteobacteria Betaproteobacteria 4.3
NOS_PCC7120 Nostoc sp. PCC 7120 7211789 Bacteria Cyanobacteria unclassified 2.7
PEL_PHA Pelodictyon phaeoclathratiforme BU-1 3018238 Bacteria Chlorobi Chlorobia 0.1
PER_MAR Persephonella marina EX-H1 2467104 Bacteria Aquificae Aquificae 5.5
D’Amore
et
al.
BMC
Genomics
(2016) 17:55
Page
4
o
f
2
[image:5.791.65.702.95.505.2]0
Table 1Composition of synthetic communities with biological classification of the organisms as well as the proportions used for UM community in this study (Continued) RUE_POM Ruegeria pomeroyi DSS-3 4601053 Bacteria Proteobacteria Alphaproteobacteria 0.6
SAL_ARE Salinispora arenicola CNS-205 5786361 Bacteria Actinobacteria Actinobacteria 0.5 SAL_TRO Salinispora tropica CNB-440 5183331 Bacteria Actinobacteria Actinobacteria 1.6 SHE_BAL_OS185 Shewanella baltica OS185 5312910 Bacteria Proteobacteria Gammaproteobacteria 3.1 SHE_BAL_OS223 Shewanella baltica OS223 5358884 Bacteria Proteobacteria Gammaproteobacteria 1.4 SUL_EE.36 Sulfitobacter sp. EE-36 3547243 Bacteria Proteobacteria Alphaproteobacteria 2 SUL_NAS.14.1 Sulfitobacter sp. NAS-14.1 4002069 Bacteria Proteobacteria Alphaproteobacteria 4.3 SUL_YO3AOP1 Sulfurihydrogenibium sp. YO3AOP1 1838442 Bacteria Aquificae Aquificae 1.6 SUL_YEL Sulfurihydrogenibium yellowstonense 1534471 Bacteria Aquificae Aquificae 2.6
SS-5
THE_PSE Thermoanaerobacter pseudethanolicus 2362816 Bacteria Firmicutes Clostridia 0.8 ATCC 33223
THE_NEA Thermotoga neapolitana DSM 4359 1884562 Bacteria Thermotogae Thermotogae 0.7
THE_PET Thermotoga petrophila RKU-1 1824357 Bacteria Thermotogae Thermotogae 1
THE_RQ2 Thermotoga sp. RQ2 877693 Bacteria Thermotogae Thermotogae 3.4
THE_THE Thermus thermophilus HB8 2116056 Bacteria Thermi Thermi 0.5
TRE_DEN Treponema denticola ATCC 35405 2843201 Bacteria Spirochaetes Spirochaetes 0.2
TRE_VIN Treponema vincentii I 2512734 Bacteria Spirochaetes Spirochaetes 0.2
ZYM_MOB Zymomonas mobilis mobilis ZM4 2223497 Bacteria Proteobacteria Alphaproteobacteria 0.8 ARC_FUL Archaeoglobus fulgidus DSM 4304 2178400 Archaea Euryarchaeota Archaeoglobi 0.3 IGN_HOS Ignicoccus hospitalis KIN4/I 1297538 Archaea Crenarchaeota Thermoprotei 1.2 MET_JAN Methanocaldococcus jannaschii DSM 2661 1664970 Archaea Euryarchaeota Methanococci 0.9 MET_MAR_C5 Methanococcus maripaludis C5 1780761 Archaea Euryarchaeota Methanococci 0.4 MET_MAR_S2 Methanococcus maripaludis S2 1661137 Archaea Euryarchaeota Methanococci 0.5 NAN_EQU Nanoarchaeum equitans Kin4-M 490885 Archaea Nanoarchaeota Nanoarchaea 1 PYR_AER Pyrobaculum aerophilum IM2 2222430 Archaea Crenarchaeota Thermoprotei 0.5 PYR_CAL Pyrobaculum calidifontis JCM 11548 2009313 Archaea Crenarchaeota Thermoprotei 2.6
PYR_HOR Pyrococcus horikoshii OT3 1738505 Archaea Euryarchaeota Thermococci 1.9
D’Amoreet al. BMC Genomics (2016) 17:55 Page 5 of 20
or both ends to barcode the samples. As the second set of primers can be reused in other experiments (with dif-ferent targets) this method can be much cheaper than other approaches. Illumina and most recently PacBio have developed a protocol based on the 2 step PCR design and a similar approach has been supported by Fluidigm Corporation [26].
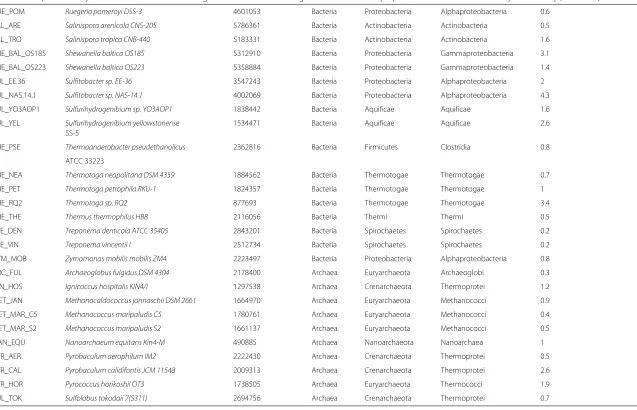
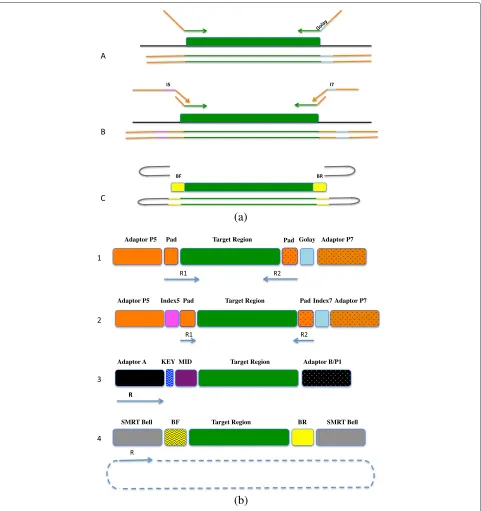
We compared the fusion primer (FG) and tailed tag (t-tag) methodologies (Fig. 1) for building amplicon libraries using the Illumina MiSeq platform. A single or a dual indexing strategy was also evaluated. Moreover, we gener-ated amplicon libraries across the 9 hypervariable regions of the 16S rRNA gene (Fig. 2) for 2 synthetic commu-nities and compared the data generated with a shotgun metagenomic library. Amplicon libraries were sequenced on 454 GS FLX/FLX+, Illumina MiSeq (MS), Life Tech-nologies Ion Torrent (IT) and Pacific Bioscience RS II (PB) platforms, to determine the impact of different experi-mental conditions on the community structure.
Our results demonstrate that almost all aspects of experimental design will bias the results to some extent. We demonstrate that not only specific target region affected the community profiling but also PCR cycle numbers, sequencing platform, and library preparation method will give different results in terms of error rates and biases. Despite this, by comparing data from UM and EM communities we show that the data on all sequenc-ing platforms is quantitative even if it does not accurately describe the community composition. We also highlight the relative merits of the different experimental designs for describing species within a community and OTU estimation.
Methods
Even and uneven microbial mock communities
High-molecular weight DNA was extracted using a mechanical and organic cell lysis method as described in [28], dissolved in TE buffer (pH 8) and measured using a Qubit dsDNA BR assay. After quantification and calculation of the concentration of genomic copies for each DNA preparation, two mixtures of genomic DNAs were assembled, henceforth referred to as even (EM) and uneven (UM) synthetic communities. We con-sidered organisms that were either sequenced previously or had a high quality draft genome in NCBI repository and covered a wide variety of strains that can be found in marine and terrestrial environments. Unlike natural envi-ronmental communities where composition and abun-dance is unknown, the two synthetic communities were assembled to have known amount of purified gDNA from ArchaeaandBacteriadomains. Both communities com-prised ten members ofEuryarcheota, Crenarcheota and NanoarcheotaforArchaeaand 49 bacterial strains from
16 phyla. The same organisms were used previously [28] although they have been assembled in a different manner in this paper. Our emphasis is on exploring the impact of the distributions of abundance distributions on recovery diversities. Therefore, we assembled an EM community to aim for an equal number of molecules per strain and an UM community where the strains within the same phylum were distributed according to a log-normal distribution with proportions shown in Table 1. In the UM, proportion between bacterial and archaeal strains was 9:1.
Amplicon library designs
The conditions studied varied across a gradient of tem-plate concentrations at a high cycle number and a low cycle number. We performed 3 independent amplifica-tions using HiFi Hot Start polymerase (Kapa) or Q5 poly-merase (New England BioLabs) to test for polypoly-merase derived bias (Table 2). Kapa and NEB have developed PCR amplification kits specifically for NGS workflows and these are widely used as they have high yields with little amplification bias. The 2 kits were selected for their ability to amplify difficult templates (e.g AT- and GC- rich) and increase yield, speed and sensitivity.
Universal tailed tag design (single or dual index barcoding strategy)
D’Amoreet al. BMC Genomics (2016) 17:55 Page 6 of 20
(a)
(b)
[image:7.595.58.539.85.596.2]D’Amoreet al. BMC Genomics (2016) 17:55 Page 7 of 20
Fig. 2Schematic representation of the combination of primers covering the 16S rRNA hypervariable regions and the sequencing platform used in this study
Fusion primer design
1−10 ng of the EM or UM community was subjected to an amplification step using 0.3μM primer forward fusion specific; 0.3 μM primer reverse fusion specific; 1x HiFi or Q5 polymerase ready mix. The PCR for each variable region was carried out in triplicate in a 25μl reaction in the thermal cycler with the following parameters: initial denaturation at 94 °C for 5 min, followed by 25 cycles of 98 °C for 20 s, 60 °C for 15 s, and 72 °C for 40 s with a final extension at 72 °C for 1 min.
Adapter ligation design
2 ng of the EM community DNA was submitted to the following amplification reaction: 0.3μM forward variable region specific primer; 0.3 μM reverse variable region specific primer; and 1x HiFi polymerase ready mix. The PCR for each variable region was carried out in triplicate
[image:8.595.55.541.87.330.2]in a 25μl reaction in the thermal cycler with the follow-ing parameters: initial denaturation at 94 °C for 5 min, followed by 25 cycles of 98 °C for 20 s, 60 °C for 15 s, and 72 °C for 40 s with a final extension at 72 °C for 1 min. The amplicon libraries were cleaned to remove excess nucleotides, salts and enzymes using 20μl of the Agencourt AMPure XP system. 1μl of each PCR prod-uct was run on a Bioanalyzer HS DNA Chip to ensure the final product was the correct size and quantified using a Qubit dsDNA HS assay. A pool of the three inde-pendent PCR products (500−750 ng) were subjected to end-repair using the Pacific Biosciences DNA template prep kit 2.0. (250 bp - 3 k) following manufacturer recom-mendations. Briefly, the end repair reaction was incubated at 25 °C for 15 min. Following the purification with 0.6x of AMPure PB beads and elution in 30μl of elution buffer, the end repaired mixtures were blunt ligated with the
Table 2Experimental conditions assessed in this study on IT, MS, 454 FLX + and PB sequencing platforms
Synthetic community Experimental design Nm cycles Template concentration (ng) Sequencing platform
EM/UM Fusion primer 25 1,5,10 MS
EM Fusion primer 25 2,5 IT, 454
EM Universal tailed tag 5+15 1,10 MS
EM Universal tailed tag 8+15 1,10 MS
EM/UM Universal tailed tag 10+15 2,5 MS
[image:8.595.57.539.634.734.2]D’Amoreet al. BMC Genomics (2016) 17:55 Page 8 of 20
adapters supplied in the template prep kit. The ligation was incubated at 25 °C for 15 min and then stored at 4 °C overnight. Exonuclease digestion to remove the failed lig-ation products was performed by incubating at 37 °C for 1 h, followed by purification with 1x AMPure beads.
Amplicon quantitation and pooling
1 μl of each amplicon library was run on a Bioanalyzer HS DNA Chip to assess the amplicon size and quantified using a Qubit dsDNA HS assay. Each amplicon library was size selected according to the expected amplicon size (±50 bp) using a pre-cast 1.5 % agarose with ethidium bromide gel cassette on the Pippin Prep System (Sage Science). The library concentration for Illumina and 454 amplicon libraries was assessed using a SYBR green qPCR assay with primers specific to each platform (Kapa).
Multiplexing strategy
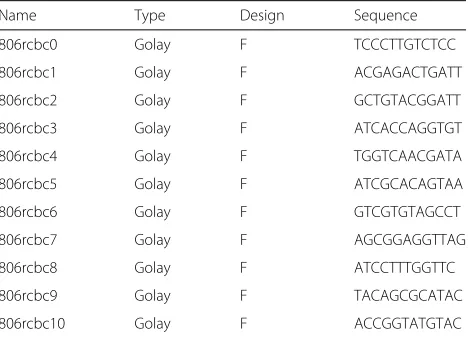
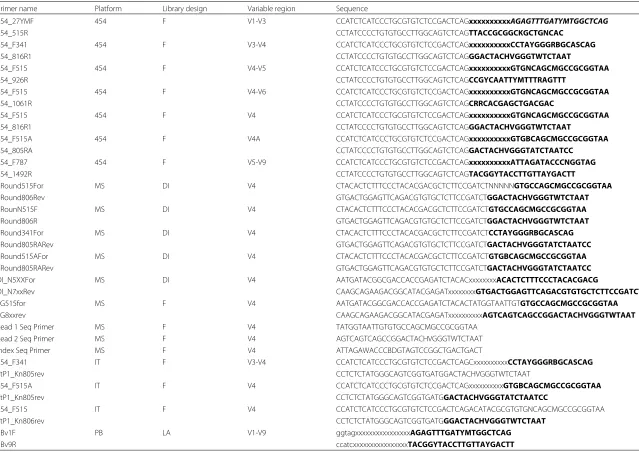
[image:9.595.57.291.564.733.2]Three multiplexing approaches were used to tag each PCR product: single index, dual index, and barcoded adapter. The single index and dual index strategies were used to build libraries for Illumina’s MS technology. In the single index strategy approach, the primers contain the Illumina adapter sequence, a unique 12nt error-correcting Golay index sequence (only for the reverse primer; see Table 3) comprising a 10nt pad to prevent hairpin formation, and a 2nt linker that is not complementary to the 16S rRNA gene and a gene specific sequence. Sequencing proceeded by using the combined pad-linker-primer as sequencing primers at the 3and 5ends (read 1 and read 2 sequence primers are shown in Table 4) as described in Caporaso et al. [29]. In the dual index strategy, the forward and reverse locus specific primers are modified to include a 35nt Illumina adapter sequence at the 5ends that act as primer binding sites in the second step PCR (Table 4).
Table 3The error-correcting multiplex identifier sequences used with MS technology. A 12 bp reverse index used for
unidirectional tagging in the fusion primer approach (F)
Name Type Design Sequence
806rcbc0 Golay F TCCCTTGTCTCC
806rcbc1 Golay F ACGAGACTGATT
806rcbc2 Golay F GCTGTACGGATT
806rcbc3 Golay F ATCACCAGGTGT
806rcbc4 Golay F TGGTCAACGATA
806rcbc5 Golay F ATCGCACAGTAA
806rcbc6 Golay F GTCGTGTAGCCT
806rcbc7 Golay F AGCGGAGGTTAG
806rcbc8 Golay F ATCCTTTGGTTC
806rcbc9 Golay F TACAGCGCATAC
806rcbc10 Golay F ACCGGTATGTAC
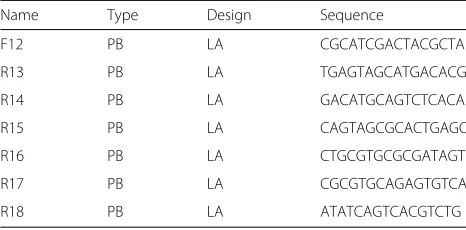
In the second step PCR, universal tag primer set (Table 4) which contains a 39nt sequence (corresponding to the Illumina adapter needed for cluster generation) com-prising a unique 8nt index sequence (Table 5), and a 21nt complementary to the sequence introduced in the first step PCR, to tag the the library produced in the first step. The single index strategy was used to build libraries suitable for IT and 454 sequencing. In the single index strategy approach the primers contain the IT/454 adapter sequence, a 4nt key sequence, a unique 10nt index sequence (only for the forward primer; see Table 6) and a gene specific sequence. The ligate adapter strategy was used to build libraries to submit to PB sequencing. For-ward and reverse locus specific primers were used to amplify the variable region but the primers were modified to include a 5nt pad sequence and a unique 16nt index sequence (Table 7) at the 5ends. After amplification, PB specific adapters were ligated to both ends.
Metagenomic DNA Library
The metagenomic library was constructed using the EM community gDNA and the Illumina Nextera XT Kit. A standard tagmentation reaction was set up using 1ng as input according to the Nextera protocol. After neutraliza-tion, barcoded primers were added to the reaction and submitted to 12 cycles of amplification. After this, a PCR cleanup was performed following the Nextera protocol using a 0.6:1 ratio of AMPure XP(Beckman Coulter) to PCR reaction. Reactions were eluted in 30 μL of TE buffer.
MS sequencing
Due to the low library diversity, a PhiX control spike-in of 10−15 % was used for libraries run with RTA v1.17.28, which is bundled with MCS v2.2. When the older ver-sion of the software was used, a PhiX control spike-in was added at 50 %. Each amplicon library was mixed with Illumina-generated PhiX control libraries and denatured with NaOH and subsequently the ssDNA library frag-ments were diluted to a final concentration of 8 pM. 600μl of ssDNA library was loaded into a MiSeq Reagent Car-tridge and a 500–cycle PE kit v2 was used. Paired-end sequencing run was performed according to the manufac-turer’s instruction (Illumina, San Diego, CA, USA). For the runs where fusion primer design and Golay barcodes were employed, we used custom read 1, read 2 and index read (see Table 4) according to [29]. Raw fastq files generated by the real time analysis software on the MS were used in the subsequent analyses.
IT sequencing
D’Amore
et
al.
BMC
Genomics
(2016) 17:55
Page
9
o
f
2
[image:10.791.61.700.67.520.2]0
Table 4PCR primers used in this study
Primer name Platform Library design Variable region Sequence
454_27YMF 454 F V1-V3 CCATCTCATCCCTGCGTGTCTCCGACTCAGxxxxxxxxxxAGAGTTTGATYMTGGCTCAG
454_515R CCTATCCCCTGTGTGCCTTGGCAGTCTCAGTTACCGCGGCKGCTGNCAC
454_F341 454 F V3-V4 CCATCTCATCCCTGCGTGTCTCCGACTCAGxxxxxxxxxxCCTAYGGGRBGCASCAG
454_816R1 CCTATCCCCTGTGTGCCTTGGCAGTCTCAGGGACTACHVGGGTWTCTAAT
454_F515 454 F V4-V5 CCATCTCATCCCTGCGTGTCTCCGACTCAGxxxxxxxxxxGTGNCAGCMGCCGCGGTAA
454_926R CCTATCCCCTGTGTGCCTTGGCAGTCTCAGCCGYCAATTYMTTTRAGTTT
454_F515 454 F V4-V6 CCATCTCATCCCTGCGTGTCTCCGACTCAGxxxxxxxxxxGTGNCAGCMGCCGCGGTAA
454_1061R CCTATCCCCTGTGTGCCTTGGCAGTCTCAGCRRCACGAGCTGACGAC
454_F515 454 F V4 CCATCTCATCCCTGCGTGTCTCCGACTCAGxxxxxxxxxxGTGNCAGCMGCCGCGGTAA
454_816R1 CCTATCCCCTGTGTGCCTTGGCAGTCTCAGGGACTACHVGGGTWTCTAAT
454_F515A 454 F V4A CCATCTCATCCCTGCGTGTCTCCGACTCAGxxxxxxxxxxGTGBCAGCMGCCGCGGTAA
454_805RA CCTATCCCCTGTGTGCCTTGGCAGTCTCAGGACTACHVGGGTATCTAATCC
454_F787 454 F V5-V9 CCATCTCATCCCTGCGTGTCTCCGACTCAGxxxxxxxxxxATTAGATACCCNGGTAG
454_1492R CCTATCCCCTGTGTGCCTTGGCAGTCTCAGTACGGYTACCTTGTTAYGACTT
1Round515For MS DI V4 CTACACTCTTTCCCTACACGACGCTCTTCCGATCTNNNNNGTGCCAGCMGCCGCGGTAA
1Round806Rev GTGACTGGAGTTCAGACGTGTGCTCTTCCGATCTGGACTACHVGGGTWTCTAAT
1RounN515F MS DI V4 CTACACTCTTTCCCTACACGACGCTCTTCCGATCTGTGCCAGCMGCCGCGGTAA
1Round806R GTGACTGGAGTTCAGACGTGTGCTCTTCCGATCTGGACTACHVGGGTWTCTAAT
1Round341For MS DI V4 CTACACTCTTTCCCTACACGACGCTCTTCCGATCTCCTAYGGGRBGCASCAG
1Round805RARev GTGACTGGAGTTCAGACGTGTGCTCTTCCGATCTGACTACHVGGGTATCTAATCC
1Round515AFor MS DI V4 CTACACTCTTTCCCTACACGACGCTCTTCCGATCTGTGBCAGCMGCCGCGGTAA
1Round805RARev GTGACTGGAGTTCAGACGTGTGCTCTTCCGATCTGACTACHVGGGTATCTAATCC
DI_N5XXFor MS DI V4 AATGATACGGCGACCACCGAGATCTACACxxxxxxxxACACTCTTTCCCTACACGACG
DI_N7xxRev CAAGCAGAAGACGGCATACGAGATxxxxxxxxGTGACTGGAGTTCAGACGTGTGCTCTTCCGATCT
FG515for MS F V4 AATGATACGGCGACCACCGAGATCTACACTATGGTAATTGTGTGCCAGCMGCCGCGGTAA
FG8xxrev CAAGCAGAAGACGGCATACGAGATxxxxxxxxxxAGTCAGTCAGCCGGACTACHVGGGTWTAAT
Read 1 Seq Primer MS F V4 TATGGTAATTGTGTGCCAGCMGCCGCGGTAA
Read 2 Seq Primer MS F V4 AGTCAGTCAGCCGGACTACHVGGGTWTCTAAT
Index Seq Primer MS F V4 ATTAGAWACCCBDGTAGTCCGGCTGACTGACT
454_F341 IT F V3-V4 CCATCTCATCCCTGCGTGTCTCCGACTCAGCxxxxxxxxxxCCTAYGGGRBGCASCAG
TtP1_Kn805rev CCTCTCTATGGGCAGTCGGTGATGGACTACHVGGGTWTCTAAT
454_F515A IT F V4 CCATCTCATCCCTGCGTGTCTCCGACTCAGxxxxxxxxxxGTGBCAGCMGCCGCGGTAA
TtP1_Kn805rev CCTCTCTATGGGCAGTCGGTGATGGACTACHVGGGTATCTAATCC
454_F515 IT F V4 CCATCTCATCCCTGCGTGTCTCCGACTCAGACATACGCGTGTGNCAGCMGCCGCGGTAA
TtP1_Kn806rev CCTCTCTATGGGCAGTCGGTGATGGGACTACHVGGGTWTCTAAT
PBv1F PB LA V1-V9 ggtagxxxxxxxxxxxxxxxxAGAGTTTGATYMTGGCTCAG
PBv9R ccatcxxxxxxxxxxxxxxxxTACGGYTACCTTGTTAYGACTT
D’Amoreet al. BMC Genomics (2016) 17:55 Page 10 of 20
Table 5Unique barcode adaptors specifically designed and validated for optimal performance with Illumina technology
Name Type Design Sequence
501 Illumina DI TAGATCGC
502 Illumina DI CTCTCTAT
503 Illumina DI TATCCTCT
504 Illumina DI AGAGTAGA
505 Illumina DI GTAAGGAG
506 Illumina DI ACTGCATA
507 Illumina DI AAGGAGTA
508 Illumina DI CTAAGCCT
701 Illumina DI TCGCCTTA
702 Illumina DI CTAGTACG
703 Illumina DI TTCTGCCT
704 Illumina DI GCTCAGGA
705 Illumina DI AGGAGTCC
706 Illumina DI CATGCCTA
709 Illumina DI AGCGTAGC
710 Illumina DI CAGCCTCG
711 Illumina DI CAGCCTCG
An 8 bp reverse Index (I7) and forward index (I5) used in the universalTailed Tag design (DI) to barcode the reads in both directions
[image:11.595.304.537.134.249.2]libraries were amplified by PCR that was carried out using the Ion OneTouchTM200 Template Kit v2 DL (Life Tech-nologies) according to the manufacturer’s instructions. Sequencing of the amplicon libraries was carried out on a 316 or 318 chip using the Ion Torrent PGM system and the Ion Sequencing 300 kit (Life Technologies) according to the supplier’s instructions. After sequencing, the indi-vidual sequence reads were filtered by the IT software to remove low quality and polyclonal sequences using default setting. All IT quality-approved, trimmed and filtered data were exported as Standard Flowgram Format (sff ) files and used in subsequent analyses.
Table 6Unique barcode adaptors specifically designed and validated for optimal performance with IT, 454 FLX and FLX+ sequencing technologies
Name Type Design Sequence
TC20 454 F ACGACTACAG
TC21 454 F CGTAGACTAG
TC22 454 F TACGAGTATG
TC23 454 F TACTCTCGTG
TC24 454 F TAGAGACGAG
TC25 454 F TCGTCGCTCG
TC26 454 F ACATACGCGT
[image:11.595.56.289.601.713.2]A forward 10 bp MID was used in the fusion approach (F) to tag the reads in forward direction
Table 7Unique barcode adaptors specifically designed and validated for optimal performance with PB sequencing technology. A forward and a reverse 16 bp MID was used in the Ligation approach (LA) to tag the reads in both directions
Name Type Design Sequence
F12 PB LA CGCATCGACTACGCTA
R13 PB LA TGAGTAGCATGACACG
R14 PB LA GACATGCAGTCTCACA
R15 PB LA CAGTAGCGCACTGAGC
R16 PB LA CTGCGTGCGCGATAGT
R17 PB LA CGCGTGCAGAGTGTCA
R18 PB LA ATATCAGTCACGTCTG
454 sequencing
The libraries were clonally amplified via emulsion PCR adding 0.5 molecule/bead per cup of emulsion, following manufacturer’s recommendations employing the GS FLX Titanium LV emPCR Kit (454 Life Sciences, Branford, CT). Following amplification, emPCR reactions were col-lected, and emulsions broken according to the manu-facturer’s protocols. Beads containing sufficient copies of clonally amplified library fragments were selected via the enrichment procedure and counted with a Z2 Coul-ter CounCoul-ter (Beckman CoulCoul-ter, Fullerton, CA) prior to sequencing. Following emulsion PCR enrichment, beads produced using the titanium library were deposited into 4-region gasket format wells of a Titanium Series PicoTiterPlate device and 454 sequencing was performed using the GS FLX Titanium Sequencing Kit XLR70 on the GS or using GS FLX Titanium Sequencing Kit XL+ on the GS FLX+ sequencer according to the manufac-turer’s recommendations (454 Life Sciences, Branford, CT). Image analysis, signal processing and base calling were performed using the supplied software system. Sff files output from base calling were employed in down-stream analyses using onboard software v2.6 for GS FLX and v2.8 for GS FLX+.
PB SMRT sequencing
D’Amoreet al. BMC Genomics (2016) 17:55 Page 11 of 20
using the read of insert pipeline on the onboard software provided in the smrt portal (software v2.1) applying as fil-tering 1, 3, 5, 8 passes and minimum predicted accuracy of 90.
Bioinformatics
The results in this paper were generated using AMPLImock (Additional file 1: Figure S1; https:// bitbucket.org/umerijaz/amplimock/src), a pipeline we developed for quantifying error rates and biases when a mock community with known reference sequences has been sequenced. The pipeline requires the original (F.fasta) and reverse-complimented (R.fasta) refer-ence sequrefer-ences for each 16S rRNA operon present and a mapping file (IDs.txt) which maps multiple 16S rRNA operons onto the known species.
Creation of the reference 16S rRNA database
For the compilation of the 16S rRNA reference database an E. coli 16S rRNA sequence (GI:349736152) was aligned against the full genome reference database using blastn[30]. If less than four blast hits were returned for any organism, the NCBI database was directly searched for additional sequences. For each individual organism duplicates and sequences that completely overlapped were removed. All reference sequences were subsequently verified by aligning them against the full genome reference database. Sequences that failed to align were removed, resulting in a total of 116 rRNA sequences. For the iden-tification of single nucleotide polymorphisms (SNPs) in the 16S rRNA reference sequences, a large metagenomic sequencing data set (76 million reads, HiSeq, Nextera, 2 × 100 bp) in combination with a full length 16S sequencing data set (MiSeq, Nextera, 2 × 250 bp) was utilised. Two sequencing data sets were used in order to avoid the incorporation of false positive SNPs. Quality-trimmed reads with a minimum read length of 60 bp were aligned against the preliminary 16S rRNA reference database withBWA[31]. The alignment was subsequently converted to pileup format using SAMtools [32] and SNPs were identified with VarScan [33] (parame-ters for full length 16S data set: -min-var-freq
0.3 -min-coverage 1000 -strand-filter
0 -variants; parameters for metagenomic data
set: -min-var-freq 0.3 -min-coverage 80
-strand-filter 0 -variants). Only SNPs that
were identified for both sequencing datasets were incor-porated into the database through the addition of a new sequence containing the SNP. The process was repeated with the updated 16S reference database until no more SNPs were recognised for the metagenomic read data set. In total 33 SNPs were identified result-ing in 128 16S rRNA reference sequences (note that if multiple SNPs were identified for the same reference
sequence, one new sequence was added containing these SNPs).
Read trimming and filtering
The first step in the pipeline is filtering and quality trim-ming. For the IT, 454 and MS platforms, reads were filtered and quality trimmed withsickle(v1.200) which applies a sliding window approach and trims regions when the average base quality drops below 20 [34]. We also applied a 10 bp length threshold discarding reads that fall below this length after trimming. For the PacBio reads cir-cular consensus sequencing (CCS) error correction was applied with different minimum thresholds (none i.e. raw reads of insert ROI, three CCS3, five CCS5 and eight -CCS8).
Generating non-chimeric overlapping reads
For the MS platform where paired-end reads were gener-ated, we usedPANDAseq(v2.4) with a minimum overlap of 50 bp to assemble them. PANDAseq was used as it has been previously shown to perform better than other software for paired-end assembly [35], reducing substi-tution rates for the MS platform by 77− 98 % with an average of 93.2 %. Additionally, for the datasets where the raw data still had primers intact, we supplied primers to PANDAseq after assembling the reads to remove them from the resulting sequences. The overlapped reads were then dereplicated usinguclust(v6.0.307),de novo clus-tered, annotated with cluster sizes, sorted while main-taining a record of redundancy and finally filtered for chimeras usinguchime. Both initial overlapping reads, and final non-chimeric reads were then matched against the reference database (with minimum percentage iden-tity of 95 %) to generate frequencies for each species in the reference database, error rates for matched reads and percentage of reads matching. For the IT, 454 and PB platforms where paired-end reads are not available, the overlapping step was skipped, and the sequences are searched against the reference database after initial QC checks usingsickle.
OTU generation
D’Amoreet al. BMC Genomics (2016) 17:55 Page 12 of 20
than 32bp. Even though the cluster_otu command inusearchremoves reads that match chimeric models built from more abundant reads, a few chimeras may be missed, especially if they have parents that are absent from the reads or are present with very low abundance. There-fore, in the next step, we use a reference-based chimera filtering step using the GOLD database (http://drive5. com/uchime/uchime_download.html) that is derived from the ChimeraSlayer reference database in the Microbiome Utilities provided by the Broad Institute (http://microbiomeutil.sourceforge.net/). Finally, the orig-inal barcoded reads were matched against the clean OTUs with 97 % similarity to generate OTU tables for different samples. All these steps are mentioned inUPARSE.pdf located at https://bitbucket.org/umerijaz/amplimock/src. We have adopted two different approaches for generating OTU tables for each sample. In the first approach, we perform multiple sequence alignment of the database sequences using muscle (v3.8.31) and then excise the amplicon region based on the forward and reverse primers used for each sample withclustalw(v2.1). We then follow the general approach as mentioned before to generate a two column abundance table giving counts of OTUs that are present in the sample as well as the database. In the second approach, we generate the OTUs without collating the database sequences.
Generating pipeline statistics
AMPLImockgenerates quantitative results for each sam-ple that can further be analysed in a statistical software package such asR. The total numbers of forward, reverse, and overlapped reads; and average PHRED quality scores of forward and reverse reads are outputted. These reads are then matched against the the reference 16S rRNA database extracted from the known genomes. From this the mean identity of forward (after trimming), reverse (after trimming), and overlapped reads, compared to their closest database match are calculated. The number of chimeric reads found in the above chimera checking steps and non-chimeric reads after chimera removal are also given. Finally, diversity indexes such as Shannon and Simpson index based on the proportion of different matched species in the database are calculated. Addi-tionally, to determine error transition probabilities, we used the alignments against the best matching reference sequences generated byusearchto count all nucleotide transitions between the query and reference sequences.
Results
Error rates and percentage of reads matching across platforms
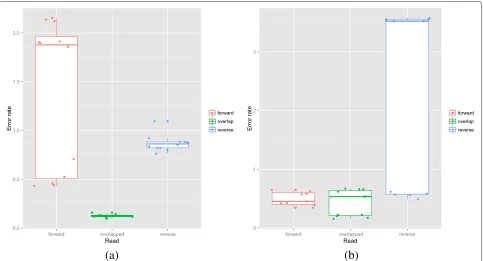
Error rates were calculated by matching reads against the reference 16S rRNA sequences using usearch as described above. Only reads with greater than 95 %
nucleotide similarity to the best matching reference were used in the error calculations [36]. Results were calcu-lated for all the EM community datasets with greater than 10,000 reads for the 454, IT and MS platforms but for PB, we used all data sets regardless of read number. This comprised 9 454 data sets, 5 FLX and 4 FLX+, 5 IT, 29 MS (see Table 8), and 3 PB replicates (each at four levels of CCS). To facilitate a fair comparison across all plat-forms, only forward reads were used for the MS platform, as although it allows paired-end sequencing, generating a forward and reverse read, this is not possible on the other platforms. In addition, the proportion of reads match-ing to the references was calculated. Overall, tests of significance were performed using a Kruskal-Wallis non-parametric ANOVA and individual t-tests performed to compare pairs of treatments. Error rates differed across platforms (see Fig. 3a) with an overall significance of p = 0.015. The PB consensus sequences were gener-ated using a multi-pass sequencing. The Read-of-Insert (ROI), i.e. unfiltered consensus reads with no minimum coverage, had the highest error rate of 1.90 % but this was not significantly higher than the IT - 1.47 % (p = 0.11). Both the PB ROI and IT error rates were sig-nificantly higher than the MS (0.92 %) and 454 (1.06 %) but PB could be reduced to an equivalent error rate of 1.11 % when a minimum threshold of 8 passes (CCS8) was used.
In calculating these error rates we only used reads with at most 5 % error; reads that are noisier than this will fail to match and hence not contribute to the error calculation. It is important therefore to also examine the percentage of reads that fail to match. This varied dramatically with platform (p=0.0001) as can be seen in Fig. 3b. The non-matching rate was similar for MS and 454 (means 4.83 % and 4.33 % respectively – p = 0.56) but much higher for PB ROI (21.58497 %) and higher still for IT (mean 43.77 %). Once again, increased numbers of circularisa-tion cycles reduced the PB percentage not matching to the range observed for MS and 454 albeit at the cost of reduced read number (see Additional file 2: Figure S2).
Nature of errors across the different platforms
D’Amoreet al. BMC Genomics (2016) 17:55 Page 13 of 20
Table 8Experimental design parameters for MS EM datasets
Region Amplicon design method Primer (f) Primer (r) Input (ng) PCR cycle no. Taq No.
V4 DI 515 805RA 2 12 + 18 HF 1
V4 DI 515 806rcb 2 12 + 18 HF 1
V4 DI 515 806rcb 2 10 + 15 HF 3
V4 DI F515A 806rcb 2 8 + 15 HF 1
V4 DI F515A 806rcb 2 8 + 15 Q5 3
V4 DI F515A 806rcb 2 10 + 15 HF 3
V4 FG 515 806rcb 1 25 HF 3
V4 FG 515 806rcb 5 15 Q5 2
V4 FG 515 806rcb 5 25 Q5 2
V4 FG 515 806rcb 5 25 HF 1
V4 FG 515 806rcb 10 15 HF 1
V4 FG 515 806rcb 10 25 HF 2
V3-V4 DI 341f 806rcb 2 10 + 15 HF 3
V3-V4 DI 341f 805RA 2 10 + 15 HF 3
Illumina: Impact of library preparation method and overlapping reads on error rate
We explored two alternative methods for building the Illu-mina MS libraries, the first involved a 1 step PCR with Golay barcodes on the reverse read (Fusion Primer Golay
Design - FG) and the second a 2 step PCR with stan-dard Illumina barcodes on both reads (Universal Tailed Tag Dual Index - DI) - see Fig. 1a, b. In Fig. 4a and b we show the impact of overlapping the forward and reverse reads on the MS V4 error rates. It is apparent that the DI
(a)
(b)
[image:14.595.58.542.428.683.2]D’Amoreet al. BMC Genomics (2016) 17:55 Page 14 of 20
[image:15.595.57.540.86.347.2](a)
(b)
Fig. 4 aImpact of overlapping reads on MS error rates for the DI library preparation method. Overlapping reads significantly reduced error rates for the DI library preparation method (t-test comparing forward [mean 1.38 %] and overlapped error rates [0.13 %]p=0.00016).bImpact of
overlapping reads on MS error rates for the FG library preparation method. Overlapping reads did not significantly reduce error rate for the FG library preparation method (t-test comparing forward [mean 0.50 %] and overlapped error rates [0.42 %]p=0.36). It is also worth mentioning here that not all the reads overlapped, for example, for the MS platform, and with the given settings inPANDAseq(as discussed in the main text), the statistics for the percentage of reads that were assembled successfully are: 80.93 % (1stquantile); 89.02 % (median); 81.07 % (mean); and 95.67 % (3rdquantile)
method results in a significant reduction in the error rate compared to the FG. There is also a large variation in error rate for the forward DI reads and the reverse FG. This vari-ation is highly run-dependent (see Additional file 4: Figure S9) but does not seem to depend on the cluster density of the particular run.
Impact of PCR conditions on error rate and chimera frequency
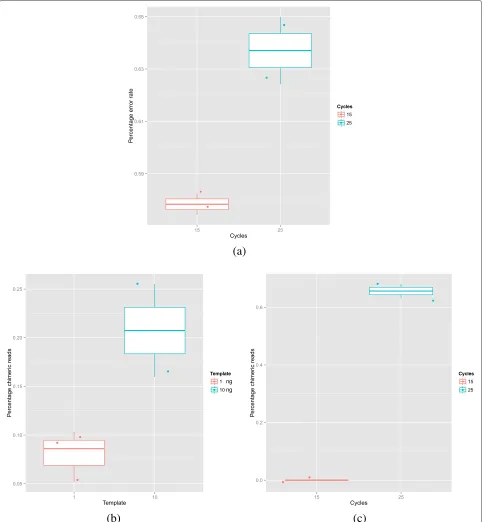
We also evaluated the impact of PCR conditions on the error rate. We explored the impact of starting template concentration, Taq polymerase enzyme and number of PCR cycles. Each sample was generated from the EM community using 3 independent PCR reactions targeting the V4 region of the 16S rRNA gene on MS using 2×250 bp paired-end reads. The only consistent effect observed on error rate was a marginally significant increase associ-ated with more PCR cycles (p=0.11 - see Fig. 5a).
There is another form of artefact associated with PCR, in addition to simple base errors, and that is PCR chimeras. PCR chimeras are sequences comprised of two or more true sequences. They form due to incompletely extended sequences acting as primers to template in the following rounds of PCR. Our analysis revealed that the
amount of starting material, and the number of cycles play an important role in controlling PCR errors. Using 1 ng of template reduced the proportion of chimeric reads compared to 10 ng but only with marginal significance (p=0.22) (see Fig. 5b). In contrast the cycle number did have a significant impact (p=0.0245 see Fig. 5c).
Ability of different platforms and regions to reconstruct the EM community
D’Amoreet al. BMC Genomics (2016) 17:55 Page 15 of 20
(a)
[image:16.595.58.543.87.609.2](b)
(c)
D’Amoreet al. BMC Genomics (2016) 17:55 Page 16 of 20
[image:17.595.62.537.87.341.2](a)
(b)
Fig. 6 aHeatmap for EM communities (showing the bacterial species) reconstructed from different platforms using a range of experimental designs for amplicons. The design parameters are shown on top (b) NMDS plot based on Bray-Curtis distance comparing the samples showns in (a)
FLX and PB samples also perform well probably reflect-ing their greater read length. The best MS region appears to be the V4. To quantify the effectiveness of the dif-ferent platforms and regions with a single number we calculated Shannon’s entropy across species, i.e.H(x¯) =
S
s=1−fsln(xs)wherexsis the observed relative frequency of speciess. This value will be maximised for an even dis-tribution when xs = 1/S and therefore the higher the entropy, the closer the sample appears to the true underly-ing even community. The results are shown in Additional file 5: Figure S4a. This appears to confirm the NMDS plot in that one of the best performing combinations is 454 FLX+ V4-V5 although now the best of the MS V4 sam-ples appears comparable, although there is a great deal of variation.
Barcode switching
There is another form of error and that is barcode switch-ing between labelled samples. To test for switchswitch-ing we prepared libraries from individual genomes rather than the mock communities. Then the frequency of observed reads deriving from species other than the focal one indi-cates the probability of barcode switching. We did this for both Illumina library preparation strategies. In both cases the overall switching rates were low with a mean switching probability of 0.17 % for DI and 0.21 % for FG with no sig-nificant difference between them (p = 0.642 Additional file 6: Figure S5). The two library preparation strategies
did differ in that for the DI most switching was to the other single species libraries on the run whereas for the FG a wider range of species from throughout the mock com-munity was observed (see Additional file 7: Figure S6). In neither case was the mock community included on that run hence this may suggest that the FG library preparation method is more susceptible to carry-over from previous runs.
Reconstruction of EM and UM communities
D’Amoreet al. BMC Genomics (2016) 17:55 Page 17 of 20
(a)
(b)
Fig. 7Quantitative results for two EM-UM pairs (among a total of 22) for MS and PB are shown. The fitted line through the points is represented by a blue line with R-squared shown on top. The red line is the ground-truth with the slope difference from the blue line also shown on top
MS and one for the PB. In both cases there is a highly significant correlation between the two ratios and a slope that is nearly one for a regression forced through the ori-gin. This implies that 16S rRNA sequencing is strongly quantitative despite being biased. In general the MS (mean R-squared of 0.8107) runs seem to be more quantitative than PB (mean R-squared of 0.716) withp=0.044 using a t-test. We can then ask which species are responsible for this difference and which are more accurately quan-tified on one platform relative to another, by comparing the absolute errors, i.e. how different was the observed ratio from the true ratio? The results are given in Table 9. In all cases where there was a difference in accuracy, then the MS was the better platform. The exception was She-wanella baltica OS223which has a closely related strain in the data setShewanella baltica OS185. This suggests that the one advantage of PB may be better strain resolution when the entire 16S rRNA is sequenced.
Taxonomic classification of reads to RDP database
Up until now we have calculated all statistics through comparison of the reads to the known 16S rRNA sequences of the species that we sequenced. This was useful to explore bias in community proportions but in reality we will not know a priori which organisms are present. Therefore, to provide a more realistic perspective of how diversity estimates and community predictions will be distorted we also performedde novotaxonomic classi-fication against the RDP database using their standalone
[image:18.595.64.541.87.342.2]classifier [37] with the default -minWords option of 5. For the MS platform, assembled paired-end reads (through PANDAseq) were considered, whereas for other platforms, single-end reads were used. The results for observed genera number are shown in Additional file 8: Figure S7 where we have separated genera, by whether they were in the reference database and should be observed in the reads which we denote ‘good’, and also ‘noisy’ which are those genera which should not have been present. The short read platforms all outperformed PB in terms of their ability to recover the known genera, proba-bly due to a combination of higher read number and less biased primers. Given this though they performed sim-ilarly although marginally more genera were recovered
Table 9Species with significantly different quantification accuracies between MS and PB
Species Mean error MS Mean error PB p-value
Caldicellulosiruptor 0.132 0.643 0.000056966 saccharolyticus
Nitrosomonas 0.510 1.117 0.000592824 europaea
Pelodictyon 0.012 0.459 0.000072079 phaeoclathratiforme
Salinispora 0.330 0.662 0.000132560 tropica
[image:18.595.306.539.598.734.2]D’Amoreet al. BMC Genomics (2016) 17:55 Page 18 of 20
by MS than 454 (mean 39.305 and 37.454 respectively with p-value= 0.06029). However, 454 had fewer noisy genera than MS (mean 29.272 vs. 55.583 withp-value= 0.0009208) and fewer still than IT (mean 65.857 withp -value=4.186e-05). The PB long reads also generated sig-nificantly fewer noisy OTUs than all the next generation technologies with a mean of 12.666.
OTU construction
We next constructed OTUs from the reads from each plat-form using UPARSE with default parameters. We did not employ any of the denoising methods available for 454 (e.g. [10]) in order to provide an equivalent cross-platform comparison. We did discard singletons as recommended in UPARSE but not for the PB sequencing where the sam-ple sizes were so small that the singletons contained a large proportion of the true diversity. In Additional file 9: Figure S8 we give the observed total OTU frequencies and of those ‘good’ OTUs that were also in the database and the ‘noisy’ OTUs that were not meant to be there. The full-length PB platform does succeed in identifying more good OTUs than the short read platforms, although not signif-icantly more, but at the cost of far more ‘noisy’ artefact sequences. Of the short read platforms 454 and MS appear almost equivalent. Significantly more good OTUs were obtained for MS than IT (means 44.15 and 35.50, respec-tively, withp-value=0.0001501) and significantly fewer noisy OTUs (means 18.83 and 6.2000 with p-value = 0.00538).
Discussion
For any experiment it is vital to be able to understand the accuracy of the measurements and the potential sources of error. Here we have undertaken an exhaustive study that uses a multitude of primer combinations, library prepara-tion protocols, and sequencing platforms. We quantified intrinsic errors and analyzed the relative accuracy of these approaches for absolute and relative estimation of species abundance and OTU estimation.
Our finding demonstrates the MS platform, using over-lap read error correction, has the most accurate sequence reads. Despite this, the extra read length of the 454 plat-form and PB does allow good estimation of the composi-tion of our mock community when comparing the data to the known reference dataset used in the study. However, given the much higher throughput and economics of the Illumina technology it would seem the pragmatic choice of platform for most studies.
As expected the number of PCR cycles during ampli-con generation has a direct impact on the accuracy of the resulting data, we also demonstrate that the initial con-centration of template will also affect the proportion of chimeras formed if the PCR cycle number is kept con-stant. This is most likely because when more template is
present at the start of the reaction the amplicon abun-dance will increase more rapidly which enables more miss-priming during the PCR [21]. This demonstrates that normalizing the input DNA quantity across all samples is vital to ensure that all data generated is comparable.
It has been demonstrated by others that amplicon libraries can be prone to barcode switching [38, 39] whereby the barcodes from one amplicon can be assigned to another in the same flowcell on the MS platform. Our evaluation of this phenomenon using single species sam-ples has highlighted the fact that some barcodes appear to be more prone to this occurrence than others. Also the FG barcoding protocol appears to be more prone to switch-ing. Although the frequency of switching we observed was very low (below 1 %) this could be a major source of error for certain studies where species may be at a high abun-dance in some samples and absent in other, such as clinical samples being analysed for pathogens.
Analysis of all experimental conditions used (sum-marised in Fig. 6) demonstrates that amplicon choice has the most pronounced effect on the measurement of the relative abundance of the different species. This is evident in the PB data, which uses the V1 and V9 primers. This primer combination does not detect any of the archaeal species (see Additional file 10: Figure S10 and Additional file 11: Table S1). Also the V1 and V3 primers perform badly in detecting Archaea. Where different platforms are used with the same primers their performance in detecting species is similar. The whole genome shotgun approach gives the most accurate estimation of species abundance in this analysis.
The performance of the different platforms in describ-ing the mock communities can be quantitatively measured by calculating the entropy of the data generated. Our anal-ysis shows that the platforms have a similar performance although the platforms with fewer reads (454 and PB) per-form slightly less well. It should also be pointed out that different library methodologies have been used in a pre-vious study to increase base calling accuracy [40] using a mix of primers that have frameshifting nucleotides to increase cluster identification on the Illumina plat-form. We have also used a mix of primers with random nucleotides for the DI design (data not shown), but ever since the software RTA v1.17.28 release, no signifi-cant differences were found. The barcode design (FG or DI) does affect the entropy of the data. In our hands, the DI with V4 primers performed best, giving the highest entropy and therefore lower bias.
D’Amoreet al. BMC Genomics (2016) 17:55 Page 19 of 20
all the microbial diversity. Therefore primers should be carefully chosen for individual studies based on prior knowledge of the taxa likely to be present or combinations of primers must be used.
Although the relative abundances of species within sam-ples are not well described by 16S sequencing, the ability to estimate the relative abundance of the same species between samples is very good. As demonstrated in Fig. 7, both the PB and MS data correlate well with the different abundances of bacteria in the EM and UM communi-ties. This is despite the small number of reads that are generated by the PB platform.
When classifying at the genera level using the RDP clas-sifier all platforms underestimated the total number of genera, the PB performing the least well. This was again due to the failure of the V1-V9 primers in amplifying the Archaea, as none of these species were present in our dataset.
The findings discussed above were generated by com-paring benchmarking datasets against a database of 16S sequences in synthetic communities. However most 16S sequencing studies will use OTU reconstruction to iden-tify species, as in most cases the community structure will not be known. We calculated OTUs from our datasets at the 3 % level. At this granularity our community should have 57 different OTUs, however the PB massively over-estimated the number of OTUs despite the low number of reads generated. The MS and IT performed well with the V4 amplicon while the 454 underestimated the number of OTUs. Nevertheless, when the PB data was compared to a database of known OTUs (which we know to be present) it performed better than the other platforms predicting more of the “good OTUs”. So although the MS and IT pre-dict roughly the correct number of OTUs many of these are “noisy OTUs”. In the case of the IT, around 40 % of the predicted OTUs are incorrect.
Rarefaction analysis demonstrates that the short read platforms (IT, MS, 454) Additional file 12: Figure S12 have reached asymptote in most experimental designs. There-fore we would not predict the number of OTUs to increase much with more sequencing. However it is striking how different the OTU estimation is between different experi-mental designs and replicates. However in the case of the PB, the rarefaction curves appear linear, other than the CCS8 reads. This demonstrates that the CCS sequencing can improve the data substantially but the result of this will be a reduction in the total number of reads.
Conclusion
We have used synthetic microbial communities for this and our previous study [28] and while our communities are relatively complex compared to many other published studies they are not going to be representative of most environmental samples, which are likely to have much
more species diversity across a wider range of abundances. Here, we demonstrate that consistency in input DNA quantity, PCR cycles and barcoding strategy is required to get reproducible and comparable results. The best design of the experiment will depend on the questions asked of the data and what prior knowledge exists. For example, we have shown that if the species present in a sample are known then PacBio is better than other platforms for identification and therefore it can be used for confirmation studies, conversely if OTU estimation is done blind then the short read platforms perform best. There has recently been a heightened awareness about the over-interpretation of microbiome studies [17]. We hope that this analysis will better inform future experi-mental designs and interpretation but also highlight areas where out technology can be improved to better represent microbial diversity.
Availability of supporting data
The datasets are available on the European Nucleotide Archive under the study accession number: ERP005737 (http://www.ebi.ac.uk/ena/data/view/ERP005737).
Additional files
Additional file 1: Figure S1.AMPLImock pipeline. (PDF 886 kb)
Additional file 2: Figure S2.Read quality distribution for PacBio. (PDF 5 kb)
Additional file 3: Figure S3.Error Transition Probabilities for all platforms. (ZIP 34 kb)
Additional file 4: Figure S4.Impact of platform and region on entropy. (ZIP 16 kb)
Additional file 5: Figure S5.Impact of library preparation method on barcode switching probability. (PDF 5 kb)
Additional file 6: Figure S6.Heatmap of observed species in the single-species libraries. (PDF 32 kb)
Additional file 7: Figure S7.Taxonomic profiling of different platforms. (PDF 7 kb)
Additional file 8: Figure S8.OTU comparison for all platforms. (PDF 8 kb)
Additional file 9: Figure S9.Impact of PCR cycles on OTUs. (ZIP 43 kb)
Additional file 10: Figure S10.Heatmap of arc heal species in the EM community. (ZIP 9 kb)
Additional file 11: Figure S1.Regression of abundances against primer mismatches and 16S rRNA gene true copy numbers. (PDF 50 kb)
Additional file 12: Table S12.Rarefaction curves for all platforms. (PDF 107 kb)
Competing interests
The authors have no competing interest.
Authors’ contributions
D’Amoreet al. BMC Genomics (2016) 17:55 Page 20 of 20
Acknowledgments
This study was funded by Technology Strategy Board (TSB) research grant “Development of instrumental and bioinformatic pipelines to accelerate commercial applications of metagenomics approaches”. U. Z. Ijaz is funded by NERC IRF NE/L011956/1. C. Quince is funded by an MRC fellowship
MR/M50161X/1 as part of the CLoud Infrastructure for Microbial Genomics (CLIMB) consortium - MR/L015080/1. M. Shakya and M. Podar are supported by Oak Ridge National Laboratory (ORNL). ORNL is managed by UT-Battelle, LLC, for the U.S. Department of Energy. DNA sequence was generated by The University of Liverpool Centre for Genomic Research, UK.
Author details
1Institute of Integrative Biology, University of Liverpool, Liverpool L69 7ZB, UK. 2School of Engineering, University of Glasgow, Glasgow G12 8LT, UK. 3Department of Biological Sciences, Dartmouth College, Hanover, NH 03755, USA.4Biosciences Division, Oak Ridge National Laboratory, Oak Ridge, TN 37831, USA.5Warwick Medical School, University of Warwick, Warwick CV4 7AL, UK.
Received: 8 June 2015 Accepted: 5 November 2015
References
1. Lim K, Furuta Y, Kobayashi I. Large variations in bacterial ribosomal RNA genes. Mol Biol Evol. 2012;29(10):2937–48.
2. Rinke C, Schwientek P, Sczybra A, Ivanova NN, Anderson IJ, Cheng JF, et al. Insight into the phylogeny and coding potential of microbial dark matter. Nature. 2013;499:431–7.
3. Van de Peer Y, Chapelle S, De Wachter R. A quantitative map of nucleotide substitution rates in bacterial rRNA. Nucl Acids Res. 1996;24:3381–91. 4. Klindworth A, Pruesse E, Schweer T, Pelies J, Quast C, Horn M, et al. Evaluation of general 16S ribosomal RNA gene PCR primers for classical and next-generation sequencing-based diversity studies. Nucleic Acids Res. 2012;20:1–11.
5. Ghyselinck J, Pfeiffer S, Heylen K, Sessitsch A, De Vos P. The effect of primer choice and short read sequences on the outcom of 16S rRNA gene based diversity studies. PLoS One. 2013;8(8):e71360.
6. Pinto AJ, Raskin L. PCR biases distort bacterial and archaeal community structure in pyrosequencing datasets. PLoS One. 2012;7(8):e43093. 7. Soergel DAW, Dey N, Knight R, Brenner SE. Selection of primers for
optimal taxonomic classification of environmental 16S rRNA gene sequences. ISME J. 2012;6:1440–4.
8. Sogin ML, Morrison HG, Huber JA, MarkWelch D, Huse SM, Neal PR, et al. Microbial diversity in the deep sea and the underexplored “rare biosphere”. Proc Natl Acad Sci U S A. 2006;103:12115–20.
9. Tringe SG, Hugenholtz P. A renaissance for the pioneering 16S rRNA gene. Curr Opin Microbiol. 2008;11:442–6.
10. Quince C, Lanzen A, Curtis TP, Davenport RJ, Hall N, Head IM, et al. Accurate determination of microbial diversity from 454 pyrosequencing data. Nat Methods. 2009;6:639–41.
11. Quince C, Lanzen A, Davenport RJ, Turnbaugh PJ. Removing noise from pyrosequenced amplicons. BMC Bioinformatics. 2011;12:38.
12. Reeder J, Knight R. Rapidly denoising pyrosequencing amplicon reads by exploiting rank-abundance distributions. Nat Methods. 2010;7:668–9. 13. Liu Z, Lozupone C, Hamady M, Bushman FD, Knight R. Short
pyrosequencing reads suffice for accurate microbial community analysis. Nucl Acids Res. 2007;35(18):e120.
14. Werner JJ, Zhou D, Caporaso JG, Knight R, Angenent LT. Comparison of Illumina paired-end and single-direction sequencing for microbial 16S rRNA gene amplicon surveys. ISME J. 2012;6(7):1273–6.
15. van Dijk EL, Jaszczyszyn Y, Thermes C. Library preparation methods for next-generation sequencing: tone down the bias. Exp Cell Res. 2014;322(1):12–20.
16. Lassmann T, Hayashizaki Y, Daub CO. SAMStat: monitoring biases in next generation sequencing data. Bioinformatics. 2011;27(1):130–1. 17. Hanage WP. Microbiology: Microbiome science needs a healthy dose of
scepticism. Nature. 2014;512(7514):247–8.
18. Grosskopf T, Soyer OS. Synthetic microbial communities. Curr Opin Microbiol. 2014;18:72–77.
19. O’Sullivan DM, Laver T, Temisak S, Redshaw N, Harris KA, Foy CA, et al. Assessing the accuracy of quantitative molecular microbial profiling. Int J Mol Sci. 2014;15(11):21476–91.
20. Huggett JF, Laver T, Tamisak S, Nixon G, O’Sullivan DM, Elaswarapu R, et al. Considerations for the development and application of control materials to improve metagenomic microbial community profiling. Accred Qual Assur. 2013;18(2):77–83.
21. Lahr DJ, Katz LA. Reducing the impact of pcr-mediated recombination in molecular evolution and environmental studies using a new-generation high-fidelity dna polymerase. Biotechniques. 2009;47(4):857–66. 22. Binladen J, Gilbert MTP, Bollback JP, Panitz F, Bendixen C, Nielsen R,
et al. The use of coded PCR primers enables high-throughput sequencing of multiple homolog amplification products by 454 parallel sequencing. PLoS ONE. 2007;2(2):e197.
23. Crosby LD, Criddle CS. Gene capture and random amplification for quantitative recovery of homologous genes. Mol Cell Probes. 2007;21(2): 140–7.
24. Meyer M, Stenzel U, Myles S, Prufer K, Hofreiter M. Targeted high-throughput sequencing of tagged nucleic acid samples. Nucleic Acids Res. 2007;35(15):e97.
25. Meyer M, Stenzel U, Hofreiter M. Parallel tagged sequencing on the 454 platform. Nat Protoc. 2008;3(2):267–78.
26. Pertoldi C, Tokarska M, Wojcik JM, Demontis D, Loeschcke V, Gregersen VR, et al. Depauperate genetic variability detected in the American and European bison using genomic techniques. Biol Direct. 2009;4:48. 27. Bybee SM, Bracken-Grissom H, Haynes BD, Hermansen RA, Byers RL,
Clement MJ, et al. Targeted amplicon sequencing (TAS): a scalable next-gen approach to multilocus, multitaxa phylogenetics. Genome Biol Evol. 2011;3:1312–23.
28. Shakya M, Quince C, Campbell JH, Yang ZK, Schadt CW, Podar M. Comparative metagenomic and rRNA microbial diversity characterization using archaeal and bacterial synthetic communities. Environ Microbiol. 2013;15(6):1882–99.
29. Caporaso JG, Lauber CL, Walters WA, Berg-Lyons D, Huntley J, Fierer N, et al. Ultra-high-throughput microbial community analysis on the Illumina HiSeq and MiSeq platforms. ISME J. 2012;6(8):1621–4. 30. Altschul SF, Gish W, Miller W, Myers EW, Lipman DJ. Basic local
alignment search tool. J Mol Biol. 1990;215:403–10. 31. Li H, Durbin R. Fast and accurate short read alignment with
Burrows-Wheeler Transform. Bioinformatics. 2009;25:1754–60. 32. Li H, Handsaker B, Wysoker A, Fennell T, Ruan J, Homer N, et al. The
sequence alignment/map (SAM) format and SAMtools. Bioinformatics. 2009;25:2078–9.
33. Koboldt D, Zhang Q, Larson D, Shen D, McLellan M, Lin L, et al. VarScan 2: Somatic mutation and copy number alteration discovery in cancer by exome sequencing. Genome Res. 2012;22(3):568–76.
34. Joshi NA, Fass JN. Sickle: A sliding-window, adaptive, quality-based trimming tool for fastq files. 2011. Version 1.21: Available at https:// github.com/najoshi/sickle.
35. Schirmer M, Ijaz UZ, D’Amore R, Hall N, Quince C. Insight into biases and sequencing errors for amplicon sequencing with the Illumina MiSeq platform. Nucleic Acids Res. 2015;43(6):e37.
36. Edgar RC. Search and clustering orders of magnitude faster than blast. Bioinformatics. 2010;26:2460–1.
37. Wang Q, Garrity GM, Tiedje JM, Cole JR. Naive Bayesian classifier for rapid assignment of rRNA sequences into the new bacterial taxonomy. Appl Environ Microb. 2007;73(16):5261–7.
38. Kircher M, Sawyer S, Meyer M. Double indexing overcomes inaccuracies in multiplex sequencing on the Illumina platform. Nucleic Acids Res. 2012;40:e3.
39. Nelson MC, Morrison HG, Benjamino J, Grim SL, Graf J. Analysis, optimization and verification of illumina-generated 16s rrna gene amplicon surveys. PLoS ONE. 2014;9(4):e94249.