http://wrap.warwick.ac.uk/
Original citation:Gupta, Bishnupriya and Swamy, Anand (2013) Unfree Labour : did indenture reduce labour supply to tea
plantations in Assam? Working Paper. Coventry, UK: Department of Economics, University of Warwick. (CAGE Online Working Paper Series).
Permanent WRAP url:
http://wrap.warwick.ac.uk/59350 Copyright and reuse:
The Warwick Research Archive Portal (WRAP) makes this work of researchers of the University of Warwick available open access under the following conditions. Copyright © and all moral rights to the version of the paper presented here belong to the individual author(s) and/or other copyright owners. To the extent reasonable and practicable the material made available in WRAP has been checked for eligibility before being made available.
Copies of full items can be used for personal research or study, educational, or not-for-profit purposes without prior permission or charge. Provided that the authors, title and full bibliographic details are credited, a hyperlink and/or URL is given for the original metadata page and the content is not changed in any way.
A note on versions:
The version presented here is a working paper or pre-print that may be later published elsewhere. If a published version is known of, the above WRAP url will contain details on finding it.
WORKING PAPER SERIES
Centre for Competitive Advantage in the Global Economy
Department of Economics
Nov 2013 No.177
Unfree Labour: Did Indenture Reduce Labour Supply to Tea
Plantations in Assam?
1
Unfree Labour: Did Indenture Reduce Labour Supply to Tea Plantations in Assam?
Bishnupriya Gupta (University of Warwick) and Anand Swamy (Williams College)1
October 25, 2013
"Mini let's go to Assam, the land of green plantations. Back home there is too much misery.”
An old folk tune from Bengal that refers to indentured labour migration to the tea plantations in the 19th century. The song goes on to “describe how their dream is shattered and curses Jadhuram, the agent, for bringing them to Assam under false pretences.”2
Abstract
Migration to tea plantations in Assam in the 19th century used indentured contracts. These
contracts differed by conditions of harshness. Migration under the Special Act gained notoriety
by giving tea planter the right of private arrest. Using a new set of migration by types of contract,
the paper assesses if harsh terms of indenture discouraged labour flows. We find that regions
using the harsh contract saw lower response to rise in the price of tea. Disaggregating by types of
recruiter, we find that the response to market recruitment was high in all regions, but response to
recruitment using community networks is statistically insignificant, suggesting that informational
asymmetries may be an explanation for continuing migration despite concerns raised by the
nationalist movement, social reformers and policy makers.
1
We thank V. Bhaskar, Joan Maria Esteban, and Andrew Seltzer for discussions and the
participants at seminars in Caltech, the London School of Economics, Royal Holloway, Rutgers, Stanford, Warwick, Williams College and the Annual Meeting of the Economic History Society at Oxford, the World Economic History Congress at Stellenbosch, for comments. Thanks to Dhruva Bhaskar for research assistance, and to Latika Chaudhary for data on railways. 2
2
I. Introduction
Indentured labour has been seen by economists as a solution to a contractual problem that
arises when migrant workers are recruited from distant lands (Galenson 1984). This was a
common contractual form used in the labour market for plantation economies all over the world
in the 19th century. The tea plantations in Assam followed a similar pattern. The cost of
migration was high and the migrants were too poor to pay this cost. Consequently the employers
bore the cost as an advance to the worker and tied the worker to the employer for a number of
years. Typically a worker was tied to an employer for a period of three years. A breach of
contract could lead to arrest and prosecution. One particular arrangement that gained notoriety
was Act 6 or the Special Act that gave the planters the right of private arrest prior to recourse to
the legal system. The introduction of such a system was justified on the ground of the shortage of
magisterial courts and the delay involved in making arrests.
Historians have written extensively about the exploitation of tea plantation workers and
the problems of indenture, as the song quoted above suggests (Behal and Mohapatra 1992 is one
example). Surprising as it may seem, this view was also echoed in the policy circles. The Assam
Labour Enquiry Committee of 1906 was set up to look at the abuse of the system of recruitment.
The committee argued that “such exceptional powers [for employers] are out of date and their
abolition is inevitable” (p. 99). The misery of the tea workers and the harsh system of indenture
became a focus of social and political debates both in India and in Britain. The report was
extremely critical of recruitment methods for tea labour, and claimed that the severity of the
3
workers to these plantations. Labour shortage, the report claimed, was a problem under the
Special Act.
Given the reputational concerns, why did this system of indenture exist? British planters
insisted that because the cost of recruiting workers from far-off regions was high, the worker
needed to be tied for some period until these costs could be recovered. In principle, the planter
could lose the services of the worker for two reasons: he or she could return home, or, more
likely, could be "enticed" by another employer. If the employer was exposed to this risk, planters
argued, he would not recruit in the first place.
The Royal Commission on Labour in India reported that even in 1929, after
transportation had improved considerably, the cost of recruiting a worker was in the range of 150
rupees (p. 359). This is when the wage-rate for an adult man was around 13.5 rupees per month
(p. 387). So the recruitment cost was roughly 11 months’ worth of wages. This gave rise to an
incentive to entice the worker away from another plantation, especially when labour demand was
high.
Historians have been sceptical of the enticement-based rationale (Chatterjee 1995). Some
have argued that indenture was a way of reducing labour costs. The political connections of the
British planters’ made it possible for them to extract from the colonial government legislation
that would work in their favour and against the interests of the workers by preventing workers
who were ill-treated or under-paid from abandoning their contracts. The song quoted above
captures the essence of this. The recruiting agents mobilized labour with false promises and once
on location, the conditions turned out to be quite different. The song also suggests that migrant
4
was attractive. More recently, while not contesting the nationalist critique, Behal and Mohapatra
(1992) have argued along the lines of the influential 1906 report that eventually indenture may
not have served the planter well: the fear of being abused in an indentured labour contract made
Assam an unattractive location for migrants, which led to labour shortages. Indenture may have
strengthened the hand of the planter once the worker arrived, but it made it more difficult to
recruit the worker in the first place.
The worker’s choice to migrate depended on conditions on the plantation, for example,
the wage offered, hours of work etc. It also depended on the harshness of the contract, e.g.
Special Act with the right of private arrest versus other less severe forms of indenture. The
worker who can be arrested by his own employer may fear that, once s/he gets to the plantation
s/he is virtually a prisoner, and that any prior commitments made by the employer will not be
honoured. Therefore, irrespective of what terms are offered, it may be difficult to recruit under a
harsh indentured labour contract. Thus, the impact of such an arrangement on recruitment
depends whether the “Enticement Prevention Effect” or the “Discouraged Worker Effect” is
stronger. The former refers to the employers’ ability to recover initial costs and the latter to the
failure to get workers under a harsh contract.
. The contractual arrangement differed within a region as well as across regions. While
almost all the labour recruitment was under some kind of indenture, the harshest kind of
indenture was supported by Assam’s Special Acts. Other tea-growing regions in eastern India
such as the Dooars and Darjeeling did not use the Special Act or indeed any form of indenture.
Even within Assam the share of “Act Labour” (workers recruited under the Special Act) varied
5
Assam allows us to assess the relative impact of the two (potential) features of the Special Act
we have discussed above: its role in preventing enticement, and its role in discouraging
migration. . We use a panel data set on labour migration to the seven main tea-growing districts
in Assam over the period 1883-1900.
Our empirical work is driven by the following intuition. When the price of tea rises
there will be additional derived demand for labour. 3 If enticement concerns are small, and the
discouraged workers effect worker effect is large, “non-Act” flows should increase and Act
labour flows should not . On the other hand if enticement is a major concern for employers and
the discouraged worker effect is small, Act labour flows will increase, and non-Act labour flows
will not. Finally, if enticement concerns are large and the discouraged worker effect is also big
there may be little response in labour flow to the price of tea. Of course, there could be
variation within various regions of Assam in which case applies.
We find that free labour flows are quite responsive to tea-price shocks. This suggests that
at least in some parts of Assam enticement concerns were relatively small. Regarding flows of
Act labour, our findings are more complex. The flow of Act workers who are hired by
community members already on the plantation (“sardars”) is completely unresponsive to tea
price shocks. Workers in this category do, however, flock to the plantations when conditions in
the recruiting regions are bad. This suggests that Act labour had a bad reputation among the
communities in which they had already been hired, presumably because information about poor
3
6
conditions had filtered down. Hence, only “push” factors could induce migration, whereas
“pull” factors could not.
However, flows of Act labour hired by market contractors are highly responsive to price
shocks. This is consistent with a story in which, as the song quoted at the beginning of this paper
suggests, some potential migrants were not discouraged by the Act because they were poorly
informed. Thus, overall, increases in the demand for labour were, in the short run, met either by
hiring non-Act labour, or by hiring Act labour through market contractors rather than existing
workers’ personal connections. We conclude that enticement was a concern for some employers,
and that the discouraged worker effect of the Special Acts likely operated for a subset of
well-informed workers.
The remainder of the paper is organized as follows. Section 2 discusses the origins of the
industry and the institutional arrangements adopted in recruitment. Section 3 sets out a
theoretical framework for empirical testing. Section 4 presents the empirical results and section 5
concludes.
II. Origins of the Tea Industry and Indenture
The tea industry in Assam dates back to the 1830’s. Tea was in high demand in Britain,
and when it was “discovered” growing in the wild in Assam, a profitable investment opportunity
presented itself. The first commercial enterprise, the Assam Company, was formed in 1839, but
the explosive growth of the industry was in the second half of the nineteenth century.
Eventually, tea came to be grown in three regions in Eastern India -- Assam, Darjeeling in the
7
region developed in the Nilgiris in Southern India. The companies across regions shared
common, largely British, ownership and were managed by the same set of British managing
agencies.
The colonial state provided support to the new entrants. Land grants were given to British
companies to set up tea plantations. Tropical forests had to be cleared and tea planted, tasks that
were labour-intensive. But Assam was thinly populated. Planters also considered the local
population lazy and unproductive (Griffiths 1967). So, it was necessary to “import” labour from
the more densely populated parts of India. Assam was physically and psychologically very far
off, and migrants came from some of the poorest parts of India, such as the tribal regions of
Santhal Parganas and Chota Nagpur, several hundred miles away. The migrants often moved
when times were bad, so it was not likely that they could fund their own travel; hence these costs
had to be paid by the planter. So, the planter was making an upfront investment which could be
recouped only if the worker stayed for a sufficient period when his/her productivity exceed the
wage. As we have mentioned, the initial investment was large, even in the twentieth century,
after improvements in transportation reduced travel costs. Especially when the industry was
growing rapidly, it was much cheaper for the manager of a new tea-garden to “entice” workers
from another garden, than import a worker from far away. The problem is described in the
memoir of a planter, recollecting a boom period in the 1890’s:
8
We find a first-person account of this in the memoir of A.R. Ramsden (1945), who went to
Upper Assam in the early 1920’s. Ramsden (p. 136) is describing his efforts to open a new
garden.
There was what might be called a gentleman’s agreement amongst all European-owned tea gardens in Assam not to employ each other’s coolies, but in practice it often broke down. There was a labour shortage in Upper Assam, and most of the managers suited their own convenience in this respect. Like every other manager of a new garden I soon got a bad name for enticing labour, not that it worried me at all. I wanted a vast amount of work done at any cost and I got it done.
The case of a worker who took an advance and then “absconded” was by no means new to
British or British/Indian jurisprudence (Anderson 2004). So, as one might expect, the first
response was to transplant to Assam legislation that was already in use in another location. The
legislation that was transferred was the Workman’s Breach of Contract Act (WBOC) of 1859,
which had first between developed for use in the Presidency Towns (Bombay, Madras, and
Calcutta). The worker was tied to the plantation for three years. The penalty for breaching the
contract was that s/he could be reported to the administration, leading to his/her arrest. The
worker could be imprisoned for three months, but most likely returned to the employer.4
Had Assam limited itself to the WBOC, it might not have gained such notoriety. But the
planters lobbied to get them themselves a “Special Act”, which strengthened their powers
enormously: a planter could personally arrest an absconding worker. The Special Act was
formalized in 1863 and changed several items, with 1882 being a landmark revision. Planters
were given the right of private arrest without recourse to the police, on the ground of the shortage
9
of magisterial courts and the delay involved. Longer contracts were permitted then under the
WBOC (five years rather than three). Over time the terms of the Special Act were strengthened
to favour the planter. Initially the contract had to be signed in the recruiting district with some
administrative oversight to reduce the likelihood the worker was being deceived or misinformed.
Later, contracts could be signed in the district where the plantation was located, rather than in the
recruiting district. The right to engage in private arrest was also strengthened. At the outset
there was the restriction that planter had to seek a warrant if there was a magistrate within ten
miles. This was lifted. The planter was also allowed to depute others to arrest an “absconder”
(Behal and Mohapatra 1992, p. 149). Under the Special Act any person suspected of desertion
could be detained at railway stations and steamer ghats. 5
Cultivating and Recruiting Regions and the Type of Indenture
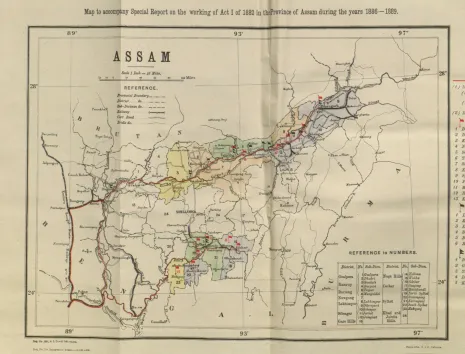
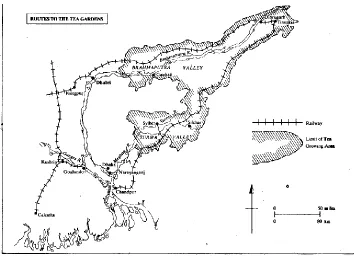
The map in figure 1, taken from the Royal Commission on Labour (1931), shows the
tea-growing regions with squares, and reader will see Assam on the top right. There are two tea
growing regions in Assam, the districts of Sylhet and Cachar in the Surma Valley and the
districts of Goalpara, Kamrup, Darrang, Nowgong, Sibsagar, and Lakhimpur in the Brahmaputra
Valley. The reader can look at figure 7 to get a quick sense of the geography of the region and
the location of the tea gardens. As of 1929, Assam employed more than half of all plantation
workers in colonial India (Royal Commission on Labour 1931, p. 357). The Brahmaputra valley
had more than twice as many workers as the Surma Valley. As we have mentioned earlier, the
late 19th century was a period of expansion of acreage, and there was a secular rise in
5Once the initial contract expired, workers entered into new contracts. These “time expired”
10
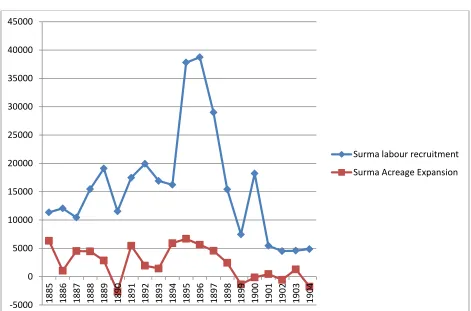
employment. Figures 2A and 2B show the broad trends in expansion in acreage and recruitment
of labour. Surma Valley saw a big spurt in expansion of acreage and recruitment in the middle
of the 1890s--this is the period Fraser (1935) is referring to in his comment (quoted above) about
enticement.
The dots in the figure 1 show the recruiting regions for Assam which, as can be seen, are
spread in regions in Central and Northern India as well as large parts of Bengal Presidency in the
East. Two key recruiting regions were Chota Nagpur (CN) and Santhal Parganas (SP) in Bengal.
These were regions were inhabited by tribal populations. Given the famine conditions in this
part of India in the 1870s and 1880s migration was often only option for many families
(Chakravarty 1978, Mohapatra 1985). In 1927-28, the resident labour force in Assam came from
the following locations: 210,672 from U.P., Bengal, and Bihar; 181,479 from Chota Nagpur and
Santhal Parganas, 74,337 from Central Provinces, 58, 834 from Madras and 53,264 from within
Assam (Royal Commission on Labour in India, Volume 6, p. 4). Annual migration to Assam
from three broad regions is shown in figure 3.
There are some striking relationships between the recruitment region, the hiring region,
and the type of contract. Information on these is provided in tables 1 and 2, and figures 4 and 5.
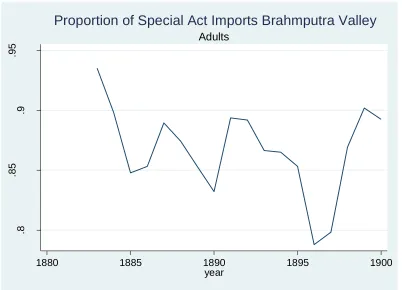
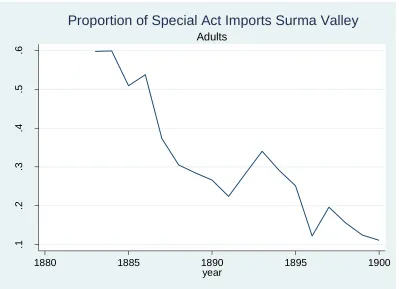
The following patterns emerge: (i) Reliance on Special Act was high, and remained high, in the
Brahmaputra Valley (figure 4); it declined rapidly in Surma Valley (figure 5), (ii) The
Brahmaputra Valley relied more heavily on labour from Chota Nagpur (table 1); (iii) Consistent
with (i) and (ii) we find in table 2 that more than half of Act workers came from Chota Nagpur.
Why did the Brahmaputra Valley rely more on workers from Chota Nagpur? And why
were they more likely to be Act Labour? The answer to the former question is not easy to
11
argued workers from Chota Nagpur were “hardy” and better able to withstand the climate of the
Brahmaputra Valley (where rainfall was high and malaria was endemic) than workers from
North-western Provinces; (ii) Consistent with this, workers from NWP were reluctant to go to
the Brahmaputra Valley because the change in climate and living conditions was too great. These
workers were also in demand in the tea growing regions of Northern Bengal, an area much closer
to the recruitment region. Coal mines were another employment opportunity. There was
competition among the employers across industries for workers from the same regions. Coal
mines paid better and did not require indenture. All evidence points to a choice on the part of the
workers, which was the worker’s side of the contractual problem. The workers could choose
employers in different regions and in different industries. If contractual arrangements were harsh,
the worker could choose not to enter into a particular contract. Assam became notorious for the
ill treatment of the worker and by all contemporary accounts found it difficult to recruit workers.
As the cost of recruitment was high, employers in Assam viewed the Special Act as a means of
retaining workers
To see the geography of this the reader can look at figure 6, where the Eastern Bengal
railroad is on the extreme left. The third location from the top is Jalpaiguri, which was the
urban centre of the tea growing regions in North Bengal. A worker coming from Chota Nagpur
could take the train up to Jalpaiguri relatively easily. In contrast, to get to the tea-gardens in the
Brahmaputra Valley the worker would first have travel north. Then s/he would travel east; the
“coolie” route to the Brahmaputra Valley is marked in the upper part of the map, with single
flags indicating the points where workers disembarked the steamers that took them up the river.
12
Nagpur was Rs 115, while a worker from North Western India (U.P.) could be recruited for Rs
60. Surma Valley employers, who were less reliant on workers from Chota Nagpur and hired at
less expense from closer-by in Bengal or from U.P. were willing to rely on the weaker WBOC
rather than the Special Act.
The 1905 Gazetteer of Sylhet (in the Surma Valley) makes the above argument explicitly
(p. 137):
The climate of Sylhet is not unsuited to the natives of the United Provinces and planters are thus enabled to work their gardens with labourers who in Assam [i.e. the Brahmaputra Valley] would quickly sicken and die. The coolies who are most difficult to procure and cannot as a rule be imported to Assam for less than one hundred rupees per head are Sontals and other jungly tribes from the Chota Nagpur plateau. Of them there are comparatively few [in Sylhet] and one the most important assets in the planter’s favour in Sylhet is the fact that he can obtain his own labour at fairly moderate rates.
But still, the gazetteer goes on to argue, the total cost of importation was high, and the
planters even in Sylhet wanted some protection against desertion and chose to rely on the weaker
form of indenture, WBOC.
Most migrants travelled via Calcutta to Kustia and then Goalundo on the Bengal-Assam
border either by train or by the river Ganga (see figure 7). They then went by steamer up the
Brahmaputra River to upper Assam and by country boats to the Surma valley.6 The first took
two to three weeks to the northern most point and second three weeks although the distance was
less. (Shlomovitz and Brennan 1990) The conditions of travel were harsh and death rate was
high. But transportation improved over time. The railway line came to Goalundo in 1872. In
6
13
1875 Dhubri on Brahmaputra River became the point of disembarkation and in 1883 fast daily
mail steamers were introduced on the Brahmaputra River. In 1885 steamers replaced country
boats in the Surma valley. Table 3 shows the decline in journey time after 1885. The Surma
Valley was now more accessible to migrant workers relative to the Brahmaputra Valley. “Free”
workers from North-western India travelled to the Surma valley and entered into contracts on
location. The Special Act was no longer so attractive to employers in the Surma Valley. The
annual report on labour migration to Assam (1885) writes (p.2): “The Deputy Commissioner of
Sylhet [in the Surma Valley] repeated his opinion that the Special Act is not required now that
communication with Assam is so easy.” However in the same report the Deputy Commissioners
of Darrang, Lakhimpur, and Sibsagar, in the Brahmaputra Valley, supported the Special Acts and
recruitment continued to rely on the harsher form of indenture.
Recruitment Methods
There were two ways to recruit. The first was via professional contractors, who often had local
agents known as the “arkatti”. The second way was to send a plantation worker to go back to his
native village and recruit others from the community (“Sardari”).7 This took longer and more
planning. In either case the employer had to bear the cost of recruitment in the form of an
advance, that is the costs of travel of the worker and the commission to the recruiter. The sardari
system used community ties as the means of recruitment and the contractors used the market.
Recruitment by contractors was more expensive (part of the cost was his commission)
suggesting that given the labour shortage the contractors held some bargaining power. The
sardars were in the employment of the plantations and rates were fixed in advance. In 1889, in
the remote plantations in the Brahmaputra valley in Upper Assam, the cost of recruiting a worker
7
14
was Rs 100 via a contractor, but only Rs 45-58 via a sardar. In 1893, based on data from 77
plantations, contractors-recruits cost Rs. 105 per worker, compared to Rs. 82 for sardar-recruits
(Report of the Labour Enquiry Commission 1896).
Various official reports provide the perspectives of the managers on the suitability of
different types of recruitment. The consensus was that sardari workers were better than the
contractor recruits. The latter were discontented as they did not have a social network or families
and were more likely to desert to work for another employer. The proportion of dependents
among sardari recruits was over 50% in 1900, whereas for contractor-based recruits it was less
than 20% (Report of the Assam Labour Enquiry Committee, 1906). It was claimed that the
managers of unhealthy and distant gardens were compelled to employ contractors (Special
Report 1890, p. 14) Contractors sent inferior workers who were less efficient, and less adapted to
the climate. In Surma valley this system was not used unless absolutely necessary.
But there were situations when demand was high and recruitment had some urgency. The
social network based recruitment might have failed in these contexts either because of time
constraints or the need to keep trusted workers on the plantations when demand was high.
Consequently, the planters relied on the market mechanism and used contractors in these
situations. Given the difficulties of recruitment in the preferred regions of Chota Nagpur and
Santhal Parganas, planters in the Brahmaputra valley used contractors more frequently.
Were “Act Workers” Worse off? Qualitative Evidence
In this section we consider whether “Act Workers”, i.e. those hired under Assam’s
Special Act, were worse-off than other workers. To the extent this was true, this would have
15
rates, commentary by managers and officials, and desertion rates. All of these are informative
regarding our central question, but not conclusive and set the stage for our statistical work.
The first type of evidence, that of physical abuse of workers is, as we have mentioned,
abundant. Planters’ memoirs are frank in their description of physical abuse of workers and even
in the late 1920’s the Royal Commission on Labour received similar complaints. 8
However, the
evidence is not sufficiently specific to identify whether Act labour were more subject to violence
than workers under other types of contracts.
The second type of evidence, death rates, is consistent with the view that Act Labour was
treated worse: death rates are higher for them than for WBOC9 workers (see last two columns of
table 4). . We cannot, of course, rule out the possibility that Act workers were less healthy to
begin with. This could be because worse-off workers became Act Labour, or workers from
drought-stricken regions tended to migrate. Behal and Mohapatra (1992) argue that in Assam
wages were low and cost of living was high. Quality of housing and sanitation was poor and this
resulted in high death rate among the workers- 5.4 % among adult Act workers, 3.07% among
WBOC workers and 2.4% among other Assam population. The birth rate was 86 per thousand
among tea workers, lower than in the rest of Assam (127 per thousand).
Third, we find discussion in the reports and memoirs on the reluctance of workers to go
to the Brahmaputra valley. The manager of a coal mine of claimed in Bengal argued that there
were two reasons why coolies don’t want to go to Assam – lack of freedom and development of
industries close to home. Indenture was one great reason for unpopularity as workers could not
8
In his dairy F.A. Hetherington (1994, p. 92) notes on May 29, 1903: “Sent for Behari [a
plantation worker] and gave him a bottle of rum. It is the best way to deal with a coolie: half kill him when he plays the fool and then show him how kind you can be if you like.”
9
16
come and go as in coal and the railways. The view was echoed by Dr O’Connor Sitarampur who
had worked in Assam and then moved the coalfields. The “coolie” was unwilling to go to Assam
as it had a bad name. Comparing the tea garden coolie with the miner, Dr O’Connor argued that
“the latter is a free man”, does not work more than five days a week and can leave when he
pleases”.(Assam Labour Enquiry Report 1906, p6) On the other hand, Mr Simpson, a former
manager of an Assam Co, in his evidence to the Assam Labour Enquiry Committee of 1906,
argued that upper Assam could never do without an Act with provisions of penal contract as the
pay would have to a much higher to attract workers or the worker given a bonus to stay in the
garden (p. 17).
Consistent with the view that the Special Act was unpopular, desertion rates are higher
among Act workers, compared to WBOC, in both valleys (table 4). However, there are other
interpretations of this finding. Most of the WBOC workers had spent a longer time in the
plantation. For many it was the second contract. Therefore, they were more acclimatized and less
likely to leave. Recent migrants were more likely to desert or be enticed away, and employers
may have preferred to hire them under the Special Act. In 1891, 55% of workers in Assam were
under the Special Act and another 40% were under the WBOC. When workers who had come to
Assam under the Special Act had served their term, they refused to re-sign under this Act and but
were willing to sign up under the WBOC.
The literature on push factors on decision to migrate suggests that famines and high food
prices were important. Chakravarty (1978) argues that land scarcity lowered living standards and
increased the probability of migration. Mohapatra’s quantitative exercise (1985) using census
17
of these regions and attributes it to the institutional changes which increased vulnerability to
climatic shocks.
Given the qualitative evidence, it seems plausible that the Special Act had both the
impacts we discussed in the introduction to this paper: it protected employers from enticement
as well discouraged worker migration. The next section of this paper provides a simple
theoretical framework for thinking about how the relative sizes of these effects would impact
labour flows of different types.
III. Theoretical Framework
We consider a stylized setting in which both the problem of enticement and the Discouraged
Worker Effect exist. The volumes of different types of labour flow (indentured and free) will
depend on the relative magnitudes of these effects. We identify the set of possibilities (“cases.”)
The empirical work then explores which of these cases is most consistent with the data.
Assumptions
1. Production function F(l, µ) where l is labour and µ represents complementary inputs such as land.
2. Firm is a price taker.in the product market. P is the price of tea.
3. The cost of recruiting free migrant is c.
4. Firm is a price taker in the market for free labour and has to pay W to get workers.
5. If indentured workers can be ill-treated, this may lower the wage eventually paid (W*),
but this will raise the recruitment costs. Contractors may have to use coercion, find
18
indentured worker is c*, where c* > c. We take the Discouraged Worker Effect as
meaning, W* + c* > W + c. (Indentured labour is more expensive).10
6. A firm that entices might face criticism from neighbours, or even some form of collective
punishment. The expected value of social sanction faced by an enticer is S.
In principle, at the start of the season, an employer has four options: (i) Hire free labour; (ii)
Entice free labour; (iii) Hire indentured labour; (iv) Don’t hire. If one additional worker is hired
(or not) the potential benefit in each of these cases is:
(i)PFl(l, µ) – W – c
(ii) PFl(l, µ) – W – S
(iii) PFl(l, µ) – W* – c*
(iv) 0
We can now consider three scenarios.
(A)Enticement is Not a Concern for Employers
This will occur if S > c. Employers will choose the cheapest option (i),that is they will import
free labour. Flows of free labour will rise in response to an increase in the price of tea. Flows of
indentured labour will not.
(B)Enticement is a Concern for Employers, Discouraged Worker Effect is Small
If S < c, this rules out the hiring of free labour, because an employer knows they will be enticed.
If (W* + c*) is not too large, so that (iii) > 0, indentured labour will be hired.
19
Now we have the opposite prediction compared to case A: Flows of indentured labour will rise in
response to an increase in the price of tea. Flows of free labour will not.
(C) Enticement is a Concern for Employers and Discouraged Worker Effect is Large
This will occur if S < c and (W* + c*) is high, so that (iii) < 0. Now flows of neither free labour
nor indentured labour will be responsive to the price of tea.
While the discussion above has focused on “pull” factors, “push” factors are also
important. Conditions at home as well as the expected wage at the plantation will affect the
extent of migration. If we think of push factors as being summarized by real wages, migration
will decrease in the nominal wage at home, and increase with the price level at home. These
“push” factors will operate for both free and unfree labour.
It is also possible that, the responsiveness to the price of tea may vary across the two
types of Act labour: those hired by contractors, and those hired by a community member
(sardars). It is not clear a priori what we should expect regarding responsiveness to the price of
tea. On the one hand the sardar is likely to be more trusted and the contractors often had a bad
reputation, as discussed above. On the other, the sardar had a small recruitment area (his home
region) whereas the contractor could range wider, and an employer may have had access to wide
array of them. The net effect could go either way.
Data
Our figures for annual migration to the plantations, by district, are taken from the annual
report compiled by the administration. Broad patterns for the two regions broken down by
20
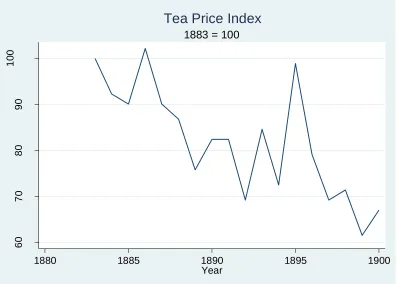
the Department of Commercial Intelligence and Statistics (1928). We use the average of the
values of the three types of tea grown in India (Pekoe, Souchong, and Congou). Figure 10 shows
that the price fell steadily over our period, due to competition from Ceylon and reductions in
costs of warehousing and distribution. But there were fluctuations. An index of 100 prices,
mostly food products, is taken from Government of India (1919). We use a base of 100 in 1883,
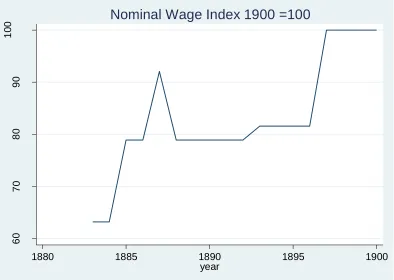
and the trends are reported in figure 12. The best proxy we can find for earnings in the
recruitment regions is the nominal wage in Calcutta, from Williamson. In figure 11, the wage is
rather “sticky” at least in part due to measurement issues.
IV. Empirical Exercise
Before we turn to our regression analysis, we should reiterate one fact that points to the existence
of enticement concerns: the contrast between Surma Valley and Brahmaputra Valley. An
inspection of figures 4 and 5 reveals the extraordinarily high reliance on Act labour in the latter,
and the much lower (and falling) reliance in the latter. This can be understood in our framework
as follows. In Surma Valley the cost of recruitment was low, because workers can came from
relatively nearby (see above). Also, gardens were geographically close to each other, so
neighbouring planters would know and could “punish” each other. It is quite likely that S > c
(stealing workers is not worth the social stigma). And as travel costs fell over time, the
condition that S >c would becoming applicable to more and more plantations, leading to a
decline in the use of Act labour. In the Brahmaputra Valley, as we have seen above, workers
came from the far-off tribal areas. So c was high. And plantations were quite distant from each
other, so social sanctions may have been hard to impose. So c > S, and with enticement being a
21
In table 5 the first dependent variable is the log of “non-Act labour” i.e. adult labour entering in
the given year that is not under the Special Act. The next column has, as dependent variable, the
log of labour brought under the Special Act. The last two columns break down Act labour:
column 3 has the log of the number of labourers brought by contractors under the Special Act,
and column 4 has the log of the number of labourers brought by Sardars under the Special Act.
The explanatory variable of greatest interest to us is log of the price of tea, The represents the
pull factors or demand shocks, as discussed above. We include the log of an index of the
nominal wage in Calcutta and the log the price index to capture the push factors: we expect the
former to enter negatively (it raises the real wage in the recruiting regions) and the latter to enter
negatively (it lowers the real wage in the recruiting regions).
include district dummies, and a railway dummy, We also include a measure of rainfall as well as
a time-trend for each of the two regions, Brahmaputra Valley and Surma Valley. .
The first two rows of table 5 contain the coefficients of greatest interest. Logav2price is the log
of the average of the current price of tea and the price the year before (to account for lags in
labour migration). “Slogav2price” is the interaction between the above variable and a dummy
for Surma valley. Thus the impact of logav2price on log of non-act labour flow in the current
year in the Brahmaputra Valley is 1.9; the same effect for the Surma Valley is 1.9+ 2.948. One
result that will immediately strike the reader is that labour flows to the Surma valley are more
responsive to demand shocks than are labour flows to the Brahmaputra Valley. This is as we
22
The importation of non-Act labour is highly responsive to the price: the elasticity is 1.9 for the
Brahamputra Valley and close to 5 for the Surma Valley. This suggests that at least in some
regions and for some workers, employers, especially in the Surma Valley, were not overly
worried about enticement and very willing to hire without Special Act contracts (case A above).
Column 2 provides information suggesting that Act labour flows respond positively to the price
of tea in Surma Valley, but there is no clear evidence of this in Brahmaputra Valley. However,
as we will will see below, “unpacking” Act labour into its two types is more revealing.
In column 3 we see that flow of Act labour hired by market contractors is highly
responsive to the price of tea, with an elasticity above 2 for Brahmaputra Valley and above 8 for
Surma (2.4 + 5.8). This looks like Case B above: employers want Act labourers and can get
them. The results in column 4 provide a dramatic contrast. Flows of sardar labour are entirely
unresponsive to the price of tea. The coefficient for Brahmaputra Valley is negative (and
insignificant) and that for Surma is positive and small (-0.819+ 1.044 = 0.25) and not significant.
Case C seems to apply: Employers may want Act labour but cannot get them from the
communities where they have already recruited. How can we explain the contrast between
contractor-Act labour flows and sardar-Act-labour flows?
One plausible hypothesis is that the discouraged worker effect applied to potential
sardar-labour recruits because they knew how bad conditions were on the plantation for Act workers.
This information could be obtained from the sardar himself. So, they would go to Assam as Act
workers only when conditions were dire at home. And indeed we do see sardar Act labour
migrating when the price index is higher (and real wages at home would be lower). Of course
23
quickly to demand conditions. It is also possible that some contractors coerced workers into
migrating. Still, a zero response of sardar-recruited Act labour to the price of tea is suggestive of
“stickiness” consistent with the discouraged worker effect.
The nominal wage in the recruiting region enters negatively (as expected) and is significant in
two out of four cases. This suggests the importance of “push” factors. The broad price level
always comes in positive and significant; we interpret this as meaning that migration is high
when the general price level is high, leading to low real wages in the recruiting regions.
One concern regarding theseresults is that they are misleading because the price of tea is
endogenous, i.e. correlated with the error term. For instance, a good weather shock could raise
output and labour inflow; the higher output would also reduce the price of te (we have a control
for rainfall, but it may not adequately control for weather conditions).
We cannot rule this out, but our focus has been on the relative size of the responses of
different types of labour flows to demand shocks. It is hard to see why endogeneity would bias
coefficients differentially, to yield the contrasts described above. For instance is not clear why
an unobserved weather shock would bias the coefficient on contractor-Act-labour upwards, but
not the coefficient on sardar-Act-labour.
V. Discussion and Conclusion
Events occurring after the period we have analysed also point towards the presence of a
24
Report, of 31 witnesses (workers) interviewed in the recruiting areas, 28 were reluctant to go to
Assam because of the penal contract and its consequences (Behal 2006, p. 144).
Also, in the debate on the Special Act, as reflected in the Report of 1906 in Surma
Valley the planters themselves wanted the Special Act repealed, because it was giving Assam a
bad reputation. But planters in the Brahmaputra Valley favoured retention of the Special Act.
This contrast can be explained by comparing the relative importance of the Discouraged Worker
Effect and the Enticement Prevention Effect in the two regions. Since, as we have seen earlier,
labour was easy to get in the Surma Valley, the Enticement Prevention Effect would not be so
important for employers – the Discouraged Worker Effect would dominate, and the planters
would want to eliminate the Special Act if its negative reputation affected other types of
recruiting as well. The Discouraged Worker Effect would operate in the Brahmaputra Valley as
well, but here, because labour was more costly to recruit, the Enticement Prevention Effect
would be more salient – hence planters would push for the retention of the Special Act.
If the Discouraged Worker Effect does exist, it leaves us with a puzzle: why would
profit-maximizing employers lobby for an institutional arrangement that made it harder to recruit?
Weren’t there other solutions to the problems of “enticement”? One solution was for the state to
pass a law making “enticement” illegal, and fine employers who engaged in this practice (Naidu
2010). The Special Act did this, but, given the difficulties in detection and the planters’ political
power, the law was not enforced. Another solution was for planters to form associations, and
agree on rules that would forbid enticement. This was done in the Dooars, a tea-growing region
in Bengal much closer to the recruitment regions.11 In Assam, planters’ memoirs suggest this did
25
not work and efforts to resolve this issue could even undermine the association itself. This is not
terribly surprising: if the gain from “enticing” is high (because recruitment costs are large), and
plantations are at some distance from each other (so mutual monitoring is difficult), as was the
case in the Brahmaputra Valley, employer collusion along these lines would have been difficult
to enforce. Employers could also discourage enticement by offering bonuses to workers who
stayed on; this was done, and could take the form of grants of small plots of land (Behal 2006).
It is possible that such offers were not sufficiently credible to prevent workers from being
enticed away. Yet another method of preventing enticement, which was used in South India
and in the Dooars, was to make the sardar liable if any of the workers he brought “deserted.” It
is not clear why this arrangement was not used in Assam (to the best of our knowledge); in any
case this method could not have been used with contractor-based recruitment.
Finally, even if the Special Acts did serve the purpose of protecting the planters from enticement
of their workers, this does not mean the arrangement was “optimal” in any sense. As we have
discussed, workers seem to have been ill-treated in a variety of ways. The same outcome
(migration to a growing industry) could have been achieved under other, more humane,
arrangements. At the simplest level, inspections of working conditions on the plantations could
have been made more effective. More easily accessible courts could have been established,
eliminating the argument for private arrest. Perhaps most realistically, the government could
have subsidized travel to the plantations, for instance by running free special trains or steamers
26
from the recruiting regions to Assam, thereby reducing the planter’s upfront costs. The
government’s expenses for such initiatives could have been recovered via a tax on tea sales. But
all of these measures required a more pro-active state. This was not consistent with the
intellectual culture of British officialdom in late nineteenth century India. It was also the case
that while the tea planters were a highly organized and politically powerful group with close
links with the colonial state, workers were not unionized, and the nationalist movement had not
gained sufficient strength by the late nineteenth century.12 The problem of “enticement” was
real, but the particular solution chosen, the Special Act, which empowered planters at the
expense of workers, was dictated by the politics of the time
12
27
Figure 1
28
Figure 2A: Increase in Acreage under Tea and Recruitment: Brahmaputra Valley
29
Figure 2B: Increase in Acreage under Tea and Recruitment: Surma Valley
Source: Assam Labour Enquiry Committee 1906. These are annual changes, not stocks. -5000 0 5000 10000 15000 20000 25000 30000 35000 40000 45000 18 85 18 86 18 87 18 88 18 89 18 90 18 91 18 92 18 93 18 94 18 95 18 96 18 97 18 98 18 99 19 00 19 01 19 02 19 03 19 04
Surma labour recruitment
30
Figure 3: Recruitment by Region
Source: Assam Labour Enquiry Committee 1906. These are annual flows, not stocks. 0
5000 10000 15000 20000 25000 30000 35000 40000 45000
CN- SP
Other Bengal
31
Figure 4
Source: Authors’ computation using data from Annual Labour Migration Reports. The Y-axis has the proportion of workers migrating to Assam in a given year who were hired under the “Special Act.”
.8
.8
5
.9
.9
5
a
ct
ra
ti
o
1880 1885 1890 1895 1900
year
Adults
[image:33.612.74.476.101.391.2]32
Figure 5
Source: Authors’ computation using data from Annual Labour Migration Reports. The Y-axis has the proportion of workers migrating to Assam in a given year who were hired under the “Special Act.”
.1
.2
.3
.4
.5
.6
a
ct
ra
ti
o
1880 1885 1890 1895 1900
year
Adults
[image:34.612.76.475.101.390.2]33
Figure 6
34
Figure 7
35
Figure 8
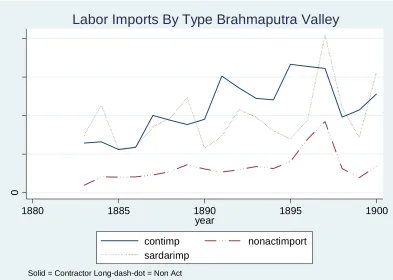
Source: Authors’ computations from Annual Labour Migration reports
0
5
0
0
0
1
0
0
0
0
1
5
0
0
0
2
0
0
0
0
1880 1885 1890 1895 1900
year
contimp nonactimport
sardarimp
Solid = Contractor Long-dash-dot = Non Act
36
Figure 9
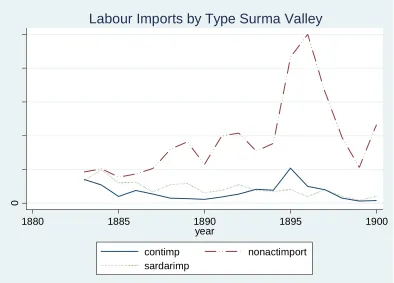
Source: Authors’ computations from Annual Labour Migration reports
0
5
0
0
0
1
0
0
0
0
1
5
0
0
0
2
0
0
0
0
2
5
0
0
0
1880 1885 1890 1895 1900
year
contimp nonactimport
sardarimp
37
Figure 10
Source: Department of Commercial Intelligence and Statistics (1928).
60
70
80
90
1
0
0
T
e
a
p
ri
ce
I
n
d
e
x
1880 1885 1890 1895 1900
Year
1883 = 100
38
Figure 11
60
70
80
90
1
0
0
n
o
mw
a
g
e
1880 1885 1890 1895 1900
year
39
Figure 12
Source: Department of Statistics, Government of India (1919).
1
0
0
1
1
0
1
2
0
1
3
0
1
4
0
1
5
0
in
d
e
xw
1880 1885 1890 1895 1900
year
40
Table 1 : Share of Workers by Workers by Recruitment Regions
Region Total workers % from CN % from other parts of Bengal % from UP % from Central Provinces % from Madras % from Assam
Sylhet 144,876 16 15 28 9 7
Cachar 50, 287 16 22 11 9 39
Sibsagar 145, 532 39 18 1 11 3 26
Lakhimpur 1,30,256 40 20 2 13 2 21
Nowgong 20,263 29 12 1 28 26
Darrang 79,513 38 13 2 15 4 24
[image:42.612.65.550.395.538.2]Notes: From district gazetteers. For Sylhet, the figures are based on workers “imported” over 1890-1900. For the others this is “composition of the labour force” in 1901. The gazetteers did not provide a comprehensive breakdown, so the percentages do not add up to 100. Sylhet and Cachar are in the Surma Valley and the remaining districts are in the Brahmaputra Valley.
Table 2: Share of Migrating Workers in Recruiting Regions by Contract
1886 1888
Act Non Act Total Act Non Act Total
Bengal 23.6 28.3 26.4 20 27 24
NW 17 23 21 14 25 21
Chotanagpur 55 39 46 61 40 48
Nepal 0.1 0.2 0.2 0.04 0.16 0.1
Madras 0.4 1 0.7 0.5 0.9 0.8
Bombay 0.1 0.1 0.1 0.01 0.2 0.1
Assam 3 8 6 4 7 6
41
Table 3: Table: No of days of travel from Goalando
Year Brahmaputra Valley Surma Valley
1877 18.7 23.0
1884 15.6 21.0
1886/7 12.3 17.0
1888 7.4 11.5
1895 7.2 4.6
1898 6.4 4.1
Source: Brennan and Shlomowitz (1990).
The reader can locate Gaolondo, one of the entry points into the Assam tea-growing regions, in the bottom left-hand corner of figure 7.
Table 4: Percentage Desertion and Death by Contract
Desertion by Contract Death
Special Act WBOC Special Act WBOC
Brahmaputra Valley
3.1 0.9 5.7 2.3
Surma Valley 7.3 2.5 8.1 3.6
Desertion by Source Region B. Valley S Valley
CN 2.1 3.0
Bengal 1.3 2.0
NWP, Behar, and Oudh
2.5 2.9
Others 2.0 5.4
[image:43.612.71.545.398.587.2]42
Table 5: Response of Labour Migration to the Price of Tea
(1) (2) (3) (4)
VARIABLES lnact lact lcontimp lsardar
logav2price 1.900* 0.575 2.396** -0.819 (0.965) (0.512) (0.936) (0.614) slogav2price 2.948** 2.962* 5.761** 1.044
(1.290) (1.524) (2.627) (1.222)
lnom -0.0540 -1.006** -1.662** -0.313
(0.708) (0.444) (0.769) (0.466) lindex 4.245*** 2.960*** 2.893*** 3.448***
(0.584) (0.509) (0.825) (0.666)
railway -0.325 -0.0520 -0.114 0.0894
(0.200) (0.145) (0.268) (0.147) rain 0.00212 -0.00307* -0.00450 -0.00165
(0.00271) (0.00165) (0.00331) (0.00219)
year 0.0336 0.0209 0.103*** -0.0533***
(0.0357) (0.0177) (0.0324) (0.0189)
syear 0.0917** -0.0427 0.0303 -0.0921***
(0.0395) (0.0408) (0.0720) (0.0333)
sylhet -165.7** 85.84 -49.19 177.2***
(73.90) (75.75) (134.1) (62.00)
cachar -166.4** 85.99 -48.82 177.5***
(73.88) (75.76) (134.0) (61.99) darrang 2.313*** 3.075*** 3.846*** 2.720***
(0.271) (0.122) (0.271) (0.133) nowgong 2.509*** 1.820*** 2.521*** 1.331***
(0.315) (0.134) (0.293) (0.155) lakhimpur 3.679*** 3.966*** 5.096*** 3.159***
(0.335) (0.185) (0.331) (0.211) sibsagar 2.935*** 3.624*** 4.274*** 3.382***
(0.281) (0.125) (0.273) (0.131) Constant -78.33 -43.30 -195.0*** 89.89***
(64.06) (31.06) (57.56) (32.93)
Observations 126 122 122 126
R-squared 0.897 0.930 0.838 0.907
43
References
Andersen, M. 2004. “India, 1850-1930: The Illusion of Free Labour,” in Douglas Hay and Paul Craven ed. Masters, Servants, and Magistrates in Britain and the Empire, 1562-1955, pp. 442-454.
Assam (India). General Department. 1888. Annual Report of Labour Immigration into Assam. Shillong: Government Press.
India. Assam Labour Enquiry Committee.1906. Report of the Assam labour enquiry committee, 1906. Calcutta, Office of the Superintendent of Government Printing
Behal, Rana P. Wage Structure and Labour: Assam Valley Tea Plantations, 1900-47.
http://www.indialabourarchives.org/publications/Rana_P_behal.htm
Behal, Rana P. 2006. “Power Structure, Discipline, and Labour in Assam Tea Plantations under Colonial Rule,” IRSH 51: 143-172.
Rana P. and Mohapatra, P. 1992. “’Tea and Money versus Human Life: The Rise and Fall of the Indenture System in the Assam Tea Plantations 1840-1908,” in E. Valentine Daniel, Henry Bernstein, and Tom Brass ed. Plantation, Peasants and Proletarians in Colonial Asia. London: Frank Cass.
Chakravarty, L, 1978, “Emergence of an industrial labour force in a dual economy: British India 1880-1920”, Indian Economic and Social History Review.
Chatterjee, Piya. 1995. “Secure this Excellent Class of Labour: Gender and Race in Labour Recruitment for British Indian Tea Plantations,” Bulletin of Concerned Asian Scholars, Volume 27: 43-56.
Department of Commercial Intelligence and Statistics, Government of India. 1928. Index Numbers of Indian Prices, 1861-1926. Calcutta: Government of India.
Department of Statistics, Government of India. 1919. Index Numbers of Indian Prices 1861-1918. Calcutta: Superintendent of Government Printing, India.
Duars Committee. 1910. Report of the Duars Committee 1910. Shillong: Eastern Bengal and Assam Government Press.
Fraser, W. 1935. Recollections of a Tea Planter. Published by Tea and Rubber Mail.
Galenson, D. 1984. “The Rise and Fall of Indentured Servitude in the Americas,” Journal of Economic History, Volume 44: 1-26.
44
Hetherington, F. A. 1994. The Diary of A Tea Planter. Book Guild Limited.
Kolsky, E. 2010. Colonial Justice in British India: White Violence and the Rule of Law. Cambridge: Cambridge University Press.
Mohapatra, P. 1985. “Coolies and Colliers: A Study of the Agrarian Context of Labour Migration from Chotanagpur, 1880-1920.” Studies in History, 1: 247-302.
Mohapatra, P. 2004. Assam and the West Indies, 1860-1920: Immobilizing Plantation Labour. In Douglas Hay and Paul Craven ed. Masters, Servants, and Magistrates in Britain and the Empire, 1562-1955, pp. 455-480.
Naidu, S. 2010. “Recruitment Restrictions and Labour Markets: Evidence from Post-Bellum U.S. South. Journal of Labour Economics, Vol. 2, 4: 413-445.
Naidu, S. and Yuchtman, N. 2011. “Coercive Contract Enforcement: Law and Labour Market in 19th Century Industrial Britain.” Mimeo, Columbia University.
Royal Commission on Labour in India. 1931. Report of the Royal Commission on Labour in India. London: His Majesty’s Stationery Office.
Shlomowitz, R. and Brennan, L. 1990. “Mortality and migrant labour en route to Assam, 1863-1924,” Indian Economic and Social History Review, 27: 313-330.