warwick.ac.uk/lib-publications
Original citation:Woodman, Roger, Winfield, Alan F. T., Harper, Chris and Fraser, Mike. (2012) Building safer robots : safety driven control. The International Journal of Robotics Research, 31 (13). pp. 1603-1626.
Permanent WRAP URL:
http://wrap.warwick.ac.uk/92112
Copyright and reuse:
The Warwick Research Archive Portal (WRAP) makes this work by researchers of the University of Warwick available open access under the following conditions. Copyright © and all moral rights to the version of the paper presented here belong to the individual author(s) and/or other copyright owners. To the extent reasonable and practicable the material made available in WRAP has been checked for eligibility before being made available.
Copies of full items can be used for personal research or study, educational, or not-for profit purposes without prior permission or charge. Provided that the authors, title and full bibliographic details are credited, a hyperlink and/or URL is given for the original metadata page and the content is not changed in any way.
Publisher’s statement:
Woodman, Roger, Winfield, Alan F. T., Harper, Chris and Fraser, Mike. (2012) Building safer robots : safety driven control. The International Journal of Robotics Research, 31 (13). pp. 1603-1626. Copyright © The Author(s) 2012. Reprinted by permission of SAGE Publications.
Published version: http://dx.doi.org/10.1177/0278364912459665
A note on versions:
The version presented here may differ from the published version or, version of record, if you wish to cite this item you are advised to consult the publisher’s version. Please see the ‘permanent WRAP url’ above for details on accessing the published version and note that access may require a subscription.
Building Safer Robots: Safety Driven Control
Roger Woodman Alan F.T. Winfield Chris Harper
Mike Fraser
Bristol Robotics Laboratory, University of the West of England,
Bristol, England http://www.brl.ac.uk
September 26, 2012
Abstract
In recent years there has been a concerted effort to address many of the safety issues associated with physical human-robot interaction (pHRI). However, a number of challenges remain. For personal robots, and those intended to operate in unstructured environments, the problem of safety is compounded. In this paper we argue that traditional system de-sign techniques fail to capture the complexities associated with dynamic environments. We present an overview of our safety-driven control system and its implementation methodol-ogy. The methodology builds on traditional functional hazard analysis, with the addition of processes aimed to improve the safety of autonomous personal robots. This will be achieved with the use of a safety system developed during the hazard analysis stage. This safety system, called the Safety Protection System, will initially be used to verify that safety constraints, identified during hazard analysis, have been implemented appropriately. Sub-sequently it will serve as a high-level safety enforcer, by governing the actions of the robot and preventing the control layer from performing unsafe operations. To demonstrate the ef-fectiveness of the design, a series of experiments have been conducted using a MobileRobots PeopleBot. Finally results are presented demonstrating how faults injected into a controller can be consistently identified and handled by the Safety Protection System.
Keywords: robot safety, hazard analysis, safety protection system, safety-driven control
1
Introduction
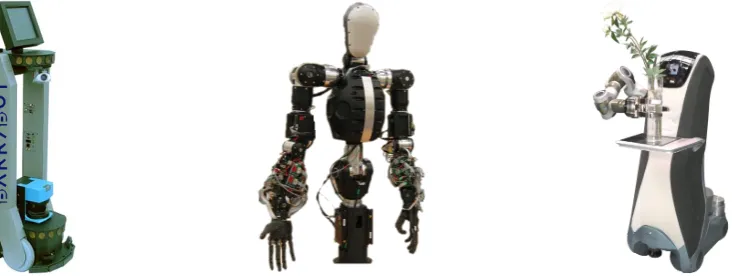
Personal robots have long been a desire for those who believe they would make daily tasks easier. Despite the fact that many people would like a robot, compelling need is greatest for those with disabilities or who would otherwise not be able to complete tasks without assistance, and there is increasing evidence that in an ageing population, personal care robots may become essential [1]. Examples of the types of personal robots being considered in this paper are shown in Figure 1.
There are significant barriers preventing robots from being used in people’s homes. Arguably the most difficult of these is demonstrating that a robot is acceptably safe for its intended use. Safety implications have always been a concern for robot designers and traditionally the solution has been to prevent the user coming into contact with the robot, by means of physical barriers. For personal robots to become a reality these barriers will need to be removed and more dynamic and flexible safety methods introduced.
Figure 1: Personal robots come in many different forms depending on their use. An interactive mobile robot (left: MobileRobots PeopleBot) may be used as a tour guide, whereas a robot fitted with precision manipulators (centre: Elumotion RT-1) can be used for more complex tasks. Some of the most useful robots are able to explore and manipulate their environment (right: Care-O-bot 3).
et al. [2] and Kuli´c and Croft [3], there are still no safety standards for complex robots which
use Human-Robot Interaction (HRI) to complete tasks. Designers of industrial and commercial robotic systems must consider a wide range of safety risks for their users, the environment and the robot itself. Robotic systems therefore, as with all safety critical systems, require rigorous analysis at all parts of the design to ensure the system is safe. As the first large scale user of robotic systems, the manufacturing industry has developed many of the robotic design methods that are used today. These methods were adapted from design principles and practices from other industrial sectors [4]. Incorporated into the design process were proven techniques such as hazard analysis, failure analysis, rigorous design and extensive inspection and testing. In addition to these, a number of safety standards for industrial robotics have been developed; most notably ISO 10218-1 [5] and ANSI/RIA R15.06 [6]. As discussed by Nokata et al. [7] and Desantis et al. [2], the methods currently employed by robotic designers are not appropriate for designing safe robots operating in unstructured environments. This is due to the high complexity associated with a system that must adapt to changes in its environment and perform actions which cannot always be anticipated during development.
In this paper we present a novel approach for designing robotic systems. Our methodology sets out a procedure for developing a safety system during the hazard analysis stage. This safety system will serve a dual purpose. Firstly, it will be used to verify that safety constraints realised during hazard analysis have been implemented appropriately and that no conflicts are present. Secondly, it will serve as a high-level safety enforcer, by governing the actions of the robot and preventing the control layer from performing unsafe operations. To demonstrate the key safety features of our safety-driven control system a series of experiments have been devised. These experiments have been conducted using a simulated MobileRobots PeopleBot and involve moving items around an environment with and without HRI. Results are presented showing the effectiveness of the system in performing tasks and its ability to handle faults injected into both sensors and controllers.
2
Related Work
field has come from the PHRIENDS project (Physical Human-Robot Interaction: Dependability and Safety) [8], which undertook an in-depth study of pHRI. Other notable work has come out of Laboratoire d’Analyse et d’Architecture des Systmes (LAAS), where they have been developing an architecture for autonomous systems [9].
In this section we discuss the main issues associated with designing and developing HRI robots and highlight areas where improvements in safety could have a real impact on getting robots into peoples homes.
2.1 Hazard Analysis
Hazard analysis involves identifying and evaluating potential hazards in a system, which may
cause or contribute to an undesirable or harmful event. When a hazard is identified it is
analysed to determine what the consequences of the hazard occurring might be. The risk that these consequences pose to both the system and the environment is then established. A safety requirement is subsequently devised with the aim of reducing the risk to an acceptably low level. For safety-critical systems the term often used to describe this is ‘as low as reasonably practicable’ (ALARP). The safety requirements can specify many types of solution for reducing the risk of the hazard, for example adding extra sensors, adding impact padding, changing how the system behaves and, usually as a last resort, avoiding the hazard by removing the system function altogether.
According to Ericson [10], the major causal factors that can lead to a hazardous event, can be categorised as: (1) hardware, (2) software, (3) humans, (4) interfaces, (5) functions, and (6) the environment. As computers have been used for many decades, hazard analysis methods for hardware, software, interfaces, and functions are well established. Conversely, in robotics identifying hazards associated with the environment and humans which may be present has received little attention. The issues associated with the operating environment of a robot are discussed later in this section.
Functional hazards are directly related to how a system carries out an operation, and requires analysis of the system functions. The system functions define the operations that a system can perform in order to accomplish its objectives [10]. These objectives satisfy the functional requirements of the system as identified from the customer requirements. Conversely, we use the term ‘non-functional hazards’ to describe everything else, including hazards external to the system such as the users or the environment. A number of hazard analysis techniques exist, many of which evaluate a system using a methodology appropriate for a particular industry. These techniques are generally considered as specialisations of one of the following [11]:
• Failure Modes and Effects Analysis (FMEA)
• HAZard and OPerability studies (HAZOP)
• Event Tree Analysis (ETA)
• Fault Tree Analysis (FTA)
environment can affect the system. This problem is likely to be much more pronounced for autonomous robots.
Autonomous robots which work cooperatively in close contact with humans have many safety risks not generally associated with industrial robots. Humans can work in ways very similar to each other or can appear to behave unpredictably; in fact it has been observed that people generally operate in patterns similar to other groups of people and rarely operate randomly [13]. It has been shown that humans have a tendency to neglect safety procedures in repetitive tasks [14]. This problem is exacerbated when users don’t clearly understand the hazards, or users choose to risk safety for more immediate advantages, such as time saving. Another important issue unique to humans, is how they are able to change the environment in significant ways either intentionally or unintentionally. This may be adjusting lighting, closing doors, adding something to the environment e.g. a toolbox, or interfering with the robot.
A variety of analysis methods have been used for autonomous robots with varying levels of success. ETA and FTA are often used for industrial robots [15, 16] where the environment is structured and HRI is minimal. For HRI situations, Failure Modes, Effects and Criticality Analysis (FMECA) has been shown to capture many of the interactions between the system and the user [17]. Research by Martin-Guillerez et al. [18] applied a modified version of the HAZOP technique to a personal robot. Their findings showed that this technique was more effective than
ETA and FTA for identifying hazards associated with users. However, as B¨ohm and Gruber
identify [19] HAZOP and FMECA usually start from a block diagram of the system, which is effective in identifying hazards due to failing components, but lacks the coverage required for identifying hazards associated with completing tasks. Their method was to divide hazard analysis into two parts, ‘components view’ and ‘operations view’. As the names suggest, the components view is concerned with the robot hardware and the operations view with the actions associated with task scenarios. Although their approach identified many of the hazards related to the actual interaction between the human and robot, environmental factors, such as how the robot should interact with other entities that may be present, were not taken into consideration. In this paper we will be considering autonomous robots that operate in unstructured en-vironments. The next section describes these types of robots and discusses the main safety approaches currently under development.
2.2 Safety of Autonomous Robotic Systems
Autonomous robots are a class of robot system which may have one or more of the follow-ing properties: adaptation to changes in the environment; plannfollow-ing for future events; learnfollow-ing new tasks; and making informed decisions without human intervention. Although commer-cially available autonomous robots are still few, Goodrich and Schultz [20] report that there is increasing demand for both personal robots for the home and service robots for industry.
Work by Ikuta et al. [25] has shown that in robot development, while designing the control systems, it is important to consider safety implications involved with moving external parts of the robot.
Among the requirements of autonomous robots, such as those being discussed in this re-search, is a certain degree of robustness. This means being able to handle errors and to continue operation during abnormal conditions. To achieve this it is important that the system should be able to support changes to its task specification [26]. These changes are necessary as, in a dynamic environment, the robot will frequently find itself in a wide range of previously unseen situations. To date, the majority of research in this area has addressed this issue by using learn-ing algorithms, often implemented as artificial neural networks (ANNs) [27, 28]. However, as Nehmzow et al. [29] identify, these implementations, although seemingly effective, are difficult to analyse due to the inherent opacity of connection based algorithms. This means that it is difficult to produce an intelligible model of the system structure that could be used in safety analysis. Work by Kurd et al. [30] seeks to address this issue using a hybrid ANN, which is designed to represent knowledge in an interpretable and understandable form.
Research by Bensalem et al. [9] and Lussier et al. [31], has shown that a hierarchical ap-proach to system safety, with different control layers providing planning, task execution and safety supervision, can improve the dependability and reliability of an autonomous robot sys-tem. This research is broadly based on the behaviour-based techniques developed by Rodney Brooks. In Brooks’ work he introduced a subsumption architecture [32], which demonstrates how different simple behaviours can be combined to produce new complex behaviours. Fur-thermore, the abstraction of the functional elements of the robot control software allows for modules to be added, removed and amended while retaining control functionality of the robot. A notable architecture using the three layer approach is the LAAS architecture [9]. This architecture divides the software controlling the robot into three levels: Decisional, Execution and Functional. The distinct feature of the LAAS architecture is the functional level, which encapsulates groups of sensors into modules which can communicate with other modules via a service link. One of the key safety features of this architecture is the execution control level [33]. This level is executed synchronously with the decisional level and is responsible for detecting faults that may occur as a result of a decision being executed. If a potential fault is detected then this decision is prevented from being passed to the functional level.
A report by Alami et al. [8], identifies a number of European robotic manufactures that have recently included software modules to monitor, through external sensing, the space around the robot for any potential dangers. This type of additional monitoring system is known as a ‘safety protection system’ [34]. A practical example of this, for managing a high-powered laser, has been implemented by Wozniak et al. [35]. Their research found that an architecture which separated safety from control allowed them to more easily configure and extend the safety parameters to meet the requirements of future changes.
3
System Development Methodology
Frequent
Probable
Occasional
Remote
Catastrophic
Critical
Incredible
Improbable
Negligible
Marginal
Consequence
Frequency
I
II
III
IV
I
I
I
I
I
II
II
II
III
IV
IV
IV
IV
IV
IV
III
III
III
[image:7.595.85.511.72.207.2]III
III
Table 1: Risk classification table (based on table B1 of IEC 61508 [37])
place, although as with many development methodologies requirements may be revised at any time.
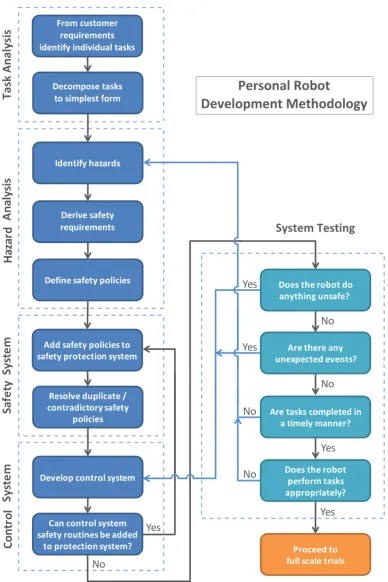
Our research seeks to bring the development of a Safety Protection System into the hazard analysis process. This, we argue, will allow verification that the safety schemes identified during hazard analysis have been implemented appropriately. This sentiment is supported by the work of Swarup and Ramaiah [36], who state that the most effective way to ensure a system will operate safely, is to build safety in from the start. An overview of our development methodology
is shown in Figure 2. As can be seen, the methodology starts by analysing the customer
requirements in order to determine the individual tasks that the robot is required to perform. These are subsequently decomposed to identify all subtasks. The method used for this process is hierarchical task analysis, which is discussed in detail in Section 6.1. After this process, as with traditional hazard analysis, the next stage is to identify any potential hazards in the system functionality which could lead to an unsafe event. Each hazard is assessed and the potential consequences of the hazard occurring are identified. Based on the severity of these consequences and the probability of the hazard occurring, a risk value is produced. Finally, a safety requirement is defined, which specifies how the hazard can be either avoided or the risk reduced to an acceptable level. If this is not possible then it may be necessary to re-design part of the system in order to avoid the hazard entirely.
To assess the risk of each hazard consequence identified during hazard analysis, we use a qualitative risk classification matrix based on the example presented in the safety standard IEC 61508 ‘Functional Safety of Electrical/Electronic/Programmable Electronic Safety-related Systems’ [37]. This classification matrix is presented in Table 1: the matrix is organised into a series of columns, which define the hazard consequence severity, and rows denoting the frequency that the hazard could occur. Where a row and column intersect determines the risk class. Four risk classes are possible, from the most severe (Class I) to the least (Class IV). These classes and a description of each are shown in Table 2.
The process of assigning risks classes involves examining each hazard identified during hazard analysis and determining both the frequency with which the hazard is likely to occur and the severity of the consequences associated with the hazard. If the risk class is found to be either Class I (intolerable) or Class II (undesirable), then a safety requirement must be produced, which details how the risk will be reduced to Class IV (negligible) or Class III (tolerable). In Section 3.3 we discuss how these qualitative findings can be interpreted into quantitative values for use in safety functions.
Class I Intolerable risk
Class II Undesirable risk, and tolerable only if risk reduction is impracticable or if the costs are grossly disproportionate to the improvement gained
Class III Tolerable risk if the cost of risk reduction would exceed the improvement gained
Class IV Negligible risk
Table 2: Risk classes (see IEC 61508 [37])
specific hazard will occur rapidly increases with the complexity of the robot’s environment. Creating safety requirements involves designers utilising their own experience, adapting solutions from previous projects and following safety standards. To make specifying safety requirements less complicated and easier to verify, we have come up with a standard way of describing them (see Section 3.2). This we believe is a necessary first step for managing the large number of hazards associated with autonomous robots.
The novelty in our approach is how requirements are written, how they are verified and finally how they are used as the backbone of the final system. The remainder of this paper details the design decisions involved in the development of the Safety Protection System and the strategy used to integrate it into the hazard analysis process.
3.1 Identifying Safety Requirements
To reduce the complexity of system interaction with the environment, designers often opt to alter the environment over making changes to the system. This strategy reduces the diversity of potential interactions between a system and its environment by restricting the number and density of features in the environment with which the system can interact. However, as personal robots will be operating in unstructured domains, it will be neither practicable nor desirable to alter them in order to simplify the functionality of the robot, and hence robots will be required to cope with the full complexity of dynamic interactions in the performance of its tasks. The impact of this is that designers will need new methods of identifying all the hazards associated with the robot system and its environment. Here we propose a simple method to aid in the identification of safety requirements for personal robots.
To perform hazard analysis we chose to use elements of a variant of the HAZOP method called SHARD (Software Hazard Analysis and Resolution in Design) [38]; along with a hazard check list that we have devised (Extension 1). The SHARD process, as with HAZOP, involves systematically analysing each system function using a set of key words to guide the process. SHARD is a variant of HAZOP intended for use with software-based systems, and employs keywords that are better suited to identification of software failure behaviour [39]. An example of a hazard analysis document that we produced during this research is given in Extension 2. This document examines the hazards associated with an autonomous robot that is tasked with picking up an object from one location and depositing it in another location. For each hazard consequence that is deemed a risk, one or more safety requirements are proposed. In this document the hazards that are identified as a result of using the hazard check list are highlighted. This is discussed in more detail in Section 6.
TaskbAnal
ysis
Frombcustomer requirements identifybindividualbtasksH
az
ar
d
A
n
al
ys
is
C
o
n
tr
o
l
Sy
st
e
m
Sa
fe
ty
Sy
st
e
m
Resolvebduplicateb/b contradictorybsafetyb policies Doesbthebrobotbdob anythingbunsafe?b Arebtasksbcompletedbin abtimelybmanner? Doesbthebrobot performbtasksb appropriately?b Arebtherebanyb unexpectedbevents? Yes Addbsafetybpoliciesbtob safetybprotectionbsystem No No Yes Yes No No Yes No Proceedbtob fullbscalebtrials YesPersonalbRobotb
DevelopmentbMethodology
Derivebsafety requirements IdentifybhazardsSystembTesting
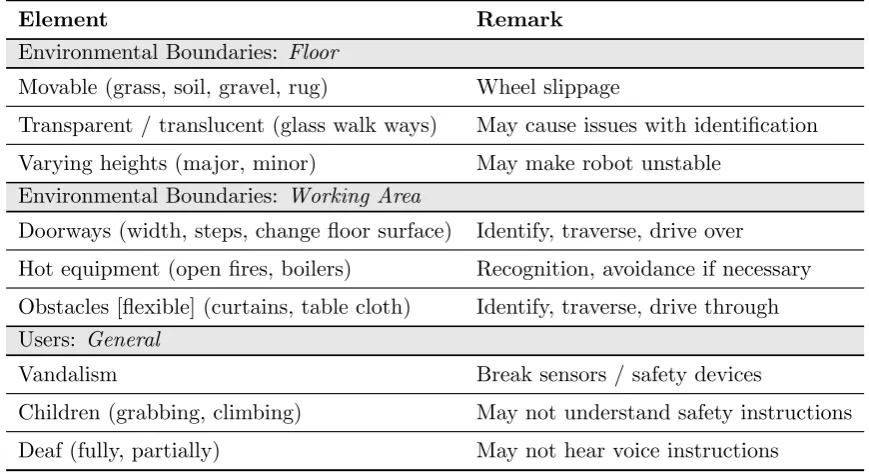
Canbcontrolbsystemb safetybroutinesbbebaddedb tobprotectionbsystem? Developbcontrolbsystem Definebsafetybpolicies Decomposebtasksb tobsimplestbformtechniques together, we believe we are able to overcome the problems discussed in Section 2.1. An extract of the hazard check list is shown in Table 3. It was conceived after careful examination of a number of typical environments that a personal robot could be required to operate in. A combination of experience and brainstorming was used to analyse how a robot may carry out tasks and what hazards it may encounter. The environments considered were:
a manufacturing shop floor, a restaurant and a home. These environments are in no way
exhaustive and it is likely the check list will benefit from additional examples added over time. Although a robot was not used to perform tasks in these environments, we did consider the dimensions and capabilities of the Care-O-bot 3 mobile robot [40]. This robot was chosen over others such as the WillowGarage PR2 [41], as it is narrower and its manipulator can be stowed away, allowing it to navigate more cluttered environments with less structuring required. An example robot was beneficial, as it helped us understand how a robot would operate within space limitations and in the presence of typical hazards.
Element Remark
Environmental Boundaries: Floor
Movable (grass, soil, gravel, rug) Wheel slippage
Transparent / translucent (glass walk ways) May cause issues with identification
Varying heights (major, minor) May make robot unstable
Environmental Boundaries: Working Area
Doorways (width, steps, change floor surface) Identify, traverse, drive over
Hot equipment (open fires, boilers) Recognition, avoidance if necessary
Obstacles [flexible] (curtains, table cloth) Identify, traverse, drive through
Users: General
Vandalism Break sensors / safety devices
Children (grabbing, climbing) May not understand safety instructions
[image:10.595.78.513.260.497.2]Deaf (fully, partially) May not hear voice instructions
Table 3: Extract of the hazard check list (see also Extension 1).
As discussed we believe there are currently no hazard analysis methods available that guar-antee the identification of all hazards associated with a personal robot. Although the approach we have outlined does not completely solve this problem, it can be shown to capture more potential safety risks than using traditional methods alone. For example none of the systematic approaches we have investigated would identify hazards associated with a human user having wet clothes due to rain. Research by Martin-Guillerez et al. [18] has sought to address this and other issues by using modelling techniques such as UML ‘use case’ diagrams to visualise the interactions that can occur between the robot and humans. However, it is unclear what benefits these diagrams have on identifying hazards associated with the robot, humans and the environment.
3.2 Implementing Safety Requirements: Safety Policies
In the context of this research paper, a safety policy can be thought of as an interlock imple-mented in software. These software interlocks, or safety policies, aim to prevent the robot from generating unsafe actions, by means of intervention between the control layer and the actuators. The initial purpose of developing the safety policies was to create a standard approach for describing and implementing different types of safety requirements. The only restriction being that the safety requirement must be implementable in software. As this required a flexible implementation method, it transpired that not only safety requirements, but a wide range of safety processes could be defined using the same method. The remainder of this section gives details of the implementation method and examines a number of examples.
We have chosen to present safety policies as independent rules, which use facts derived from perception data to impose restrictions on a set of actuators. This idea is based on principles taken from knowledge-based system design [42]. The benefits of this type of design are the inherent parallelism, which treats all rules in the system as separate tasks, all of which are processed simultaneously.
The structured English statement which follows reveals the generic structure for our safety policies. The safety policy object (SP) contains a number of variables, which are compared against to determine whether the associated actuators should be restricted or allowed to operate normally. Sensor functions (SF) provide high-level information about sensor readings, as well as a confidence level that quantifies how confident the sensor function is that its output value is correct. For example, the object distance sensor function could output a value of 300 mm with a confidence level of 0.9, meaning that it is 90% confident that the nearest object is 300 mm away. The method used to calculate the required confidence level for each safety policy is described in detail in the following section.
IF r o b o t s t a t e = SP . r e q u i r e d r o b o t s t a t e
AND s a f e t y s t a t e = SP . r e q u i r e d s a f e t y s t a t e
AND c o m p a r i s o n o f SF . v a l u e i s i n s i d e SP . a c c e p t a b l e b o u n d s
AND SF . c o n f i d e n c e l e v e l >= SP . r e q u i r e d c o n f i d e n c e l e v e l
THEN a l l o w a c t u a t o r s
ELSE r e s t r i c t a c t u a t o r s
FINALLY r e t u r n s a f e t y r a t i n g b a s e d on SF . c o n f i d e n c e l e v e l
It has been argued that context awareness in a safety-critical system is a crucial way of maintaining both the availability of the system to complete tasks and its safety [23, 43]. This has been implemented in our rule based approach with the use of a ‘robot state’ object that holds all state information about the robot, which may be of use when making safety decisions. A similar state object called the ‘safety state’ is used exclusively by the safety policies. This state is employed as a form of memory within the collection of safety policies. An example use is for one policy to set a safety state when a human has been detected. This can then be used in other safety policies to identify a human is in the robot’s area, even if it cannot be detected all the time. A timer can be used to reset the safety state if a human is not detected within a certain time frame.
IF r o b o t s t a t e . speed mode = r e d u c e d s p e e d c o n t r o l
AND e n d e f f e c t o r s p e e d <= 250 mm/ s
AND c o n f i d e n c e l e v e l >= 0 . 6
THEN a l l o w a c t u a t o r s
ELSE r e s t r i c t a c t u a t o r s
FINALLY r e t u r n s a f e t y r a t i n g b a s e d on c o n f i d e n c e l e v e l
The following safety policy example, based on an ISO 13855 requirement [44], is used to maintain a separation distance between the robot and a human user. This example and the one that preceded, show that it is possible to explicitly represent requirements taken directly from safety standards. This opens up the possibility that safety standards could not only be used as requirement guidelines, but also as specifications for actual safety constraint implementation. However, it must be noted that many robotic safety standards rarely specify requirements in terms of quantitative values, and instead give general guidelines on the qualities that the final system must possess. In fact the robot safety standard ANSI/RIA R15.06 [6] has the same ‘operating at reduced speed’ requirement described previously but no others that could be implemented as a safety policy. With the growing interest in personal robotics it may be that in the future we see a shift in robotic safety standards, from the current safety guidelines, to more prescriptive and quantitative requirements. However, as these robots will be required to operate in increasingly dynamic and hard to predict environments, it may make defining quantitative requirements much more difficult.
IF r o b o t s t a t e . o p e r a t i o n m o d e = c o l l a b o r a t i v e o p e r a t i o n m o d e
AND h u m a n d i s t a n c e >= 100 mm
AND r o b o t s p e e d x r o b o t s t o p p i n g t i m e +
p r o t e c t i v e d e v i c e m i n i m u m d i s t a n c e < h u m a n d i s t a n c e
AND c o n f i d e n c e l e v e l >= 0 . 7 5
THEN a l l o w a c t u a t o r s
ELSE r e s t r i c t a c t u a t o r s
FINALLY r e t u r n s a f e t y r a t i n g b a s e d on c o n f i d e n c e l e v e l
When a safety policy is executed, it either allows its set of actuators to operate normally or imposes restrictions. These restrictions can be in the form of limitations on potential output or as full suppression, preventing the actuators from operating. In both cases a safety rating is produced, which can be used by the control layer to understand the nature of the restrictions, or if none have been imposed, this value is based on the substitution of the sensor function output and the corresponding safety policy comparison values.
The logic used in the safety policies allows only ‘and’ conditions and not ‘or’ conditions, this was done so that each rule term in the policy can be evaluated until one returns false. If an ‘or’ condition is required then a second policy should be used which contains the required conditions. In this context a ‘rule term’ is a statement which compares two values. If more that one rule term is required then an ‘and’ is used to separate the terms. Additionally, to aid in the understanding of the policies for the reader, state information should come first, as these dictate the context the policy will be activated in.
process of composing a safety policy involves analysing a safety requirement to identify what sensor and state information is required and which actuators should be restricted. Some safety polices may only depend on state information; this can be either safety states, as set by other safety policies or robot states, set by the robot control layer. For those policies that use sensor information, the final step is to calculate the confidence level that is required of the sensor functions before the safety policy is activated. This calculation and an example safety policy is given in the section that follows.
In this section the use of safety policies as a method for encoding safety requirements has been introduced. It should be made clear that this part of the proposed methodology (see Figure 2) is still under development. Although, as has been shown, it is quite possible to encode clearly defined safety requirements, generally safety requirements are not well defined and would require them to be further broken down into smaller well defined processes.
3.3 Safety Policy Required Confidence Level Selection
In this section we are only considering safety policies which have a confidence level component. At present those that do not use a confidence level depend only on state information. As previously stated, confidence levels are a value of belief that what is being asserted is true. The values can range from 0.0, which means there is 0% confidence in the assertion, and 1.0 which means that the value is 100% correct. However, it must be remembered that for robots operating in the real world, confidence can rarely be expressed in absolutes and instead depend heavily on the state of the environment.
As safety policies can be used to either restrict actuators or allow them to operate, confidence levels can be used in one of two ways. If the risk associated with a safety policy is high then the designer can choose to use a low confidence level to restrict the actuator or a high confidence level to allow the actuator; this is reversed if the risk is low. In this context, the risk associated with a safety policy is the risk caused by a potential hazard or hazards that are avoided by the actions (restrictions or state changes) taken by the safety policy. The decision to use a ‘restricting’ or ‘allowing’ safety policy, depends primarily on other safety policies which are also associated with the same set of actuators. In the cases where either type of safety policy can be used, for example when the safety policy uses a safety state that is altered by another safety policy, then the choice should be made based on which approach is more logical. This subject is discussed further in Section 5.1.
To select appropriate confidence levels for each safety policy, we propose a principled method using risk ratings identified during hazard analysis. These risk ratings and the method we have developed to calculate confidence levels is based on the risk classification matrix (see Table 1). During this process we are essentially interpreting the qualitative results of the hazard analysis as quantitative values required by the safety policies. In addition to this calculation it was decided that the minimum confidence level for allowing an actuator should be 0.5. This was due to the conclusion that if the the confidence was less than 0.5, then their would be a greater probability of the result being incorrect than correct.
The confidence level calculation for safety policies that allow actuators to move is shown in Equation 1, and the calculation used for restricting safety policies is shown in Equation 2.
ca=s∗max(rh, rm, rf) (1)
cr = 1−(s∗(max(rh, rm, rf)) (2)
Wherecais the confidence level for allowing actuators,cris the confidence level for restricting
objects, rf is the risk to fixed objects and s is the potential severity caused as a consequence
of the hazard. The severity and hazard consequence values are detailed in a series of tables in Extension 3.
The role of the confidence level calculation is to prevent safety policies being used that are highly hazardous, while making sure that those that are less risky are able to operate freely. To this end the severity values ‘None’, ‘Low’, ‘Medium’, and ‘High’ were chosen to describe the level of risk. The terms ‘direct’ and ‘indirect’ are used to describe hazards that affect humans and objects, either directly or as an indirect result of an initiating event. For example, if the consequence of a hazard is a collision with a human, then this would be considered a direct consequence. Whereas, if a hazard resulted in the robot knocking over an object, which subsequently collided with a human, the human collision would be considered an indirect consequence of the initial event. This is further refined using the terms ‘one’ and ‘many’ to describe multiple or single humans or objects affected.
To calculate the risk values used in Equations 1 & 2, a weight value is assigned to each severity value and hazard consequence. These weightings can be seen in the table of Extension 3. There is a monotonic relationship between the weighting values, with larger values being assigned to situations which are deemed more hazardous. For example, if the consequence of a hazard affects both humans and other objects, then only the risk to humans is taken into account, as this represents the highest risk. High risk hazards which require a confidence level of 1.0 (100%) are not allowed on the system and must be redesigned in accordance with IEC 61508 [37]. The weighting values were chosen by examining the types of hazard identified in both the hazard check list (Extension 1) and the hazard analysis document (Extension 2). As this analysis only considered a small subset of all the safety risks associated with a personal robot, it is likely that these risk values will be improved with additional examples added over time.
Given the following safety requirement,‘Robot must move at reduced speed when carrying an
object and a human is present.’, it is possible to construct a single safety policy (see below). This requirement addresses a potential direct risk of harm to one human caused by the robot moving too quickly while carrying an object. It does not pose a risk to more than one human (during a single event) as any collision would activate other safety systems that would immediately stop the robot, thus avoiding harm befalling multiple humans. Similarly there are other safety systems which would stop the robot if an object is sensed in close proximity. Therefore, this safety requirement, although important for the smooth operation of the robot, poses a relatively reduced risk to the human. Using the severity and hazard consequence values presented in Extension 3, it is possible to calculate the confidence level for restricting the actuator as 0.25 and allowing the actuator as 0.75. This is based on multiplying the weighting of a direct risk to one human (0.5) by a medium severity (1.5).
IF r o b o t s t a t e . c a r r y i n g o b j e c t = t r u e
AND h u m a n d e t e c t e d = t r u e
AND c o n f i d e n c e l e v e l >= 0 . 2 5
THEN a c t u a t o r s . speed mode = s l o w
FINALLY r e t u r n s a f e t y r a t i n g b a s e d on c o n f i d e n c e l e v e l
4
Safety-Driven Control System
Until this point we have focused on issues associated with identifying hazards that may affect personal robots. We now discuss how hazard analyses and the safety requirements they generate can be used to drive decisions within the control layer. This section describes the design of our safety-driven control system architecture and discusses its implementation.
4.1 System Architecture
All computer controlled machines depend on a number of safety functions of one form or another. The idea behind our control system architecture is that these safety functions can be utilised to form a knowledge-base from which active decisions or emergent behaviours can be generated. This resource, as well as being used passively to evaluate possible control actions, can record the state of the robot’s environment in terms of safety. In capturing the state of the environment in this way, a model of the robot’s working area can be formed that shows where potential areas of risk are located. This model is formed from a combination of safety policies and the sensory data they evaluate.
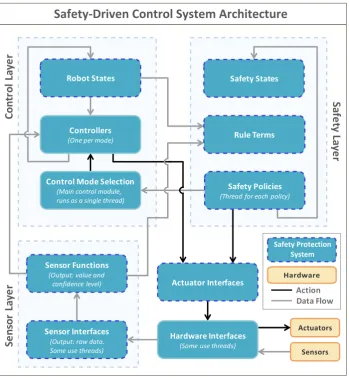
As Figure 3 shows, the control system has been separated into three distinct layers. A control layer, which is solely responsible for engaging actuators; a safety layer, which has priority over restricting actuator movement; and a sensor layer which provides real-time data to the other two layers. This current design is a modification of an early design by Woodman et al. [45]. As can be seen, the control system is divided up into a series of interconnected modules. The direction of the connecting lines represent the direction data flows and shows the modules which can call functions of other modules. One of the key data flows is between the safety policies and the control mode selection modules. This link allows the control mode selection module to constantly look at the safety restrictions that are being applied at any given time. The diagram in Figure 4 shows a high-level overview of the safety-driven control system architecture. The purpose of this diagram is to illustrate how the main components of the system interact.
The control layer is made up of a number of controllers which provide certain functions, or modes of activity. An example function could be to move the robot to a specific location. This function would carry out the actions until it either completed successfully or a restriction was applied by the safety layer, potentially halting it mid-way. The restriction type can be either a reduction in the actuator output or a complete suppression. In the latter situation the controller would cease all activity, whereupon the control mode selection module would choose another controller based on the rules associated with the current state of the safety layer i.e. which safety policies are being applied. At present only one controller can be selected at any given time. This restriction has been imposed, as it reduces any unpredictable behaviour that may occur as a result of multiple control actions operating concurrently. The main point to understand is that the controllers cannot perform an action which violates one or more restrictions applied by the safety system.
4.2 System Implementation
In this section we discuss the fundamentals of the safety-driven control system implementation. More specifically we show how the control layer makes decisions based on restrictions applied by the safety layer. The design of the safety layer and its implementation decisions are examined in detail in the section that follows.
SafetyvPolicies
(Thread for each policy)
SafetyvStates
ActuatorvInterfaces ControlvModevSelection
(Main control module, runs as a single thread)
RobotvStates
HardwarevInterfaces
(Some use threads)
Sensors Actuators
Controllers
(One per mode) RulevTerms
Sa
fe
ty
vL
aye
r
C
o
n
tr
o
lv
La
ye
r
SensorvFunctions
(Output: value and confidence level)
SensorvInterfaces
(Output: raw data. Some use threads)
Se
n
so
rv
La
ye
r Action
DatavFlow
SafetyvProtection System
Hardware
[image:16.595.123.473.84.463.2]Safety-DrivenvControlvSystemvArchitecture
Figure 3: Control system architecture. This illustrates the relationship between safety and control layers. Modules which run concurrently (using execution threads) are marked as these are the best candidate for distributed processing.
Safety Protection
System
S
ControllersSensor Functions
Sensors Actuators
* “S” denotes suppression of the controllers output by the Safety Protection System. Suppression is controlled
by safety policies.
[image:16.595.108.488.548.700.2]The implementation of the control mode selection module must be in precise adherence with the safety layer. This means that no element of the control layer should try to violate any restrictions imposed by the safety layer. This should be done, not as it poses a risk to the safe operation of the system, but that not adhering to the safety layer would cause the system to become unresponsive when the safety layer imposes a restriction that the control layer does not know how to handle.
To demonstrate how the different parts of the control layer operate we consider two simplified algorithm extracts. The first extract, which shows part of the control mode selection module, is presented in Algorithm 1. The second extract, presented in Algorithm 2, shows a controller which is called by the control mode selection algorithm.
In Algorithm 1, first the ‘MoveToObject’ controller (see Algorithm 2) is called, this then performs a number of functions, which first identifies an object and then moves the robot towards it. This process can either be completed successfully, or if a safety policy imposes a restriction, then the controller will return control back to the control mode selection module. At this point if the controller completed its task successfully, the next controller would be selected, for example the controller responsible for picking up objects. Although this would depend on the robot’s overall mission goal. This, and all other selections, would follow the same principle as the one presented, and therefore have been omitted.
Algorithm 1 : ControlModeSelection
taskCompleted←false
while taskCompleted=false do
returnV alue← MoveToObject()
restrictions← GetSafetyPolicyRestrictions()
if returnV alue=completed then
taskCompleted←true
else if restrictionscontains obstructionDetected then
NavigateAroundObstruction()
else if restrictionscontains humanInV icinity then
NegotiateWithHuman()
end if end while
If the controller fails to complete its process successfully, a list of the current safety poli-cies imposing restrictions is examined. Based on these restrictions a new controller is selected, which is responsible for avoiding the safety hazard that the safety policy addresses. In order to identify each safety policy a unique id is assigned. In Algorithm 1 the safety policies are ‘obstructionDetected’ and ‘humanInVicinity’, and the controllers are ‘MoveToObject’, ‘Navi-gateAroundObstruction’ and ‘NegotiateWithHuman’. It is important to remember that these two algorithms represent only a small extract of the overall system.
Algorithm 2 : MoveToObject
if IdentifyObjectLocation() =true then
if OrientateToFaceObject() =true then
if MoveTowardObject() = true then
return completed
end if end if end if
return f ailed {The controller could not complete. ControlModeSelection will subsequently check if this is due to a safety policy being activated}
The effect of removing the majority of safety functions from the control layer has greatly reduced the complexity of control routines. However, as there are no real world personal robots of the type discussed in this paper, we are unable to make any quantitative comparisons of processing speed or computational effort. It could be argued that with layered architectures of the type we have presented it is possible to demonstrate the control system in two modes, one with the safety layer operating and one with it not. It would then be possible to make some comparisons of the effectiveness of the design. However, due to the design of our architecture, the safety policies and the restrictions they impose are integral to the control system. Therefore, if the safety layer were to be turned off the control system would simply not function as there would be nothing for the control layer to query against in order to decide what actions it should take.
A potential issue of having a separate safety layer is that a delay is introduced between the time it takes for the safety policy to identify an unsafe event and a restriction being applied. However, this delay is under 0.5 seconds using a 2.8 GHz quad core processor, which did not pose an issue for the types of tasks presented in this paper. Nevertheless, for others implementing this type of architecture it must be given careful consideration. The issue of timing is discussed further in Section 6.5.
At this stage of development the safety policies and the mechanisms which manage them have been designed to enforce safety over availability. It follows that the safest result of any error, failure or unanticipated event is to stop the robot until the issue can be resolved. This can result in the system mission being impeded. It is important to note that this issue is not as a result of having many safety processes (in the form of safety policies), but as a result of the level of caution imposed by each individual safety policy.
The following section explores the design decisions made while developing the safety layer. The designation ‘Safety Protection System’ is used to define all the processes that are shared between the safety layer, the sensor layer and the actuator interfaces.
5
Safety Protection System
As has already been discussed, the Safety Protection System we are developing is a high-level real-time safety manager, which can intervene to restrict the control layer from activating an actuator in such a way that it could lead to an unsafe event. The design of the Safety Protection System is built on the notion of safety policies (see Section 3.2), acting as rules in a type of knowledge-based system.
5.1 Design Principles
As the design of the Safety Protection System uses a hierarchical structure, with sensor inputs at the top and actuator outputs at the bottom, a directed acyclic graph (DAG) was chosen as the best method for representing the system. This type of graph is topologically ordered and has no cycles, meaning there is a flow of information from input nodes to output nodes passing through a series of intermediary nodes which alter the data. This method allowed us to create diagrams of the system structure, which made it possible to perform a visual analysis to help identify any potential weaknesses.
The implementation of the graph, or network in its populated form, borrows concepts from both ANNs and Bayesian networks. Bayesian networks are often used for complex high-dimensional problem domains, such as diagnosing medical ailments [46]. Their computational efficiency and inherently visual structure make Bayesian networks ideal for working with com-plex problems that can be described in terms of causal relationships. A causal graph structure encodes information about the relationships between the nodes of the graph. This means we are able to describe the relationships between sensors and actuators in terms of their connectivity within a networked structure. As with our system, Bayesian networks are generally constructed with knowledge from domain experts with the intention of building a knowledge-base that can be understood by anyone. The knowledge captured is both qualitative, described by the structure of the network, and quantitative, as values stored in the individual nodes. This allows knowl-edge of different types to be combined in a single representation. The implication of this is that our Safety Protection System, which as previously stated is made up of all the safety functions needed to keep the robot safe, can be fully described by a single network. The comparison with ANNs is more subtle, in fact it is more appropriate to think of our network as a type of ANN with complex nodes. The safety policy nodes use a type of weighting (see Section 5.4), applied to a number of internal rules. This is used to generate an output for one or more actuators.
All rule terms in a safety policy must be evaluated as true in order to be processed fully. Therefore, as was described in Section 3.2, the conditions which can be evaluated quickly, for example state information must be positioned at the beginning of the policy. Those conditions which take more time, usually the sensor function values, must appear last. Each safety policy is processed independently using a separate thread. This allows all policies to be processed in parallel. By using state conditions it is possible to minimise the number of policies which are processed fully at any one time. Presently we are choosing these states manually by carefully examining the relationships between each policy. However, it is likely that this process could be automated in the future.
An example Safety Protection System graph for a mobile robot is shown in Figure 5 (for details of the system modules that populate the Safety Protection System graph see Figure 3). The graph is organised as a series of layers, each layer is composed of nodes of a single type. The top layer represents the robot sensors (S), each of which can be connected to one or more sensor functions (SF). These sensor functions interpret the sensor data and output higher-level information, for example the position of an object. The output of the sensor functions is given as a value (V) and a confidence level (CL). As discussed in Section 3.2, the confidence level is a belief value based on how confident the sensor function is that its output value is correct.
S1 2 SF1 2 S2 3 S3 3 S4 1 S5 1 S6 1 SF2 3 SF3 3 SF4a 2 SF4b 1 CL= V= 1 CL= V= 1 CL= V= 5 CL= V= 3 CL = V = 1 CL= V= 3 2 1 1 2 3 3 2 2 1 2 2 2 2
SP1 SP2 SP3 SP4 SP5 SP6
[image:20.595.94.502.67.345.2]A1 2 A2 1 A3 3 A4 3 A5 2
Actuators
Sensor
Functions
Safety
Policies
Sensors
Figure 5: Example Safety Protection System graph. Note: CL = confidence level, V = value.
actions that would put the robot into an unsafe state. An example of this is to allow the robot to move away from danger, but prevent it from moving towards it.
control layer having direct access to sensor information.
From its inception, we made certain to design the Safety Protection System with all the fun-damental requirements that our research had shown a safety system would need. The following sections describe the core design principles that we followed in developing the Safety Protection System.
5.2 Aid the Safety Engineering Process
The Safety Protection System aids the safety engineering process in two main areas. Firstly by having a collection of safety policies all of the same generic type, it is straightforward to iterate through them and verify that they all exist as the specification dictated. The second area, and one which partly justifies the creation of a separate safety system, is that metrics can be taken and used in a quantitative assessment to identify weaknesses in the system. In the example graph of Figure 5, it can be seen that sensor 4 has one connection to sensor function 3, which in turn connects to five of the six safety policies, which finally connect to all the actuator nodes. This means that if sensor 4 failed, the dependent policies could not be evaluated and the system would halt. This shows how areas of the system which may require added redundancy can be identified. This concept will be explored further in the next section.
The ability to analyse the interdependences within a system is an interesting area of study, not just for aiding the hazard analysis process, but also for identifying areas of high and low activity within the system. This kind of information could be utilised to direct improvement efforts into those parts of the system which are most used, and potentially identify those parts which are not required. This bears some similarity to the work of Nehmzow et al. [29], who demonstrated that it was possible to take an existing robot system, and create a model of that system by learning how it functioned. With this model they were able to show how some of the least important functions could be removed, with little to no effect on the system operation.
5.3 Redundancy and Diversity
A major concern for robot system designers are sensor malfunctions and failures [36]. This is a particular concern for those safety critical parts of the system which depend on precise sensor data. Identifying which functions of the system are critical is usually done alongside the hazard analysis process. Assigning a risk level to system functions is one method for declaring the criticality. This method is used in the safety standard IEC 61508 [37] as well as other functional safety standards. The process assigns a level of risk to each function, which must be reduced to an acceptably low level before the system can go into service.
An important method of reducing the risk of critical system functions, is to add redundant
sensors. Therefore we wanted to address this issue as seamlessly as possible in our safety
architecture. As the example in Figure 5 shows, we have addressed this problem with the use of multiple sensor functions of the same type, SF4a and SF4b. An example of their use could be for monitoring for the presence of a human. These sensor functions could be either identical, using the same sensors and code, or diverse, utilising different sensors and processing the data in a different way. Examining this example further, consider the safety policies SP4, SP5, and SP6, as is shown in Figure 5 these all depend on the sensor function SF4. If these policies were identified as high risk, then a high risk level could be assigned to SF4. To reduce the risk level and the associated risk to the related safety policies, redundancy could be added to SF4 (as is shown in Figure 5). This would mean that SF4 would calculate its value twice using two independent sets of sensors.
from the sensor function with the highest confidence level, or combining the output in some
way. Initial trials using a sensor fusion technique described by Sch¨orgendorfer and Elmenreich
[47] has shown that a weighted average of multiple sensor function values, can both reduce error while preserving the data diversity obtained from multiple sources. The confidence level output from each sensor function was used as a weighting to give more significance to sensor function values which had a higher confidence level.
A potential problem of using the same sensor and state information in both the safety layer and control layer is the risk of common cause failures [10]. These types of failure can occur when all parts of a system designed to prevent a failure share a common point of reference. For example a sensor which regulates the robot’s speed in the control layer may also be used in the safety layer to prevent speeds which are too high. If this sensor gave an erroneous value that was too low, it may cause an acceleration of the robot which is not detected by the safety layer. Therefore it is crucial during the hazard analysis process that the designer identifies all potential common cause failures and adds diversity and/or redundancy as appropriate.
5.4 Confidence Reasoning
Robot sensors and actuators are inherently prone to error. This means that any reasoning about their use, either as data received or actions taken, must incorporate a degree of uncertainty. One of the recent trends in robotics research for handling uncertain information about the robot’s environment, is to assign a ‘danger index’ to objects that the robot perceives could cause a hazard [7, 25, 22]. These indices are continuously updated with the latest sensor readings, with the aim of increasing the robot’s confidence in its own understanding. As the robot’s confidence increases, so does the reliance on that knowledge, allowing the robot to continue to operate in the presence of potential hazards.
The amount of processing required to produce an accurate view of the world, necessary for navigating safely, is potentially very large. Some have suggested using probabilistic graphical models in the form of Bayesian networks for handling this complex data set [48, 43]. This involves using Bayes rule to combine all the robot data to produce a reasoned output.
For the Safety Protection System we have chosen to use confidence levels (sometimes re-ferred to as confidence factors), which is a method often used in expert systems for dealing with uncertainty [49, 42]. This differs from Bayesian networks as it does not require a priori probability to be assigned to each decisional part of the network. Instead it allows us to assign a value of belief to sensor readings, which can be combined to give an overall confidence level for use in the safety policies. This value can then be compared with the confidence level required by the associated safety policies (see Section 3.3). It is important to note that it is the sensor function output values we are assigning a confidence level to and not the sensor values.
Prior to developing our own confidence equations, we considered a number of other tech-niques for calculating sensor confidence levels. These can be broadly categorised as those which use only static information about the sensor tolerances and error potential, and those that utilise previous sensor data and readings from multiple sensors. An example which uses a combination of static information and previous sensor data is described by Goebel and Agogino [50]. Their method uses fuzzy logic to combine multiple sensor readings in order to identify uncertainty caused by sensor noise. Another technique, which belongs to the latter category, is presented by Hossain et al. [51]. Their novel approach uses multiple sensors which detect the same type of data. Learning algorithms are used to compare the data over time to identify any differences. A confidence value can then be produced in real-time by comparing the latest sensor values with an expected value.
take into account the structure of our sensors and sensor function configuration. Therefore, it was decided that at this stage of development it would be more beneficial to use a simpler calculation that is easier to understand and to diagnose any issues that arise. However, it is likely that as development continues a more comprehensive confidence calculation will be required.
To calculate the confidence level of the output from a sensor function, we compare a number of samples in order to identify any errors. The number of samples taken is important, as too few can result in errors not being detected and too many means that the first samples are older and less relevant to the later ones. Therefore, the strategy we used was to base the number of samples taken, on the confidence level required by the safety policy that requests the sensor function value. The proposed calculation is given in Equation 3.
n= 2(r/q) (3)
The number of sample values is expressed as n. The required confidence level, as dictated
by the safety policy, is expressed as r and q is the confidence per query assigned to the sensor
function. Sensor functions which produce reliable results, for example bump detection, would have a high confidence level per query, whereas a sensor function with low reliability, such as face detection, would have a low confidence per query. At present the confidence per query for each sensor function is set and fixed each time the robot is started. Choosing the value involves a test campaign specifically designed for each sensor function. For example the face detection sensor function requires a number of detection samples taken from various angles. We are currently working on using information from sensors to adjust the confidence per query dynamically. For example, initial experiments show that using information from light and distance sensors can improve the reliability of the face detection sensor function.
In addition to the number of samples taken, there is also a time restriction within which the sensor function values must be obtained. If the time it takes to retrieve all the required sensor function values is greater than the typical time it takes to retrieve all values then the confidence level -998.0 is returned to identify that a timing problem has occurred. The required processing time is determined by the system designer and is attributed against each sensor function. Additionally, if the value of the sensor function is equal to the sensor functions known failure value, i.e. an error has occurred while calculating the sensor function value due to one or more sensor failures, then the confidence level -999.0 is returned to identify this failure.
The confidence level calculation is shown in Equation 4. The first step of the calculation is to multiply the required confidence level by two to give the maximum possible confidence level. This is then subtracted from the sample standard deviation of all the samples and divided
by the number of samples. The sensor function confidence level is represented as cs and σ is
the standard deviation of the samples, calculated using Equation 5. Where n is the number
of sensor function samples, xi represents the sensor function values and x is the mean of the
sample values.
Standard deviation is used to measure the dispersion between a set of values; the greater the dispersion the larger the standard deviation. This is used in the confidence level calculation to measure the error in the sample values. Another technique which we considered was the variance of the sample, which is the sum of the difference between a set of values. This gave similar results to standard deviation when the samples values had low dispersion. However, it was much more sensitive to large error values.
σ=
√∑n
i=1(xi−x)2
n−1 (5)
To calculate the actual value output of the sensor function, to which the confidence level is assigned, we used the median of the sample values. The mean and mode averages were also considered for choosing the output value, however, we found that both were prone to give extreme values if the sample contained one or more error values.
6
Experiments and Results
To evaluate the proposed safety methodology and system design presented in this paper, we have conducted a number of experiments using a simulated MobileRobots PeopleBot (see Figure 6). The task involves moving items around an environment with and without HRI. Results are presented showing the effectiveness of the system in performing tasks and its ability to handle faults injected into the controllers.
[image:24.595.77.520.354.551.2]A simulated robot was used instead of a physical robot, as this allowed us to explore the effect of errors in sensors and actuator movement on the safety of the robot. By setting a known sensor error, we were able to adapt the confidence levels of safety policies appropriately. For a real physical robot, sensor errors will need to be established.
Figure 6: Simulated mobile robot sorting parts (see Extension 4 for full video). The simulation environment was made using Microsoft Robotics Developer Studio.
6.1 Robot Task Example: Part Sorting
Sort parts into good and bad
Analyse part
2
Wait for part
Pick up part Move to
collection area
Plan 1: Normal sequence (1.1, 1.2, 1.3)
1.1 1.2 1.3
Plan 0: Normal sequence (1, 2, 3)
Collect part
1
Take part to deposit area
3
Move to rejected part conveyor
Place part on conveyor Move to
accepted part conveyor
Plan 3: Normal sequence If part is accepted then (3.1, 3.3) If part is rejected then (3.2, 3.3)
3.1 3.2 3.3
[image:25.595.98.494.67.239.2]0
Figure 7: Hierarchical task analysis diagram of a part sorting robot.
6.1.1 Robot Sorting Task – Part 1: Isolation
The robot sorting task involves retrieving parts from a collection area and sorting them into good or bad based on quality. Part 1 of the robot sorting task has the following requirements. The robot must select a part from the part dispenser and place it on either a ‘good part’ or ‘bad part’ conveyor. The robot should perform an on-board analysis of the part to determine its quality. The distance from the part dispenser to the conveyors is 3 meters. The robot must be completely autonomous and not tethered or fixed in anyway.
To model the task requirements we used a scenario based technique called ‘hierarchical task analysis’, currently under evaluation at the Bristol Robotics Laboratory (BRL) [52]. Hierar-chical task analysis, developed by Duncan and Annett in the late 1960s [53], is a method of task analysis traditionally used in human factors work for time-motion studies. This involves analysing the way in which humans complete tasks, with the aim of improving efficiency. With this approach there is particular emphasis on task decomposition, which means taking each element of a task and breaking it down to its simplest form [53]. The approach of identifying task-based elements of a process, suggests that hierarchical task analysis may be a promising technique for designing complex robot tasks which need to be performed more dynamically when compared to traditional manufacturing robots. Although we believe this technique has not been used before for describing personal robot tasks, we have found it a useful method for task decomposition.
The diagram of Figure 7 shows it is possible, in principle, to use this technique for modelling customer requirements in a clear and concise manner. In this diagram the robot’s tasks are decomposed hierarchically into sub-tasks; the sequencing of sub-tasks at each level is specified as a plan. The sequence of nodes for each plan dictate the logical steps by which each task should be performed.
Hierarchical task analysis would be performed in the early stages of a project in order to record how each task should be completed. The diagrams produced would then be used in the hazard analysis process to help safety engineers both understand the task process and identify any hazardous situations that may arise as a result of the way in which a task is structured.
6.1.2 Robot Sorting Task – Part 2: Human-Robot Interaction
![Table 1: Risk classification table (based on table B1 of IEC 61508 [37])](https://thumb-us.123doks.com/thumbv2/123dok_us/9638265.466215/7.595.85.511.72.207/table-risk-classication-table-based-table-b-iec.webp)