Increased Risk for Developmental Disabilities in Children Who Have Major Birth Defects: A Population-Based Study
Pierre Decoufle´, ScD; Coleen A. Boyle, PhD; Leonard J. Paulozzi, MD, MPH; and Joseph M. Lary, PhD
ABSTRACT. Objective. We sought to quantify the strength of associations between each of four specific developmental disabilities (DDs) and specific types of major birth defects.
Methods. We linked data from 2 independent surveil- lance systems, the Metropolitan Atlanta Congenital De- fects Program and the Metropolitan Atlanta Develop- mental Disabilities Surveillance Program. Children with major birth defects (n ⴝ 9142; born 1981–1991 in metro Atlanta) and 3- to 10-year-old children who were born between 1981 and 1991 in metro Atlanta and identified between 1991 and 1994 as having mental retardation, cerebral palsy, hearing impairment, or vision impairment (nⴝ 3685) were studied. Prevalence ratio (PR), which is the prevalence of a DD in children with 1 or more major birth defects divided by the prevalence of the same DD in children without major birth defects, was measured.
Results. Among the 9142 children who were born with a major birth defect, 657 (7.2%) had a serious DD compared with 0.9% in children with no major birth defect, yielding a PR of 8.3 (95% confidence interval:
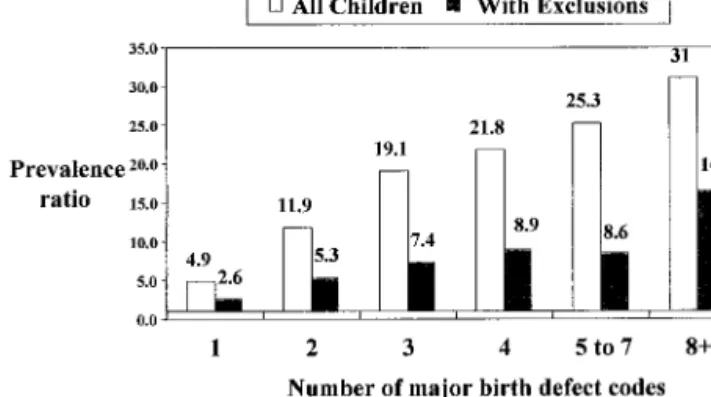
7.6 –9.0). In general, the more severe the DD, the higher was the PR. Birth defects that originated in the nervous system and chromosomal defects resulted in the highest PRs for a subsequent DD. For all other categories of birth defects, PRs were lowest when all major birth defects present were confined to a single category (ie, isolated defects). PRs for any DD increased monotonically with the number of coded birth defects per child or the num- ber of different birth defect categories per child, regard- less of the severity of the defect or whether defects of the nervous system, chromosomal defects, or “other syn- dromes” were counted.
Conclusions. These data highlight the possible early prenatal origins of some DDs and suggest that both the number of coded birth defects present and the number of anatomic systems involved are strongly related to func- tional outcomes. Pediatrics 2001;108:728 –734; birth de- fects, developmental disabilities, mental retardation, cere- bral palsy, hearing impairment, vision impairment, surveillance systems.
ABBREVIATIONS. DD, developmental disabilities; MR, mental retardation; CP, cerebral palsy; TORCH, toxoplasmosis-rubella- cytomegalovirus-herpes simplex; MACDP, Metropolitan Atlanta Congenital Defects Program; MADDSP, Metropolitan Atlanta De- velopmental Disabilities Surveillance Program; ICD-9, Interna- tional Classification of Diseases-Ninth Revision; HI, hearing impair-
ment; VI, vision impairment; PR, prevalence ratio; CI, confidence interval.
Developmental disabilities (DDs) comprise a group of nonprogressive conditions first manifested in childhood that result from in- sults to the developing brain or sensory organs and are associated with deficits in many areas of day-to- day functioning, such as communication, learning, behavior, and motor ability. DDs have been reported to be present in 17% of US children.1The most seri- ous of the DDs (mental retardation [MR], cerebral palsy [CP], epilepsy, autism, permanent bilateral hearing loss, and legal blindness) together affect 1%
to 2% of young children.2– 4These conditions prove costly in terms of special education services, medical and supportive care, demands on caregivers, and economic loss to society.5–9 Furthermore, epilepsy, CP, and MR are associated with a substantially in- creased risk of premature mortality.10 –15
Although the causes for some DDs are well known (eg, Down syndrome, fragile X, toxoplasmosis-rubel- la-cytomegalovirus-herpes simplex [TORCH] infec- tions, certain structural brain defects),16 causes for the majority remain unexplained.17–20 Some struc- tural birth defects, other than those that directly af- fect the central nervous system, may play a role in the origins of some DDs.21–27 If certain structural birth defects are found to be strongly related to spe- cific DDs, then we might discover additional clues to the prenatal origin of some DDs. These defects also could serve as markers for early identification of children who eventually may need additional medi- cal, educational, and social services. In the present study, the existence of 2 independent, population- based surveillance systems that cover the same geo- graphic area provided a unique opportunity to ex- amine associations between many different types of structural birth defects and each of 4 serious DDs.
We are not aware of any previous studies that used a similar methodology.
METHODS
The data for this report were derived from the Metropolitan Atlanta Congenital Defects Program (MACDP) and the Metropol- itan Atlanta Developmental Disabilities Surveillance Program (MADDSP). Both systems cover the 5 Georgia counties of Clayton, Cobb, Dekalb, Fulton, and Gwinnett, an area that includes the city of Atlanta. This area had approximately 33 000 resident live-born infants annually during the study period, 39% of which were black and the remainder almost all white. Both systems have been described in detail elsewhere.2,28
From the National Center on Birth Defects and Developmental Disabilities Centers for Disease Control and Prevention, Atlanta, Georgia.
Received for publication Aug 4, 2000; accepted Mar 14, 2001.
Reprint requests to (C.A.B.) Centers for Disease Control and Prevention (F-15), 4770 Buford Hwy NE, Atlanta, GA 30341. E-mail: [email protected] PEDIATRICS (ISSN 0031 4005). Copyright © 2001 by the American Acad- emy of Pediatrics.
Birth Defects
The MACDP, which began in 1968, identifies children with major structural birth defects among live or stillborn infants whose mother’s residence at the time of birth was within the surveillance area. MACDP personnel find cases from regular chart reviews at the 18 newborn and 2 pediatric referral hospitals that serve the surveillance area, from specialized diagnostic centers, and from vital records.
For this report, children who were born alive to residents of the surveillance area from 1981 through 1991 and included in the MACDP were chosen as the starting point for defining the popu- lation of children with birth defects (n⫽ 13 875). Because children must be at least 3 years old to be included in the MADDSP, we excluded children in the MACDP who were known to have died during the first year of life (n⫽ 1024 infant deaths). In addition, we excluded 56 children who had any of 8 selected birth defects that are associated with poor survival rates (trisomy 13, trisomy 18, anencephaly, hypoplastic left heart syndrome, bilateral renal agenesis, alobar holoprosencephaly, thanatophoric dwarfism, and harlequin ichthyosis), 273 children whose birth defects were coded as “probable,” and 3380 children who had exclusively prematuri- ty-related anomalies (eg, patent ductus arteriosus with a birth weight⬍2500 g) or exclusively minor anomalies (eg, hernias, skin tags) that are no longer considered cases by the MACDP. The final study group included the remaining 9142 children who had at least 1 major birth defect.
In the MACDP, up to 24 different birth defects can be coded for each child. We reviewed all of these codes and classified each of the 9142 study children into 1 or more of 11 anatomic or etiologic International Classification of Diseases–Ninth Revision (ICD-9) cate- gories on the basis of their major birth defects (not considering any coexisting minor or “probable” codes), with many children being included in more than 1 category. The “nervous system” category was subdivided further into neural tube defects (eg, spina bifida, encephalocele) and all other nervous system defects. The “eye, ear, other head and neck” category was subdivided into 3 subcatego- ries: “eye,” “ear,” and “other head and neck” defects. The chro- mosomal defects category was subdivided into Down syndrome and all other chromosomal defects. The “all other major defects”
category included “other syndromes and specified anomalies”
(ICD-9 759.6, 759.8, 760.71, 760.75); congenital TORCH infections;
neoplasms; endocrine, nutritional, metabolic, and immune system defects; and all remaining defects (primarily those coded in the ICD-9 759 series that were not included in another category). Some single-gene disorders may be included in this category. We iden- tified children whose major birth defects were confined to only 1 of the 11 birth defect categories, for which we used the term
“isolated defects.” Sequences were not identified easily as such and therefore may or may not be included as isolated defects.
Developmental Disabilities
The MADDSP, begun in 1991, identifies children who are aged 3 to 10 years and have MR, CP, serious bilateral hearing impair- ment (HI), or serious bilateral vision impairment (VI) and whose parents are residents of the surveillance area when the children are identified. Surveillance case definitions for these 4 conditions have been published.2Children who have these conditions are found through review of records at multiple public and private sources, with the special education departments in the 9 public school systems that serve the surveillance area being the major source. For each surveillance year, we compared electronically the list of children enrolled in the MADDSP with the MACDP file to identify matches. Questionable matches are checked manually, and the MACDP data are appended to the MADDSP file for all matched children.
DDs in children who were enrolled in the MADDSP during 1991 to 1994 and born to a resident of the study area from 1981 to 1991 served as the outcome variables (n⫽ 3685 children). Of this total, 3031 children had MR, 796 had CP, 286 had HI, and 270 had VI; 558 (15%) children had 2 or more of the 4 DDs. We subdivided children with MR or CP according to severity and the presence of coexisting DDs. For MR, we used the commonly defined catego- ries of mild MR (IQ 50 –70) and severe MR (IQ⬍50). We catego- rized children with CP as “disabled” or “nondisabled” on the basis of published criteria.29We defined children as having “iso- lated MR” or “isolated CP” if they did not have a coexisting disability, including autism or a seizure disorder. Although au- tism and seizure disorders are not among the conditions surveyed by the MADDSP, they are included in the database if found during record review as coexisting with any of the 4 target con- ditions.
Analyses
The prevalence of DDs in children with a major birth defect (n⫽ 9142) was compared with the prevalence of DDs among all 1-year survivors who were born to residents of the study area during 1981 to 1991, excluding those with a major birth defect (n⫽ 358 051⫺ 9142 ⫽ 348 909). The ratio of these rates (prevalence ratio [PR]) was calculated as the measure of the strength of the association between major birth defects and DDs. We subdivided children with major birth defects both by the number of birth defect codes that they had and by the number of anatomic ICD-9 categories encompassed by their birth defects. We computed 95%
confidence intervals (CIs) for the PRs and linear trend statistics (Mantel test) using the Statistical Analysis Battery for Epidemio- logic Research.
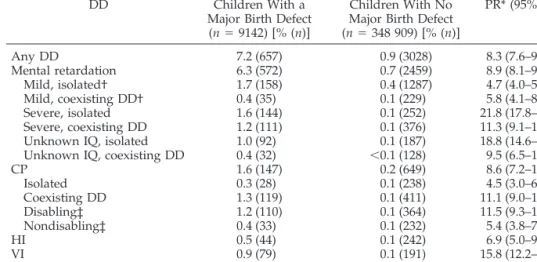
TABLE 1. Prevalence Rate of the Specified DD (and Number of 3- to 10-Year-Old Children With the Specified DD) in Children With or Without Major Birth Defects, and PR (95% CI)
DD Children With a
Major Birth Defect (n⫽ 9142) [% (n)]
Children With No Major Birth Defect (n⫽ 348 909) [% (n)]
PR* (95% CI)
Any DD 7.2 (657) 0.9 (3028) 8.3 (7.6–9.0)
Mental retardation 6.3 (572) 0.7 (2459) 8.9 (8.1–9.7)
Mild, isolated† 1.7 (158) 0.4 (1287) 4.7 (4.0–5.5)
Mild, coexisting DD† 0.4 (35) 0.1 (229) 5.8 (4.1–8.3)
Severe, isolated 1.6 (144) 0.1 (252) 21.8 (17.8–26.7)
Severe, coexisting DD 1.2 (111) 0.1 (376) 11.3 (9.1–13.9)
Unknown IQ, isolated 1.0 (92) 0.1 (187) 18.8 (14.6–24.1)
Unknown IQ, coexisting DD 0.4 (32) ⬍0.1 (128) 9.5 (6.5–14.0)
CP 1.6 (147) 0.2 (649) 8.6 (7.2–10.3)
Isolated 0.3 (28) 0.1 (238) 4.5 (3.0–6.6)
Coexisting DD 1.3 (119) 0.1 (411) 11.1 (9.0–13.5)
Disabling‡ 1.2 (110) 0.1 (364) 11.5 (9.3–14.3)
Nondisabling‡ 0.4 (33) 0.1 (232) 5.4 (3.8–7.8)
HI 0.5 (44) 0.1 (242) 6.9 (5.0–9.6)
VI 0.9 (79) 0.1 (191) 15.8 (12.2–20.5)
* Prevalence of the specified DD in children with a major birth defect divided by the prevalence of the specified DD in children with no major birth defect.
† See text for definition.
‡ See text and reference 29 for definition.
RESULTS
Of the 9142 study children who were born with 1 or more major birth defects, 657 (7.2%) were identi- fied independently by the MADDSP as having a DD at ages 3 to 10 years while they were still living in the surveillance area. Conversely, 657 (17.8%) of the 3685 children who were aged 3 to 10 years and had a DD had been identified independently with a major birth defect by the MACDP. Of the 657 children with both a major birth defect and a DD, 390 (59%) had either defects of the nervous system or chromosomal de- fects alone, or in combination with other defects.
Compared with the prevalence of DDs among the 348 909 children who had no major birth defects and who survived the first year of life, the prevalence of DDs among the 9142 children with major birth de- fects was exceptionally high (Table 1). The PRs var- ied from 4.5 for isolated CP to 21.8 for isolated severe MR. The PR for severe MR was higher than for mild MR, and the presence of another DD did not neces- sarily increase the strength of the associations with
MR. However, the PR was much higher for disabling CP than for nondisabling CP and for CP coexisting with another DD than for isolated CP. VI was more strongly associated with major birth defects than was HI.
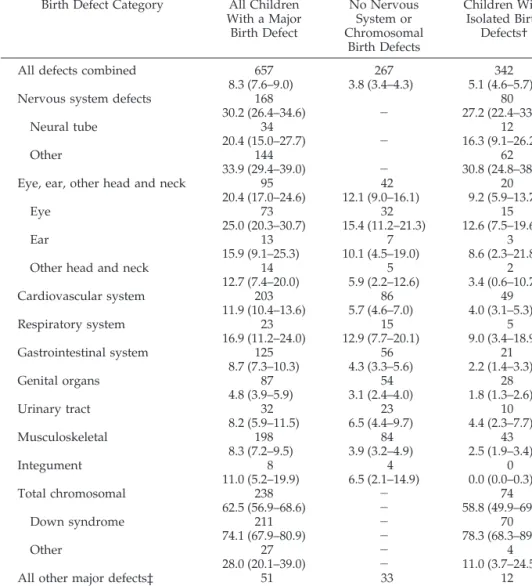
The strength of the association between birth de- fects and DDs varied with type of birth defect and presence of other types of birth defects (Table 2). The strongest associations were evident for chromosomal defects (PR ⫽ 62.5); defects of the nervous system (PR⫽ 30.2); and eye, ear, and head and neck defects (PR ⫽ 20.4), and the weakest association prevailed for genital organ defects (PR ⫽ 4.8). Although the magnitude of the associations with DD generally were weaker when children with either nervous sys- tem or chromosomal defects were eliminated, they still were substantial. With the exception of nervous system defects and chromosomal defects, the associ- ations between DDs and specific birth defect catego- ries were weakest when the analyses were limited to children with isolated defects. In those analyses, the
TABLE 2. PR* (95% CI) and Number of Children With a DD in the Specified Birth Defect Category
Birth Defect Category All Children With a Major Birth Defect
No Nervous System or Chromosomal
Birth Defects
Children With Isolated Birth
Defects†
All defects combined 657 267 342
8.3 (7.6–9.0) 3.8 (3.4–4.3) 5.1 (4.6–5.7)
Nervous system defects 168 80
30.2 (26.4–34.6) ⫺ 27.2 (22.4–33.0)
Neural tube 34 12
20.4 (15.0–27.7) ⫺ 16.3 (9.1–26.2)
Other 144 62
33.9 (29.4–39.0) ⫺ 30.8 (24.8–38.2)
Eye, ear, other head and neck 95 42 20
20.4 (17.0–24.6) 12.1 (9.0–16.1) 9.2 (5.9–13.7)
Eye 73 32 15
25.0 (20.3–30.7) 15.4 (11.2–21.3) 12.6 (7.5–19.6)
Ear 13 7 3
15.9 (9.1–25.3) 10.1 (4.5–19.0) 8.6 (2.3–21.8)
Other head and neck 14 5 2
12.7 (7.4–20.0) 5.9 (2.2–12.6) 3.4 (0.6–10.7)
Cardiovascular system 203 86 49
11.9 (10.4–13.6) 5.7 (4.6–7.0) 4.0 (3.1–5.3)
Respiratory system 23 15 5
16.9 (11.2–24.0) 12.9 (7.7–20.1) 9.0 (3.4–18.9)
Gastrointestinal system 125 56 21
8.7 (7.3–10.3) 4.3 (3.3–5.6) 2.2 (1.4–3.3)
Genital organs 87 54 28
4.8 (3.9–5.9) 3.1 (2.4–4.0) 1.8 (1.3–2.6)
Urinary tract 32 23 10
8.2 (5.9–11.5) 6.5 (4.4–9.7) 4.4 (2.3–7.7)
Musculoskeletal 198 84 43
8.3 (7.2–9.5) 3.9 (3.2–4.9) 2.5 (1.9–3.4)
Integument 8 4 0
11.0 (5.2–19.9) 6.5 (2.1–14.9) 0.0 (0.0–0.3)
Total chromosomal 238 ⫺ 74
62.5 (56.9–68.6) ⫺ 58.8 (49.9–69.2)
Down syndrome 211 ⫺ 70
74.1 (67.9–80.9) ⫺ 78.3 (68.3–89.8)
Other 27 ⫺ 4
28.0 (20.1–39.0) ⫺ 11.0 (3.7–24.5)
All other major defects‡ 51 33 12
10.7 (8.2–13.9) 7.8 (5.6–10.8) 4.5 (2.5–7.6)
* Prevalence of a DD in children with a major birth defect in the specified ICD-9 category divided by the prevalence of a DD in children with no major birth defect.
† Children with 1 or more major birth defects that were limited to a specified ICD-9 category.
‡ See text for definition.
prevalence of DDs was still statistically elevated in all birth defect categories, except for integument, for which there were no DD cases.
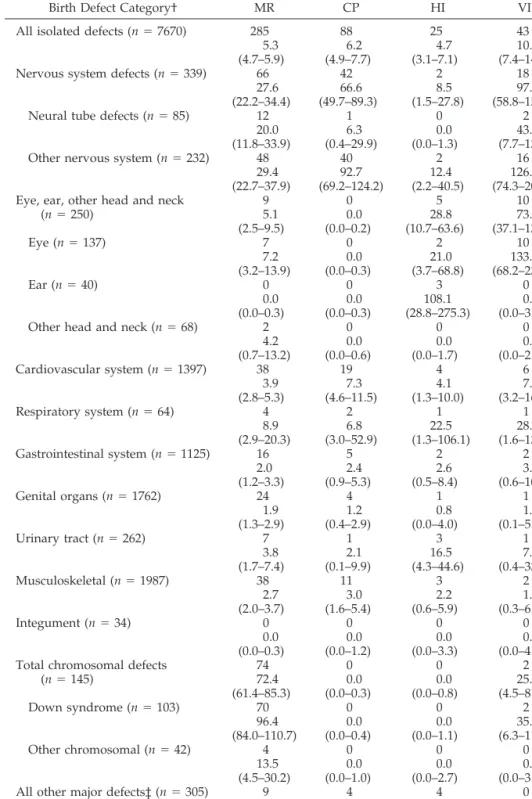
Each of the 4 DDs was strongly associated with most specific categories of isolated birth defects (Ta- ble 3). The most consistent and strongest associations were between each of the 4 DDs and “other nervous system” defects, which were related primarily to
structural brain anomalies. In several instances, as- sociations were unusually strong between a specific DD and a specific isolated birth defect, for example, MR and eye defects (PR⫽ 7.2), CP and cardiovascu- lar defects (PR ⫽ 7.3), HI and urinary tract defects (PR ⫽ 16.5), and VI and neural tube defects (PR ⫽ 43.0). Within the “all other major defects” category (data not shown), we found the expected associa-
TABLE 3. PR* (95% CI) and Number of Children With the Specified DD, by Isolated Major Birth Defect Category
Birth Defect Category† MR CP HI VI
All isolated defects (n⫽ 7670) 285 88 25 43
5.3 6.2 4.7 10.2
(4.7–5.9) (4.9–7.7) (3.1–7.1) (7.4–14.2)
Nervous system defects (n⫽ 339) 66 42 2 18
27.6 66.6 8.5 97.0
(22.2–34.4) (49.7–89.3) (1.5–27.8) (58.8–151.7)
Neural tube defects (n⫽ 85) 12 1 0 2
20.0 6.3 0.0 43.0
(11.8–33.9) (0.4–29.9) (0.0–1.3) (7.7–137.9)
Other nervous system (n⫽ 232) 48 40 2 16
29.4 92.7 12.4 126.0
(22.7–37.9) (69.2–124.2) (2.2–40.5) (74.3–200.6) Eye, ear, other head and neck
(n⫽ 250) 9 0 5 10
5.1 0.0 28.8 73.1
(2.5–9.5) (0.0–0.2) (10.7–63.6) (37.1–130.4)
Eye (n⫽ 137) 7 0 2 10
7.2 0.0 21.0 133.3
(3.2–13.9) (0.0–0.3) (3.7–68.8) (68.2–234.8)
Ear (n⫽ 40) 0 0 3 0
0.0 0.0 108.1 0.0
(0.0–0.3) (0.0–0.3) (28.8–275.3) (0.0–3.6)
Other head and neck (n⫽ 68) 2 0 0 0
4.2 0.0 0.0 0.0
(0.7–13.2) (0.0–0.6) (0.0–1.7) (0.0–2.1)
Cardiovascular system (n⫽ 1397) 38 19 4 6
3.9 7.3 4.1 7.8
(2.8–5.3) (4.6–11.5) (1.3–10.0) (3.2–16.5)
Respiratory system (n⫽ 64) 4 2 1 1
8.9 6.8 22.5 28.5
(2.9–20.3) (3.0–52.9) (1.3–106.1) (1.6–134.7)
Gastrointestinal system (n⫽ 1125) 16 5 2 2
2.0 2.4 2.6 3.2
(1.2–3.3) (0.9–5.3) (0.5–8.4) (0.6–10.7)
Genital organs (n⫽ 1762) 24 4 1 1
1.9 1.2 0.8 1.0
(1.3–2.9) (0.4–2.9) (0.0–4.0) (0.1–5.1)
Urinary tract (n⫽ 262) 7 1 3 1
3.8 2.1 16.5 7.0
(1.7–7.4) (0.1–9.9) (4.3–44.6) (0.4–33.7)
Musculoskeletal (n⫽ 1987) 38 11 3 2
2.7 3.0 2.2 1.8
(2.0–3.7) (1.6–5.4) (0.6–5.9) (0.3–6.1)
Integument (n⫽ 34) 0 0 0 0
0.0 0.0 0.0 0.0
(0.0–0.3) (0.0–1.2) (0.0–3.3) (0.0–4.2) Total chromosomal defects
(n⫽ 145) 74 0 0 2
72.4 0.0 0.0 25.2
(61.4–85.3) (0.0–0.3) (0.0–0.8) (4.5–81.8)
Down syndrome (n⫽ 103) 70 0 0 2
96.4 0.0 0.0 35.5
(84.0–110.7) (0.0–0.4) (0.0–1.1) (6.3–114.4)
Other chromosomal (n⫽ 42) 4 0 0 0
13.5 0.0 0.0 0.0
(4.5–30.2) (0.0–1.0) (0.0–2.7) (0.0–3.4)
All other major defects‡ (n⫽ 305) 9 4 4 0
4.2 7.1 18.9 0.0
(2.1–7.6) (2.3–16.8) (6.1–45.4) (0.0–0.5)
* Prevalence of a specific DD in children with a major birth defect in the specified ICD-9 category divided by the prevalence of the same DD in children with no major birth defect.
† Children with 1 or more major birth defects that were limited to the specified ICD-9 category.
‡ See text for definition.
tions between MR and congenital TORCH infections (PR ⫽ 24.3)30 and between MR and fetal alcohol syndrome (PR⫽ 29.1).31The high prevalence of MR (PR ⫽ 23.3) in children with defects classified as
“other syndromes” (ICD-9, 759.6, 759.8) confirms previous clinical case reports of such associations.32 The PR for any DD increased monotonically with the number of coded birth defects per child (Fig 1) and with the number of birth defect categories rep- resented by a child’s major defects (Table 4). The rising trend in PRs with the number of birth defects or the number of birth defect categories was attenu- ated but remained strong when children with ner- vous system defects, chromosomal defects, or “other syndromes” were excluded from these analyses.
DISCUSSION
This report suggests a role for deleterious factors operating prenatally in the origins of many DDs. In some children, 1 or more birth defects may be the underlying cause of a DD (such as Down syndrome), and in other children both their birth defect(s) and their DD may be because of a common third factor (eg, prenatal alcohol exposure). Although children with a major birth defect may undergo more intense scrutiny than other children later in life by medical and educational professionals and thus be more likely to have a DD diagnosed, the range and mag- nitude of increased risks seem to dispel this phenom- enon as an explanation for the findings. Clearly, the magnitude of the increased risk associated with ma-
jor birth defects is not uniform over specific subtypes of DDs. PRs were lowest for mild MR and for iso- lated or nondisabling CP and highest for isolated severe MR and for VI. Future, more detailed analyses could focus on the specific DDs with the strongest associations. In terms of attributable fractions, major birth defects may be associated with as many as 16%
of all children with 1 or more of the 4 DDs studied here and with approximately 35% of all cases of isolated severe MR.
Our data indicate that the absolute number of recorded birth defects codes and the number of an- atomic systems involved are predictive of functional outcomes. These findings suggest that the number of codes may be a marker of the severity of the defect and the pervasiveness of the damage to the develop- ing fetus (even if only 1 defect may be present). It also is possible that some children with many coded birth defects are those with unrecognized syndromes (which are underascertained in the MACDP) that are strongly related to some DDs.
Some of the birth defects examined here probably caused 1 or more DDs directly by disrupting normal functional development. For example, nervous sys- tem defects caused some MR or CP, ear defects caused some HI, and eye defects caused some VI.
The specific associations between these birth defects and DDs are exceptionally strong (PR: 20.0 –133.3).
However, each of the 4 DDs also was strongly asso- ciated with isolated birth defects that would not be expected to alter functional development of those organs affected by the DDs. For example, MR was strongly associated with isolated eye defects as well as isolated defects of the cardiovascular, respiratory, gastrointestinal, reproductive, urinary, and musculo- skeletal systems. These multiple associations suggest that some cases of MR are not caused directly by coexisting birth defects but instead may be produced by other factors present early in embryonic develop- ment, which act as common causes of both birth defects and MR. Alcohol and isotretinoin are exam- ples of such teratogens.31,33Alternatively, the timing of an insult during pregnancy may determine whether a birth defect and a neurobehavioral disor- der are produced in the same child. For example, alcohol consumption starting early in pregnancy can
Fig 1. PR for any DD by the number of major birth defect codes.
TABLE 4. PR* (95% CI) and Number of Children With the Specified DD, by the Number of Different Categories of Major Birth Defects Involved
Number of Birth Defect Categories Involved†
Any DD MR CP HI VI
1 (n⫽ 7153) 184 141 45 23 23
3.0 2.8 3.4 4.6 5.9
(2.6–3.4) (2.4–3.3) (2.5–4.6) (3.0–7.1) (3.8–9.0)
2 (n⫽ 666) 42 35 13 3 6
7.3 7.5 10.5 6.5 16.5
(5.4–9.8) (5.4–10.3) (6.1–18.1) (1.7–17.6) (6.7–34.5)
3–9 (n⫽ 169) 22 17 5 5 3
15.0 14.3 15.9 42.7 32.4
(10.1–22.2) (9.1–22.4) (5.9–34.6) (15.8–93.5) (8.5–87.2)
* Prevalence of the specified DD in children with major birth defects represented by the specified number of birth defect categories divided by the prevalence of the specified DD in children with no major birth defect.
† Refers to major birth defects only. Excludes children with nervous system defects, chromosomal anomalies, or “other syndromes” (ICD-9 codes 759.6, 759.8, 760.71, 760.75).
induce dysmorphologic features, whereas the same exposure starting late in pregnancy results in mental and behavioral deficits.34,35
Some of the DDs included here could have been caused by postnatal events, such as strokes, injuries, and infectious diseases. In fact, for the 1991 MADDSP surveillance year, an estimated 4.5% of all DDs resulted from postnatal events.36 Other DDs may have been caused by perinatal events, such as infections, asphyxia, and preterm delivery.16,17If we excluded from our data set DDs known to be post- natal or perinatal in origin, then the association be- tween birth defects and the remaining DDs would be even stronger.
The PRs shown here can be viewed as estimates of what the “true” PRs would have been if all children, with or without major birth defects, in the birth cohorts under study had been followed completely from age 1 year to 10 years to identify all cases of the selected DDs. In the present study, however, not all children in the birth cohorts of interest had attained their 10th birthday during the 1991 to 1994 surveil- lance years, others may have died with a DD before being eligible to be ascertained by MADDSP, and for others, 1 of the selected DDs may have been diag- nosed only after their families emigrated from the study area. Because we did not have information on deaths that occurred among cohort members who survived infancy, we attempted to account for some of the deaths by excluding from the analysis defects known to have poor survival rates. Selective emigra- tion (ie, children with birth defects being more or less likely than children without birth defects to leave Atlanta before the recognition of their DD) may have occurred. Nevertheless, given the strength of the as- sociations that we found between the specific birth defects and the DDs, it seems unlikely that these methodologic shortcomings could explain fully the associations that we reported.
This report highlights the role of prenatal factors in the origin of many DDs and suggests that a sizable proportion of DDs may be caused by insults that occur early in embryologic development. Because many cases of DDs are not manifested until months or years after birth, both the type and the number of major birth defects present in the first year of life may serve as a marker or early warning sign of subsequent cognitive, motor, and sensory deficits.
Our data suggest that birth defects pose a greater burden on society than previously recognized.
ACKNOWLEDGMENT
We thank Dr Cynthia Moore for insightful comments, which helped to strengthen this article.
REFERENCES
1. Boyle CA, Decoufle´ P, Yeargin-Allsopp M. Prevalence and health im- pact of developmental disabilities in US children. Pediatrics. 1994;93:
399 – 403
2. Boyle CA, Yeargin-Allsopp M, Doernberg NS, Holmgreen P, Murphy CC, Schendel DE. Prevalence of selected developmental disabilities in children 3–10 years of age: the Metropolitan Atlanta Developmental Disabilities Surveillance Program, 1991. MMWR Morb Mortal Wkly Rep.
1996;45(SS-2):1–14
3. Yeargin-Allsopp M, Murphy CC, Oakley GP, Sikes K. A multiple-source method for studying the prevalence of developmental disabilities in
children: the Metropolitan Atlanta Developmental Disabilities Study.
Pediatrics. 1992;89:624 – 630 (published erratum appears in Pediatrics.
1992;90:1001)
4. Murphy CC, Trevathan E, Yeargin-Allsopp M. Prevalence of epilepsy and epileptic seizures in 10-year-old children: results from the Metro- politan Atlanta Developmental Disabilities Study. Epilepsia. 1995;36:
866 – 872
5. Birenbaum A, Guyot D, Cohen HJ. Health Care Financing for Severe Developmental Disabilities. Washington, DC: American Association on Mental Retardation; 1990
6. Braddock D, Hemp R, Parish S, Westrich J. The State of the States in Developmental Disabilities. 5th ed. Washington, DC: American Associa- tion on Mental Retardation; 1998
7. National Foundation for Brain Research. The Cost of Disorders of the Brain. Washington, DC: Lewin-ICF; 1992
8. Waitzman NJ, Scheffler RM, Romano PS. The Costs of Birth Defects:
Estimates of the Value of Prevention. Lanham, MD: University Press of America; 1996
9. US Department of Education. Twentieth Annual Report to Congress on the Implementation of the Individuals with Disabilities Education Act. Washing- ton, DC: US Department of Education; 1998
10. Evans PM, Evans SJW, Alberman E. Cerebral palsy: why we must plan for survival. Arch Dis Child. 1990;65:1329 –1333
11. Hutton JL, Cooke T, Pharaoh POD. Life expectancy in children with cerebral palsy. Br Med J. 1994;309:431– 435
12. Harvey AS, Nolan T, Carlin JB. Community-based study of mortality in children with epilepsy. Epilepsia. 1993;34:597– 603
13. Forsgren L, Edvinsson S-O, Nystro¨m L, Blomquist HK. Influence of epilepsy on mortality in mental retardation: an epidemiologic study.
Epilepsia. 1996;37:956 –963
14. Dupont A, Mortensen PB. Avoidable death in a cohort of severely mentally retarded. In: Fraser WI, ed. Key Issues in Mental Retardation Research. London, England: Routledge; 1990:28 –34
15. Dupont A, Væth M, Videbech P. Mortality, life expectancy and causes of death of mildly mentally retarded in Denmark. Ups J Med Sci Suppl.
1987;44:76 – 82
16. Murphy CC, Boyle C, Schendel D, Decoufle´ P, Yeargin-Allsopp M.
Epidemiology of mental retardation in children. Ment Retard Dev Disabil Res Rev. 1998;4:6 –13
17. Yeargin-Allsopp M, Murphy CC, Cordero JF, Decoufle´ P, Hollowell JG.
Reported biomedical causes and associated medical conditions for men- tal retardation among 10-year-old children, metropolitan Atlanta, 1985 to 1987. Dev Med Child Neurol. 1997;39:142–149
18. McLaren J, Bryson SE. Review of recent epidemiological studies of mental retardation: prevalence, associated disorders, and etiology. Am J Ment Retard. 1987;92:243–254
19. Wellesley D, Hockey A, Stanley F. The aetiology of intellectual disabil- ity in western Australia: a community-based study. Dev Med Child Neurol. 1991;33:963–973
20. Anderson G, Schroer RJ, Stevenson RE. Mental retardation in South Carolina. II. Causation. Proc Greenwood Genet Center. 1996;15:32– 44 21. Petridou E, Koussouri M, Toupadaki N, et al. Risk factors for cerebral
palsy: a case-control study in Greece. Scand J Soc Med. 1996;24:14 –26 22. Siegel-Sadewitz V, Shprintzen RJ. The relationship of communication
disorders to syndrome identification. J Speech Hear Disord. 1982;47:
338 –354
23. Depue RH. Cryptorchidism, an epidemiologic study with emphasis on the relationship to central nervous system dysfunction. Teratology. 1988;
37:301–305
24. Stro¨mland K, Nordin V, Miller M, Åkerstro¨m B, Gillberg C. Autism in thalidomide embryopathy: a population study. Dev Med Child Neurol.
1994;36:351–356
25. Rodier PM, Bryson SE, Welch JP. Minor malformations and physical measurements in autism: data from Nova Scotia. Teratology. 1997;55:
319 –325
26. Kirby RS, Brewster MA, Canino CU, Pavin M. Early childhood surveil- lance of developmental disorders by a birth defects surveillance system:
methods, prevalence comparisons, and mortality patterns. J Dev Behav Pediatr. 1995;16:318 –326
27. Naeye RL, Peters EC, Bartholomew M, Landis JR. Origins of cerebral palsy. Am J Dis Child. 1989;143:1154 –1161
28. Edmonds LD, Layde PM, James LM, Flynt JW, Erickson JD, Oakley GP.
Congenital malformations surveillance: two American systems. Int J Epidemiol. 1981;10:247–252
29. Pinto-Martin JA, Riolo S, Cnaan A, Holzman C, Susser M, Paneth N.
Cranial ultrasound prediction of disabling cerebral palsy at age two in a low birth weight population. Pediatrics. 1995;95:249 –254
30. Stern H, Booth JC, Elek SD, Fleck DG. Microbial causes of mental retardation. The role of prenatal infections with cytomegalovirus, ru- bella virus, toxoplasma. Lancet. 1969;ii:443– 448
31. Streissguth AP, Barr HM, Sampson PD. Moderate prenatal exposure:
effects on child IQ and learning problems at age 71⁄2years. Alcohol Clin Exp Res. 1990;14:662– 669
32. Jones KL. Smith’s Recognizable Patterns of Human Malformation. 5th ed.
Philadelphia, PA: WB Saunders; 1997
33. Adams J, Lammer EJ. Relationship between dysmorphology and neuro- psychological function in children exposed to isotretinoin “in utero.” In:
Fujii T, Boer GJ, eds. Functional Neuroteratology of Short-Term Exposure to Drugs. Tokyo, Japan: Tokyo University Press; 1991:159 –168
34. Becker HC, Randall CL, Salo AL, Saulnier JL, Weathersby RT. Animal research. Charting the course for FAS. Alcohol Health Res World. 1994;
18:10 –16
35. Coles C. Critical periods for prenatal alcohol exposure. Evidence from animal and human studies. Alcohol Health Res World. 1994;18:22–29 36. Centers for Disease Control and Prevention. Postnatal causes of devel-
opmental disabilities in children aged 3–10 years—Atlanta, Georgia, 1991. MMWR Morb Mortal Wkly Rep. 1996;45:130 –134
BEST AVAILABLE, NOT MOST POSSIBLE
Highly trained clinicians are eager to rise to the challenge of separating con- joined twins with a single heart. But we find it troubling that the decision could have been made without any constraints or need to justify the expenditure . . . in a world of limited public medical resources, some medical procedures are so costly, and their benefits so doubtful, that it should not be within the power of physicians to offer them to their patients. If doctors cannot ration, then another decision- making authority must be involved in these cases, so that physicians can offer their patients the best health care available, but not the best irrespective of cost.
Ratiu P, et al. The ethics and economics of heroic surgery. Hastings Cent Rep. 2001;31:47– 48
Submitted by Student
DOI: 10.1542/peds.108.3.728 2001;108;728 Pediatrics
Pierre Decouflé, Coleen A. Boyle, Leonard J. Paulozzi and Joseph M. Lary Birth Defects: A Population-Based Study
Increased Risk for Developmental Disabilities in Children Who Have Major
Services
Updated Information &
http://pediatrics.aappublications.org/content/108/3/728 including high resolution figures, can be found at:
References
http://pediatrics.aappublications.org/content/108/3/728#BIBL This article cites 26 articles, 4 of which you can access for free at:
Subspecialty Collections
http://www.aappublications.org/cgi/collection/for_your_benefit For Your Benefit
_management_sub
http://www.aappublications.org/cgi/collection/administration:practice Administration/Practice Management
al_issues_sub
http://www.aappublications.org/cgi/collection/development:behavior Developmental/Behavioral Pediatrics
following collection(s):
This article, along with others on similar topics, appears in the
Permissions & Licensing
http://www.aappublications.org/site/misc/Permissions.xhtml in its entirety can be found online at:
Information about reproducing this article in parts (figures, tables) or
Reprints
http://www.aappublications.org/site/misc/reprints.xhtml Information about ordering reprints can be found online:
DOI: 10.1542/peds.108.3.728 2001;108;728 Pediatrics
Pierre Decouflé, Coleen A. Boyle, Leonard J. Paulozzi and Joseph M. Lary Birth Defects: A Population-Based Study
Increased Risk for Developmental Disabilities in Children Who Have Major
http://pediatrics.aappublications.org/content/108/3/728 located on the World Wide Web at:
The online version of this article, along with updated information and services, is
by the American Academy of Pediatrics. All rights reserved. Print ISSN: 1073-0397.
the American Academy of Pediatrics, 345 Park Avenue, Itasca, Illinois, 60143. Copyright © 2001 has been published continuously since 1948. Pediatrics is owned, published, and trademarked by Pediatrics is the official journal of the American Academy of Pediatrics. A monthly publication, it