How much of a nuisance is greasing the
palms? A study on job dedication and
attitudes towards corruption reports
under answer bias control
Friesenbichler, Klaus S. and Selenko, Eva and Clarke, George
R.G.
19 October 2015
Online at
https://mpra.ub.uni-muenchen.de/67331/
Klaus S. Friesenbichler*
Eva Selenko**
George Clarke***
Abstract
This article studies how prior exposure and individual respondent’s work attitudes affect the
degree to which corruption is perceived as an obstacle to business operations. Survey
questions about sensitive topics like corruption are susceptible to answer bias, for which we
control by implementing a randomised response technique. The results suggest that
corruption tends to be under-reported. Individuals who are more dedicated to their work
report corruption as a bigger obstacle. So did respondents who were previously exposed to
corruption. This effect becomes significantly stronger once we control for endogeneity issues
related to answer bias that affects past experiences with corruption over and above answer
bias that affects reports of corruption as an obstacle to business operations. We find that
individual experiences, in addition to contextual variables, shape corruption data available
from surveys.
Keywords: corruption, work dedication, reticence, random response, Bangladesh, Sri Lanka
HOW MUCH OF A NUISANCE IS GREASING THE PALMS? A STUDY ON JOB
DEDICATION AND ATTITUDES TOWARDS CORRUPTION REPORTS UNDER
ANSWER BIAS CONTROL
The adverse effects of corruption on both the entire economy and on firms that are
required to pay bribes are well documented (Jain, 2002; Jensen, Li, & Rahman, 2010a; Serra,
2006). Evidence shows that not only certain countries, but also industries and types of firms are
more exposed to corruption than others (Clarke, 2011b; Jensen, Li, & Rahman, 2010b;
Svensson, 2003). However, even in highly corrupt environments not everybody engages in
corruption, is exposed to it or even perceives it as an obstacle. The fight against corruption
requires knowledge about the individuals involved. While a lot is known about the contextual
factors explaining corruption, little is known about the individuals that pay bribes. Corruption
can only exist if people are willing to engage in it. Hence, we are interested in the perception
of corruption as an obstacle to business operations of the person that is exposed to it.
The present study analyses business leaders and their experience with government
corruption. We propose that whether corruption is viewed as an obstacle depends on several
factors that are specific to the respondent. These are the respondent’s prior experience with
corruption and work-attitude. We expect that these factors are relevant over and above the
organisational and environmental context. Understanding the conditions under which
corruption is perceived as an obstacle is a precondition for the acceptance of systemic
changes for which wider business climate reforms aim (Jain, 2002).
This paper’s contribution to the literature will be threefold. First, we will provide a
multi-layered perspective on corruption. Aside from contextual factors, we include the
respondent’s prior exposure to corruption and individual work attitudes to predict the
perception of corruption as an obstacle to doing business. Second, field research on
corruption often faces a major impediment. It relies on corruption data that is self-reported,
which may suffer from answer biases (Coutts & Jann, 2008). Respondents are unlikely to admit
engaging in sensitive behaviours. To address this issue the present paper will control for
possible survey response bias by a randomised response technique. We use this method not
only to control for bias affecting the key variable of interest, but also to control for possible
measurement bias affecting prior exposure to corruption as a key independent, yet
endogenous variable. Third, aside from a handful exceptions (Thau, Derfler-Rozin, Pitesa,
Mitchell, & Pillutla, 2014; Umphress, Bingham, & Mitchell, 2010), very few studies have looked
for the organisation. Investigating the role of work dedication in this context, will contribute to
a relatively novel field of research.
What explains attitudes towards corruption?
We explore when corruption is perceived as an obstacle for business operations. The
bulk of the literature focuses on contextual factors at the country and firm level. We will argue
that individual effects such as prior exposure to corruption and the dedication of the
respondent crucially matter for how corruption is perceived.
What do we mean by “corruption”? According to common definitions (e.g., Miriam
Webster online), corruption is described as dishonest or illegal behaviour by someone in
power (e.g., government officials), directed at another person for personal gain (e.g.,
bribes).1
Hence environmental factors that shape power-relationships will also influence the
likelihood of corruption. Many economic studies focus on such contextual factors. For
instance, country level evidence shows that corruption is lower in wealthier, more democratic
societies, whereas political instability increases the levels of corruption. In addition, corruption
tends to be higher in rural areas in which government officials are harder to supervise than in
urban areas with a more developed institutional infrastructure (Elbahnasawy & Revier, 2012;
Serra, 2006). These country level findings are complemented by firm attributes which have
also been associated with corruption. For instance, larger firms pay bribes not only more
often, but the bribes are also higher in their amount compared to smaller firms. The same
holds for younger firms relative to older firms. Exporting firms are more likely to be exposed to
corruption than firms that serve the local market, and firms that are foreign and/or privately
owned have been reported to pay fewer and less bribes than state-owned enterprises
(Clarke, 2011b; Jensen et al., 2010b; Svensson, 2003).
Academic definitions similarly stress the power-misuse element of corruption
(Bendahan, Zehnder, Pralong, & Antonakis, 2014a).
In addition to contextual factors, we assume that the perception of corruption as an
obstacle differs across respondents. We argue that it is likely that a person’s opinion about
corruption as an obstacle to business operations depends on their prior exposure to
corruption. This idea originates in the behaviour-to-attitude link, which has been a long
standing strand of research in social psychology (Holland, Verplanken, & Van Knippenberg,
2002; Zanna, Olson, & Fazio, 1980). It is generally accepted that attitudes might not only
guide future behaviour, but can also be inferred from past behaviour. This mechanism can be
found in the area of corruption (Lee & Guven, 2013). In a study investigating attitudes towards
corruption in over 20 countries, they found that past experience with bribery predicted how
people perceived bribery. People who had in the past been offered or requested bribes also
perceive bribes as more justified than people who had not. Then again, one may assume
that perceiving bribes as justified equates to perceiving bribes as not harmful and therefore
not as an obstacle to business operations. Hence, this results goes against the notion that
exposure to bribery might have a revealing effect on the perceptions of the related costs.
When it comes to assessing exposure to corruption outside the laboratory, most studies
use survey data (Bendahan, Zehnder, Pralong, & Antonakis, 2014b; Lee & Guven, 2013).
Corruption questions are typically embedded in business climate surveys that aim at
generating estimates of the impact of corruption. This concerns the differences in the effect
of corruption on firms, industries and countries. However, relying on survey data has
drawbacks. Corrupt behaviour can be a highly sensitive issue, which is why respondents may
not answer survey questions truthfully (Coutts & Jann, 2008). False responses and
non-responses are indeed a critical source of bias in corruption data (Jensen et al., 2010b).
Estimates suggest that survey responses underreport the commission of sensitive acts by 45%
on average (Lensvelt-Mulders, 2005).
The third factor that will be looked at to explain the perception of corruption as an
obstacle to business operations are the individual work attitudes of the respondent. This study
links corruption to ‘work engagement’, a key psychological characteristic of the manager
(Christian, Garza, & Slaughter, 2011; Kahn, 1990). Personal work engagement describes a
state in which employees “bring in” their personal selves during work role performances,
investing personal energy and experiencing an emotional connection with their work
(Christian et al., 2011; Kahn, 1990). Even though work dedication has been linked to various
attitudes related to doing business, nothing is yet known about how of work engagement
interacts with corruption and whether more dedicated respondents would see corruption
more or less as an obstacle. Two different predictions can be made.
For one, giving in to corrupt demands of tax officials, or even offering bribes, could be
seen as a particular form of extra-role organisational behaviour, as “unethical
pro-organisational behaviour” (Thau et al., 2014; Umphress et al., 2010). Different to other
organisational good. People who are highly engaged in their job are also more willing to go
the extra mile for their organisation to ‘gets things done’ (Harter, Schmidt, & Hayes, 2002;
Jensen & Rahman, 2011; Rich, Lepine, & Crawford, 2010; Xanthopoulou, Bakker, Demerouti, &
Schaufeli, 2009). Hence, more dedicated respondents might be more likely to respond to
corrupt demands for the benefit of their business. Empirical evidence points into this direction
(Umphress et al., 2010). They find that people who highly identify with their organisation were
more likely to engage in unethical pro-organisational behaviour. In this case, corruption
would be an alternative route towards organisationally beneficial outcomes. More
dedicated respondents would be less likely to perceive corruption as particular obstacle.
Then again, work-dedication may partly capture of job satisfaction, which was found to
be negatively related to unethical behaviour (for a meta-study see (Kish-Gephart, Harrison, &
Treviño, 2010). If this is the case, more dedicated respondents might perceive a corrupt
environment, i.e. a culture of bribery and corruption, more as an obstacle rather than as an
additional route to ‘get things done’.
The present study
This study investigates the effect of context, exposure and work dedication on
corruption attitude. We use representative data from two establishment level surveys
conducted in Sri Lanka and Bangladesh by the World Bank in 2011. These samples provide a
unique opportunity to study the link between work engagement and corruption in a
developing country context. Both surveys included on individual work engagement in the
World Bank Enterprise Surveys, and either country provides a viable setting for corruption
studies. The investment climate in both countries suffers from corruption, which provides
viable setting for corruption studies.For instance, Transparency International rankings confirm
the notion that the public sector in either country both is highly corrupt. In Transparency’s
2013 Corruption Perceptions Index, corruption values are assigned to 175 countries and territories, ranging from 0 (highly corrupt) to 100 (very clean). With a score of 27, Bangladesh
was ranked 136th, while Sri Lanka’s ranking was slightly better (91), its score of 37 was similarly
low.
One of the difficulties of measuring corruption in surveys is that questions about
corrupt behaviour are susceptible to answer bias. Respondents may be reluctant or unwilling
to answer sensitive questions, and if they do, they might not answer truthfully. Using such
distorted, which needs to be controlled for in order to obtain reliable regression results (Coutts
& Jann, 2008; Jensen & Rahman, 2011).
The survey implemented a forced response variant of a random response method,
originally designed to incentivise survey respondents to answer specific sensitive questions
truthfully (Warner, 1965), to identify answer bias. The presently implemented method was
proposed by (Azfar & Murrell, 2009) to capture possible answer bias (see below for a
description in greater detail). It has been used to show that answer bias affects sensitive
questions, particularly referring to corruption and performance (Azfar & Murrell, 2009; Clarke,
2011b, 2012; T. Clausen, Fagerberg, & Gulbrandsen, 2012; Friesenbichler, Clarke, & Wong,
2014; Jensen & Rahman, 2011).
The novelty of this paper is threefold. First, we consider work dedication as an
explanatory factor for reported corruption as a business obstacle. Second, we use the
dataset to construct a variable indicating prior exposure to corruption, which to the
knowledge of the authors is new to the corruption literature. Third, the data offers a bias
control method that has been established in the literature. The bias control method is not
applied directly on the corruption variable, but is used to construct a proxy for external
factors that serve as instrumental variables capturing measurement bias of the variable for
prior exposure to corruption.
Method
That survey covers 588 establishments in Sri Lanka and 1,001 establishments in
Bangladesh. Establishments were selected according to a stratified random sampling
strategy. The stratification considered i) firm size classes (micro: 1-5, small: 6-19, medium:
20-99, large: >99; large firms were oversampled), ii) regions at the district level, and iii) ISIC Rev.
3.1, 2-digit industries. The sample included all manufacturing sectors according to the
classifications of ISIC Rev. 3.1 (group D), construction (group F), Services (groups G and H),
transportation, storage and communications (group I), and Information technology
(sub-sector 72 in group K). Further information about the implementation, the sampling
methodology and the datasets are available from the World Bank on the World Bank’s
Enterprise Survey website.2
The questions were answered by senior officials of the establishment, who could have
been the owner, the CEO or a senior employee. Some surveys were answered by more than
one person. These were excluded from subsequent analysis, leaving a total of 1,737
observations of which 982 were in Bangladesh and 755 in Sri Lanka. Most respondents were
male – only 14.2% in Sri Lanka and 1.5% in Bangladesh were female. In Sri Lanka, 45.8% of the
respondents owned the establishment, 40.6% were CEOs and 13.6% were other senior
employees. In Bangladesh, 24.8% of the respondents were owners, 60% were answered by
CEOs and 15.2% by senior employees.
Dependent variable
The dependent variable is the degree to which corruption is perceived as an obstacle
to their establishment’s operations. The interviewer listed factors that can affect the current
operations. Among other factors, respondents were asked to rate corruption as such an
obstacle. The choices given were No Obstacle, a Minor Obstacle, a Moderate Obstacle, a
Major Obstacle, or a Very Severe Obstacle.
Exposure to corruption
The implemented questionnaire did not contain a direct question whether
respondents have had prior exposure to corruption. We therefore use answers on three
different items to construct a dummy variable indicating respondents’ prior experience with
corruption. These items measure corruption at an increasing degree of sensitivity. Two
questions refer to requests for informal payments and one question concerns the expected
amount of the informal indicating.
The first question was only posed to respondents that were visited by a tax official. It
asked if in any of the inspections or meetings a gift or informal payment was expected or
requested. The second question was posed to respondents that have not been visited by a
tax official. It asked such requests are typically made.
The third, rather general item used to construct the exposure variable asked
respondents to quantify the amount that establishments “like this one pay in informal
payments or gifts to public officials”. The underlying act can refer to various types of
interaction with government officials, such as customs, taxes, licenses, regulations or services.
We assume that respondents who provide figures were actually making informal payments at
For each of these three items we create yes-no variables, which we use to construct a
dummy for exposure to corruption. If a respondent answers any of these three questions with
yes, we label her to have had prior exposure to corruption. Also, labels for missing values were
generated for respondents who did not answer any of these questions. In total 10% of the
respondents indicated to have been exposed to corruption in the one or other way.
Work dedication
To measure work dedication, the survey used a sub-scale of the Utrecht Work
Engagement Scale (Schaufeli, Bakker, & Salanova, 2006). Respondents were asked to answer
how often they experience a given state on a Likert-scale ranging from 1 (never) to 7
(always). For instance, one question of the five-item scale is “I find the work that I do full of
meaning and purpose“. Table 1 lists The internal consistency of this scale was good, with a
Cronbach’s alpha of 0.83.
Table 1 about here
Individual and contextual variables
Position of respondent in firm. These are dummy variables that denote whether the
respondent is the CEO or a senior employee of the firm. The group of firm owners served as
the comparison category.
Gender. A dummy variable denotes a female respondent.
Firm age. This variable is defined as the survey year minus the year the establishment began its operations.
Size. The number of employees in full time equivalents (in nat. logs).
Export. A dummy variable denotes whether firms export either directly or indirectly (i.e., sold
domestically to third party that exports products).
Family business. Constructing an ownership variable would have reduced the sample size
significantly, because ownership information was only available for 498 of the 1,837
observations. However, we were able to construct a dummy denoting if a firm is a family
business, which were identified by the question ‘Does this establishment rely on one or more
family members in decision-making?’. This indicates if firms that are strongly embedded in
Country. A dummy variable denotes firms that are in Sri Lanka.
Industry. A dummy variable denotes manufacturing and trade (retail or wholesale) firms.
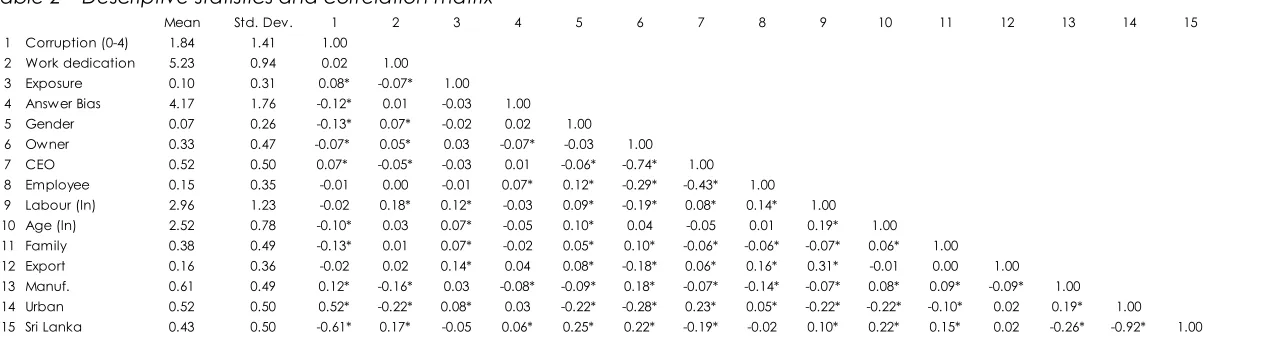
Table 2 about here
Identifying answer bias
We used data from a forced response variant of a random response technique
(Warner, 1965), as proposed by (Azfar & Murrell, 2009) to capture possible answer bias in the
present sample.3
(Azfar & Murrell, 2009) proposed this procedure to identify respondents that did not
answer sensitive questions truthfully. To do so, one needs to specify an “angel assumption”,
describing the situation in which no-one would commit any of the acts in question. Then the
expected number of no’s can be derived from a binomial distribution with seven coin tosses
as the events, a 50% probability of success for each coin toss, and the respective number of
successful cases. Put differently, even if respondents never committed any of the acts
described (and report the outcome of the coin-throw truthfully), they would still report a
number of “yeses” (for the number of heads they throw). The likelihood that not a single head
would show up in seven coin tosses is below one in a hundred (in addition to the likelihood
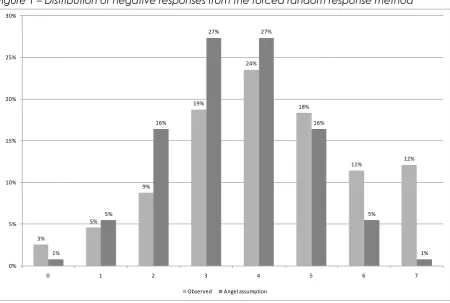
that someone never committed any of these acts). Figure 1 illustrates the distribution of These randomised questions were delivered towards the end of the survey
to reduce the likelihood that answers to other questions are affected. In the present
application, the interviewer asks a respondent ten sensitive questions unrelated to corruption
(e.g., “Have you ever inappropriately hired a staff member for personal reasons?”). The
respondent is asked to toss a coin out of sight of the interviewer. If the coin shows heads the
respondent is required to answer ‘yes’. If the coin shows tails, the respondent is supposed to
answer the question truthfully. If the respondent answers ‘yes’, no one (not even the
interviewer), knows whether the respondent is saying that he or she really committed the
sensitive act or just that the coin showed heads. This is thought to encourage truthful answers
and reduce underreporting of sensitive behaviours (Lensvelt-Mulders, 2005). To give these
respondents a chance to answer ‘yes’ without losing face, three less sensitive random
response questions were included. These were dropped in the present application, so that
the total number of responses used is seven (Azfar & Murrell, 2009).
responses that would occur under the angle assumption and compares it to the actual
distribution of negative responses. As can be seen, 12% of the respondents of the present
sample reported seven no’s, considerably more than would be expected under the angel
assumption. It is therefore likely that some of those respondents did not answer other
questions truthfully (see Figure 1).
Figure 1 about here
Besides following the instructions and answering truthfully, there are several answer
strategies respondents might pursue. For instance, even though the respondent knows that
the interviewer will not know why they are giving a positive answer (either because the coin
showed heads or because they have done the act) some respondents may choose to
answer ‘no’ even when the coin shows heads. In this regard the present data corresponds to
previous findings (Azfar & Murrell, 2009; B. Clausen, Kraay, & Murrell, 2010) that show an
implausibly high number of ‘no’ answers to the sensitive random response questions. If the
questions would have been answered truthfully and if no one has committed any of the
sensitive acts, half of the respondents should answer ‘no’ to the sensitive questions (see Figure
1 for the sum of no’s).
Some respondents may show sophisticated answer behaviour, and seek to avoid long
and unlikely sequences of ‘no’. To give these respondents a chance to answer ‘yes’ without
losing face, three less sensitive random response questions were included. Following (Azfar &
Murrell, 2009), we exclude these questions when calculating the answer bias index. This is
methodologically corroborated by (Edgell, Himmelfarb, & Duchan, 1982) who find that
forced response method work relatively better with moderately sensitive questions to which
most people that are expected to give a positive answer (unreported results, however, show
that including these questions does not qualitatively affect the obtained results).
There may be bias also on the other side of the distribution, i.e. the number of positive
responses. Assuming that respondents answer truthfully, it is likely that some respondents have
committed the sensitive acts. However, some may answer strategically and over-report, i.e.
give positive answers when they should answer no. It is not possible to identify those
less relevant, however. Only few respondents answered all (2.5%), or all but one (4.6%)
questions with a yes.
We use data from the random-response technique to create a variable indicating
“answer bias”. To do so we calculate the sum of negative answers as a measure of the
likelihood that a respondent misreports. In other words, respondents with a higher sum of
negative answers are more likely to show answer bias (Friesenbichler et al., 2014).
Estimation strategy
We use regression analysis to examine how individual characteristics affect reports of
corruption as a factor that hampers businesses operations. The key variables are 1) business
context, 2) job dedication, and 3) prior exposure to corruption. These variables are used in
the first regression. In the second regression, we use the individual characteristics and the
contextual setting as control variables. The next two estimations use the same variables as the
previous ones, but are estimated as ordered logit regressions with robust standard errors. This
method serves as a robustness check that controls for possible distortions of OLS coefficients
due to the data structure. The regression outcome is not continuous, but an ordinal variable
ranging from 0 (no obstacle) to four (severe obstacle).
These regressions control for answer bias that affects the reported severity of
corruption as an obstacle for business operations. However, also the variable that indicates
whether respondents have been exposed to corruption might be distorted. This introduces an
endogeneity problem due to measurement bias, which we seek to control for with an
instrumental variable estimation that can recover causal parameters (Antonakis, Bendahan,
Jacquart, & Lalive, 2010).
The idea is to use an external factor, an instrumental variable, that affects the
endogenous variable (i.e. prior exposure to corruption) but not the dependent variable
‘corruption as an obstacle’. The instrumental variables purge the coefficient of reported
exposure to corruption from possible answer bias. We use a two-stage-least-squares estimator
(2SLS). In the first stage, we predict the values of the endogenous variable using all other
explanatory variables over and above the instrumental variables. In the second stage, we
re-estimate the equation of interest, using the predicted values of the endogenous variable.
How do we identify instrumental variables that affect reported exposure to corruption,
but not corruption as an obstacle? It is likely that the bias is larger for the exposure variable,
While the dependent variable is a general question, the exposure variable concerns the
respondent directly, which is likely to trigger a greater degree of answer bias. This notion is
confirmed by missing values. Survey respondents may choose non-response as an answer
strategy when questions are sensitive(Jensen et al., 2010a). This implies that more sensitive
questions have a higher non-response rate. If both questions were equally sensitive, the share
of missing reports should be the same. However, only 2.46% did not rate the severity of
corruption as an obstacle to their business operations, while 13.07% did not provide sufficient
information to construct the exposure variable. We seek to exploit these differences in the
sensitivity of the underlying questions to construct instrumental variables.
Why can we not simply use the indicator for answer bias from the previous
regressions? One may assume that the indicator for answer bias also affects the endogenous
variable ‘prior exposure to corruption’, perhaps to a different degree. By definition, the
instrumental variable must only affect the endogenous variable and needs to be
independent from the regressand. Hence we cannot simply use the answer bias indicator as
an instrument. While this procedure produces qualitatively comparable results with the
estimation that we ultimately chose, this procedure is indeed rejected by exogeneity tests.4
Hence we use the data generated by random response technique to create two
instrumental variables measuring answer tendencies that do not consider the individual
respondents’ answer. The method therefore shifts the focus from self-reported data towards
contextual factors. It is also conceivable that these external factors also affect the answer
bias. While using the instrumental variables described below on the answer bias indicator is
statistically viable, the results remain qualitatively the same, however.
The first instrument used reflects the interviewer’s influence on respondent’s answering
behaviour. Although the quality of the data ultimately depends on the truthfulness of the
respondent, it also depends on the competence of the interviewer to create an atmosphere
of trust that allows for that. Also, some interviewers may have had respondents that were
systemically more truthful than others (although there is no reason to believe in inter-individual
variations in truthfulness). We are able to identify the respondents interviewed by a specific
interviewer via the interviewer code that is available in the dataset. We then compute
interviewer-level measures of answer bias that is external to the respondent. That is, we
calculate the average number of negative answers that an interviewer obtains, but leave
out the present observation. The data was collected by 114 interviewers who on average
conducted 15.2 interviews, with median of 8.5 interviews and a variance 11.3.
The second instrumental variable captures regional effects. Some regions are likely to
be less reticent than others, reflecting unobserved institutional and cultural differences.
Again, we omit the respondent’s own answer and compute a leave-out-mean of the
negative answers at the regional level. This value does not include the respondent’s answer,
and therefore captures regional characteristics rather than the respondent’s. The dataset
covers a total of 13 regions, of which four were in Bangladesh and nine in Sri Lanka.
If there were no interviewer and region specific effects, there should be no variance
across either dimension. However, both variables show a considerable amount of variance.
The mean of the regional indicator is 4.17, with a standard deviation of 0.50, ranging from
2.44 to 5.47. The mean for the instrument reflecting the interviewer’s competence is 4.17, with
a standard deviation of 0.82, ranging from 1.8 to 7.
Estimation results
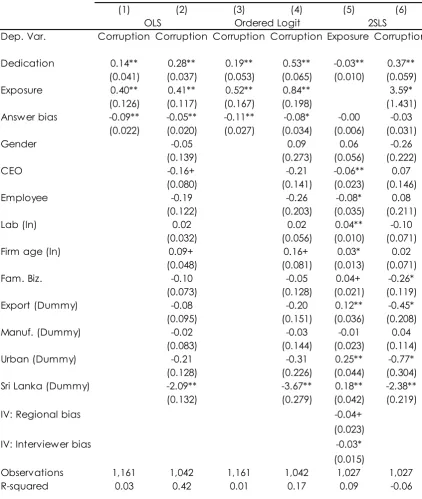
Three different types of regression estimations (OLS, ordered logit and 2SLS) are used to
examine how individual characteristics and exposure affects reports of corruption as a factor
that hampers businesses operations. All analyses include answer bias as one of the predictor
variables. For both the OLS and the ordered logit regression, we present two specifications.
First we estimate the unconditional effect of job dedication, prior experiences and answer
bias on corruption as a perceived obstacle to business operations. We do not consider the
specific context. In a second regression, we then add control variables, considering the role
of environmental factors. These context variables were also used in the 2SLS regression.
The results from all estimated regressions confirm the notion that more dedicated
respondents are more likely to report corruption as a severe problem. This effect becomes
bigger when the firm and individual level control variables are added. In line with previous
research (Azfar & Murrell, 2009; B. Clausen et al., 2010), we find a negative effect of the
answer bias indicator on corruption reports, suggesting that respondents who are likely to
have an answer bias are less likely to see corruption as an obstacle (see Table 3). Over and
above the respondent’s job dedication and individual answer bias, prior exposure to
obstacle to business operations. The effect for prior exposure is larger than the effects for work
dedication or answer bias.
Table 3 about here
The results for the control variables are in line with our expectations. Respondents in Sri
Lanka were less likely to report corruption as an obstacle than those in Bangladesh. Exporting
firms are associated with perceptions of corruption as a greater obstacle firms that serve only
the local market. Respondents in older firms report corruption as a bigger obstacle.
Compared to owners, CEOs and senior employees perceive corruption as a lesser issue.
Controlling for endogeneity
However, also the variable ‘prior exposure to corruption’ is susceptible to answer bias.
The estimates of the 2SLS regression control for this, using answer tendencies specific to both
region and interviewer as external determinants of the exposure variable. The picture
changes insofar that the coefficient for prior exposure to corruption now dwarfs the effect of
the other variables. This indicates that individual experiences with corruption shape much of
the corruption data that is available from surveys once answer bias is taken into account.
Both instrumental variables used are statistically significant with negative coefficients, which
again indicate an under-reporting of prior exposure to corruption.
While dedicated managers are less likely to be exposed to corruption, they are more
likely to report corruption as an obstacle. In addition, the coefficient for answer bias in the
second stage regression turns insignificant. This is plausible, since the questions used to
construct the variable exposure are likely to be more sensitive than the general question
about corruption as a business obstacle. The effect of the re-estimated values of prior
exposure, i.e. the values that have been purged from answer bias, is likely to override the
effect of answer bias that applies to the general question.
The post-estimation statistics confirm the validity of the instrumental variable
regression. We reject the null hypothesis that exposure is exogenous (p-value: 0.003). The
instruments seem to be sufficiently strong, i.e. they affect the endogenous variable. The
instrumental variables used are sufficiently exogenous (p-value: 0.753), i.e. we cannot reject
the null hypothesis that the instruments do not affect the dependent variable.
Interestingly, the effects of some control variables changed in the instrumental variable
approach. For instance, initial results showed that CEOs perceived corruption as a lesser issue.
However, this effect disappeared in the instrumental variable estimation. This indicates that
owners are less likely to be exposed to corruption than others, and once this is controlled for,
the differences in corruption reports between the respondents’ positions in the firm disappear.
The same effect is obtained for firm age – when controlling for exposure, respondents in older
firms are not more likely to report corruption as a larger obstacle. The statistically significant
effects that OLS regressions find vanish once differences in prior exposure to corruption are
being controlled for.
Discussion and conclusions
This paper analysed individual characteristics that may affect reports about the severity
of corruption. While corruption reports have been linked to contextual factors, not all
respondents in corrupt environments engage in corrupt behaviour. We study the effect of
work dedication and prior experiences with corruption on the perception of corruption as an
obstacle to business operations. Since corruption is illegal and might be perceived as
unethical by some respondents, questions about corruption are sensitive. Respondents may
be reluctant or unwilling to answer, and if they do, they might not answer truthfully. Cognisant
of possible answer bias from which sensitive survey questions suffer, we used data from a
random response technique as a control. We used various regression techniques on survey
data provided by the World Bank which was collected in 2011 in Sri Lanka and Bangladesh.
Both countries pose a viable environment to study corruption.
We find that individual as well as context characteristics play a role in how corruption
is perceived, but that prior exposure has the biggest influence. The results indicate that
respondents who are more dedicated to their job criticise corruption as a bigger obstacle
than others. Although giving in to corruption and bribery request might be a way to get things
done and constitute an unethical pro-organisational behaviour in that sense (Umphress et al.,
2010), it is still perceived as an obstacle.
The largest explanatory factor appeared to be past experiences with corruption. We
use of indicator for prior exposure as a predictor of the attitude towards corruption, which
differs from previous economic corruption literature that considers answer bias, but treats
these two factors as independent from each other. According to social-psychological
understanding this assumption would not be correct. Rather, exposure and experience with
certain behaviours is likely to have a major influence on people’s attitude towards them. Our
results confirm this - prior exposure increases the perception of corruption as an obstacle to operations. Although previous findings (Lee & Guven, 2013) indicate that in cultures with more
exposure to corruption paying bribes is generally perceived as more justified, we find that
even if corruption in a country is high, it is still perceived as an obstacle, even more so if
people are more exposed to it.
This study therefore not only adds to economic corruption literature by considering
prior exposure to corruption, but adds to previous research on exposure to corruption (Lee &
Guven, 2013) by controlling for possible answer bias. This answer bias might come from issues
concerning measuring corruption. Possible bias affects both ‘corruption as an obstacle to
business operations’ and ‘exposure to corruption’. Corruption is likely to be underreported,
because people might be hesitant to admit that they have been exposed to a bribery
request, or are familiar with corruption at all (Kundt, Misch, & Nerré, 2013).
To control for answer bias, the survey employed a randomised response technique
that allowed us to identify records with a likely answer bias. We constructed an indicator that
controlled for answer bias in the reports about the severity of corruption as an obstacle to
business operations. The results confirmed previous findings that corruption is on average
underreported. However, also the explanatory variable that measures prior exposure to
corruption might suffer from an answer bias, which leads to statistical challenges. We
implemented a 2SLS regression to purge the coefficient for previous exposure from possible
bias over and above answer bias that affected the attitudes about corruption itself.
By definition, instrumental variables need to be uncorrelated with the dependent
variable (perceptions of corruption as an obstacle), but determine the endogenous variable
(reported prior exposure to corruption). However, both of these variables are likely to be
affected by an answer bias, which was empirically approximated by the indicator based on
the random response technique. To identify a viable instrumentation strategy, we draw on
differences in the sensitivity of the underlying questions. Prior exposure possibly concerns
sensitive, personal behaviour. Hence it seems that ‘prior exposure’ is more susceptible to
operations’. Exploring these differences to control for endogeneity issues, we argued that the
competences of interviewers and regional response characteristics identify differences in the
answer bias itself. This causes non-random measurement error and results in an endogeneity
problem. In a 2SLS regression, we used leave-out-averages of the answer bias indicator at the
interviewer and the regional level as instrumental variables. After controlling for answer bias in
the variable ‘prior exposure to corruption’, its effect becomes much larger, and also
over-rides the effect for answer bias concerning the dependent variable.
The 2SLS shows the relationship of work dedication with both exposure to corruption
and reports of corruption as an obstacle. Dedicated managers are less likely to be exposed
to corruption, which may suggest that they are less likely to pay bribes. At the same time,
they are more likely to report corruption as an obstacle. This may suggest that more
dedicated managers are less likely to volunteer bribes, and might be more concerned about
the consequences of getting caught. This not only shows that corruption is a problem to both
firms that pay and firms that do not pay bribes, but also contrasts the notion that engaged
managers might not be willing to go the ‘extra mile to get things done’.
Controlling for the context of the interview produced the expected results. Respondents
in Sri Lanka were less likely to report corruption as an obstacle than those in Bangladesh,
which also reflects their respective standing on the 2013 world corruption index by
Transparency International.5
Interestingly, the effects of some control variables changed in the instrumental variable
approach. For instance, initial results showed that CEOs and senior employees perceived
corruption as a lesser issue. However, this effect disappeared in the instrumental variable
estimation. This indicates that owners are more likely to be exposed to corruption than others,
and once this is controlled for, the differences in corruption reports between the respondents’
positions in the firm disappear. The same effect is obtained for firm age – when controlling for
exposure, respondents in older firms are not more likely to report corruption as a larger
obstacle.
Exporting firms are associated with perceptions of corruption as
a greater obstacle than firms that serve only the local market. Respondents in older firms
report corruption as a bigger obstacle.
Certainly, there are also a number of limitations to the present findings. We are aware
that by looking at dedication and exposure as predictors of whether corruption is an
obstacle, we only illuminate cornerstones of a multidimensional process. Still, our study shows
that including aspects such as individual respondent’s attitudes and his or her prior exposure
play an important role in people’s attitudes towards corruption. Future studies might want to
explore the limits and conditions of these relationships. A second limitation of this study
concerns the measurement of corruption as a reported obstacle, which was captured by a
single item measure only. While this allowed for a general estimate of how people think about
the corruption, it does not inform about the specific areas affected by it. A more detailed
enquiry into the multifaceted phenomenon of corruption would be an important way
forward. Eventually, it needs to be pointed out that the present results stem from a single
measurement occasion only. In this sense, conclusions about causality in the present study
cannot be made using differences over time. We confront this limitation by applying
instrumental variable regressions for the relationship between perceived corruption and prior
exposure. In addition, we control for answer bias, and use two different country samples to
illustrate the robustness of our findings.
Practical implications and future research
The finding that prior exposure to corruption affects the perception of corruption as an
obstacle has practical implications. It seems that exposure to corruption is a bigger issue than
a straightforward analysis of survey data would suggest. Respondents underreport corruption,
especially exposure to it, to a substantial degree, thereby generating bias in the corruption
data. The reported randomised response technique might be one way to control for that.
Respondents that report not being exposed to corruption perceive corruption as a less severe
obstacle. This might indicate that non-exposure leads to an unrealistically low perception of
corruption as an obstacle for the overall economy.
In addition, the results show that corruption seems to be a large obstacle for those
who are highly dedicated to their job. Given that dedication is indicative for individual and
business performance, it is conceivable that corruption seems to asymmetrically affect firms
with more productive, growth oriented firms affected more than others. Those firms might
benefit most from action undertake towards reducing corruption.
Our findings are also relevant to other researchers interested in survey data on sensitive
issues. In the present article, we illustrate how answer biases on sensitive issues can be
detected and then used to control for endogeneity issues stemming from measurement errors
affecting the sensitive variable of interest - in our case, ‘prior exposure to corruption’. The idea
a more reliable estimate of corruption as a perceived obstacle. The more exposure in the
past, the higher corruption as a perceived obstacle becomes. This finding points at a
self-enforcing process. However, similar feedback effects are conceivable for work attitudes. The
present results from the instrumental variable regression point into this direction. While job
dedication is negatively related to exposure to corruption in the first stage, it remains
positively associated with the perception of corruption as an obstacle in the second stage.
We hope our contribution encourages researchers to study the repeated effect of corruption
on work attitudes over time.
Acknowledgements
The data used in this paper are from the World Bank Enterprise Surveys for Sri Lanka and
Bangladesh [Enterprise Surveys (http://www.enterprisesurveys.org), The World Bank]. We
would like to thank John Antonakis, Jeremy Dawson, Chris Stride, Peter Warr and Michael
Wong for helpful discussions and comments. Responsibility for all errors, omissions, and
opinions rests solely with the authors.
References
Antonakis, J., Bendahan, S., Jacquart, P., and Lalive, R. (2010). On making causal claims: A review and recommendations. Leadersh. Q. 21, 1086–1120.
Azfar, O., and Murrell, P. (2009). Identifying Reticent Respondents: Assessing the Quality of Survey Data on Corruption and Values. Econ. Dev. Cult. Change 57, 387–411.
Bendahan, S., Zehnder, C., Pralong, F.P., and Antonakis, J. (2014). Leader corruption depends on power and testosterone. Leadersh. Q.
Christian, M.S., Garza, A.S., and Slaughter, J.E. (2011). Work engagement: A quantitative review and test of its relations with task and contextual performance. Pers. Psychol. 64, 89– 136.
Clarke, G.R.G. (2011a). How Petty is Petty Corruption? Evidence from Firm Surveys in Africa. World Dev. 39, 1122–1132.
Clarke, G.R.G. (2011b). Lying about firm performance: Evidence from a survey in Nigeria.
Clarke, G.R.G. (2012). Do reticent managers lie during firm surveys? Available SSRN 2028725.
Clausen, T., Fagerberg, J., and Gulbrandsen, M. (2012). Mobilizing for change: A study of research units in emerging scientific fields. Res. Policy 41, 1249–1261.
Coutts, E., and Jann, B. (2008). Sensitive Questions in Online Surveys: Experimental Results for the Randomized Response Technique (RRT) and the Unmatched Count Technique (UCT).
Edgell, S.E., Himmelfarb, S., and Duchan, K.L. (1982). Validity of Forced Responses in a Randomized Response Model. Sociol. Methods Res. 11, 89–100.
Elbahnasawy, N.G., and Revier, C.F. (2012). The Determinants of Corruption: Cross-Country-Panel-Data Analysis: The Determinants of Corruption. Dev. Econ. 50, 311–333.
Friesenbichler, K.S., Clarke, G., and Wong, M. (2014). Price competition and market transparency: evidence from a random response technique. Empirica 41, 5–21.
Harter, J.K., Schmidt, F.L., and Hayes, T.L. (2002). Business-unit-level relationship between employee satisfaction, employee engagement, and business outcomes: A meta-analysis. J. Appl. Psychol. 87, 268–279.
Holland, R.W., Verplanken, B., and Van Knippenberg, A. (2002). On the nature of attitude-behavior relations: the strong guide, the weak follow. Eur. J. Soc. Psychol. 32, 869–876.
Jain, A.K. (2002). Corruption: A Review. J. Econ. Surv. 15, 71–121.
Jensen, N.M., and Rahman, A. (2011). The Silence of Corruption. Identifying Underreporting of Business Corruption through Randomized Response Techniques. Policy Res. Work. Pap. 5696, 1–36.
Jensen, N.M., Li, Q., and Rahman, A. (2010). Understanding corruption and firm responses in cross-national firm-level surveys. J. Int. Bus. Stud. 41, 1481–1504.
Kahn, W.A. (1990). Psychological Conditions of Personal Engagement and Disengagement at Work. Acad. Manage. J. 33, 692–724.
Kish-Gephart, J.J., Harrison, D.A., and Treviño, L.K. (2010). Bad apples, bad cases, and bad barrels: Meta-analytic evidence about sources of unethical decisions at work. J. Appl. Psychol. 95, 1–31.
Kundt, T.C., Misch, F., and Nerré, B. (2013). Re-Assessing the Merits of Measuring Tax Evasions through Surveys: Evidence from Serbian Firms. ZEW Discuss. Pap. 1–31.
Lee, W.-S., and Guven, C. (2013). Engaging in corruption: The influence of cultural values and contagion effects at the microlevel. J. Econ. Psychol. 39, 287–300.
Lensvelt-Mulders, G.J.L.M. (2005). Meta-Analysis of Randomized Response Research: Thirty-Five Years of Validation. Sociol. Methods Res. 33, 319–348.
Schaufeli, W.B., Bakker, A.B., and Salanova, M. (2006). The Measurement of Work
Engagement With a Short Questionnaire: A Cross-National Study. Educ. Psychol. Meas. 66, 701–716.
Serra, D. (2006). Empirical determinants of corruption: A sensitivity analysis. Public Choice 126, 225–256.
Svensson, J. (2003). Who must pay bribes and how much? Evidence from a cross section of firms. Q. J. Econ. 207–230.
Thau, S., Derfler-Rozin, R., Pitesa, M., Mitchell, M.S., and Pillutla, M.M. (2014). Unethical for the sake of the group: Risk of social exclusion and pro-group unethical behavior. J. Appl. Psychol.
Umphress, E.E., Bingham, J.B., and Mitchell, M.S. (2010). Unethical behavior in the name of the company: The moderating effect of organizational identification and positive reciprocity beliefs on unethical pro-organizational behavior. J. Appl. Psychol. 95, 769–780.
Warner, S.L. (1965). Randomized Response: A Survey Technique for Eliminating Evasive Answer Bias. J. Am. Stat. Assoc. 60, 63–69.
Xanthopoulou, D., Bakker, A.B., Demerouti, E., and Schaufeli, W.B. (2009). Work engagement and financial returns: A diary study on the role of job and personal resources. J. Occup. Organ. Psychol. 82, 183–200.
Table 1 – Work dedication scale
Note: This table provides the descriptive statistics for the questions used in the Utrecht work engagement scale (Schaufeli et al., 2006), own calculations.
Question Mean Std. Dev.
I find the work that I do full of meaning and purpose. 5.59 1.18
I am enthusiastic about my job. 5.35 1.15
My job inspires me. 5.22 1.18
I am proud of the work that I do. 5.22 1.20
Note: This table provides the descriptive statistics for the variables used. Gender, owner, CEO, employee, family business, export, manufacturing, urban and Sri Lanka are dichotomous; * p<0.05
[image:26.842.118.758.82.253.2]Note: This table shows the regression results for the reported severity of corruption. The first two columns show OLS results, and columns (3) and (4) show results for the ordered logit regression. Both methods have been estimated with and without control variables. Column (5) and (6) show the results for the 2SLS estimation. Robust standard errors are reported in parentheses; ** p<0.01, * p<0.05, + p<0.1; Constants are not reported; Pseudo R² for ordered logit regressions; centred R² for 2SLS regressions.
Dedication 0.14** 0.28** 0.19** 0.53** -0.03** 0.37** (0.041) (0.037) (0.053) (0.065) (0.010) (0.059)
Exposure 0.40** 0.41** 0.52** 0.84** 3.59*
(0.126) (0.117) (0.167) (0.198) (1.431) Answer bias -0.09** -0.05** -0.11** -0.08* -0.00 -0.03
(0.022) (0.020) (0.027) (0.034) (0.006) (0.031)
Gender -0.05 0.09 0.06 -0.26
(0.139) (0.273) (0.056) (0.222)
CEO -0.16+ -0.21 -0.06** 0.07
(0.080) (0.141) (0.023) (0.146)
Employee -0.19 -0.26 -0.08* 0.08
(0.122) (0.203) (0.035) (0.211)
Lab (ln) 0.02 0.02 0.04** -0.10
(0.032) (0.056) (0.010) (0.071)
Firm age (ln) 0.09+ 0.16+ 0.03* 0.02
(0.048) (0.081) (0.013) (0.071)
Fam. Biz. -0.10 -0.05 0.04+ -0.26*
(0.073) (0.128) (0.021) (0.119)
Export (Dummy) -0.08 -0.20 0.12** -0.45*
(0.095) (0.151) (0.036) (0.208)
Manuf. (Dummy) -0.02 -0.03 -0.01 0.04
(0.083) (0.144) (0.023) (0.114)
Urban (Dummy) -0.21 -0.31 0.25** -0.77*
(0.128) (0.226) (0.044) (0.304)
Sri Lanka (Dummy) -2.09** -3.67** 0.18** -2.38**
(0.132) (0.279) (0.042) (0.219)
IV: Regional bias -0.04+
(0.023)
IV: Interviewer bias -0.03*
(0.015)
Observations 1,161 1,042 1,161 1,042 1,027 1,027
[image:27.595.74.497.129.629.2]
Figure 1 – Distribution of negative responses from the forced random response method
Note: This figure shows the observed distribution of negative responses and the distribution
that would have been expected according to the angel assumption (people have not
committed these acts).
3%
5%
9%
19%
24%
18%
11% 12%
1%
5%
16%
27% 27%
16%
5%
1%
0% 5% 10% 15% 20% 25% 30%
0 1 2 3 4 5 6 7