Electromagnetic Nondestructive Evaluation of Graphite Structures
in Flake Graphite Cast Iron
*Tetsuya Uchimoto, Toshiyuki Takagi and Toshihiko Abe
Institute of Fluid Science, Tohoku University, Sendai 980-8577, JapanThis paper discusses the feasibility of characterizing the shape and size of graphite in flake graphite cast iron based on electromagnetic nondestructive methods. Several flake graphite cast iron specimens containing graphite of various shapes and sizes were prepared and their electromagnetic properties such as conductivity and relative permeability were evaluated systematically. Both the conductivity and the relative permeability were found to mainly depend on the shape and size of graphite. The conductivity was specifically found to have a good correlation with the shape and size of graphite and this was independent of the pearlite area fraction of matrix. The conductivity also correlates well to the ultrasonic velocity which indicates the amount and size of the graphite. The DC potential drop method was used to evaluate the structure of graphite and its capability was evaluated. [doi:10.2320/matertrans.F-M2010809]
(Received April 24, 2009; Accepted February 5, 2010; Published April 15, 2010)
Keywords: flake graphite cast iron, graphite structure, graphite shape, matrix structure, nondestructive evaluation, potential drop method, conductivity, magnetic properties, ultrasonic velocity
1. Introduction
Flake graphite cast iron is used as mechanical components in bearings and brake shoes etc. because of their high wear resistance and damping properties. Flake graphite cast iron is an ideal material for automobile brake disks since it has excellent damping properties because of the flaky graphite. Therefore, controlling the graphite structure is highly desirable before producing brake disks. A basic ultrasonic technique to evaluate the structure of graphite has been established.1–4) However, this nondestructive method
re-quires two parallel planes for each target specimen to evaluate the ultrasonic velocity and it can only be applied with difficulty to specimens with a complicated outline.
Graphite and other structures composing the cast iron matrices may be evaluated using electromagnetic properties such as conductivity and permeability.5) Some works have
been carried out to estimate the hardness and the fraction of ferrite to pearlite in ductile cast iron using electromagnetic nondestructive evaluation methods. It has been reported that the eddy current method and the magnetic adoptive method are highly accurate for the evaluation of ductile cast iron matrices.6–9) The graphite flakes in flake graphite cast iron have varied morphology since the flakes have complicated structures and are linked to each other. The relationship between graphite structure and its electromagnetic properties has not been systematically investigated.
With regards to the background described above, this paper discusses the feasibility of characterizing the graphite structures in flake graphite cast iron based on electromagnetic nondestructive evaluation methods. Therefore, several flake graphite cast iron materials with various graphite structures and matrices were prepared and their conductivities and magnetic properties were measured and evaluated system-atically. We used the DC potential drop method to investigate
the electromagnetic properties and applied this method to the evaluation of graphite’s shape and size and we discuss its capability.
2. Experimental Procedures
2.1 Materials
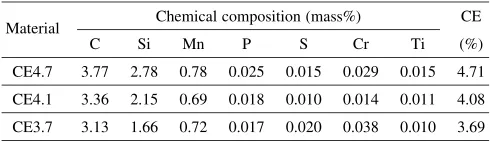
Three flake graphite cast iron materials with chemical compositions listed in Table 1 were prepared. Their carbon equivalent (CE) values were defined by:
CE¼mass%Cþ1
3ðmass%Siþmass%PÞ ð1Þ
and were controlled to produce various graphite shapes and sizes. These metals were designated CE4.7, CE4.1 and CE3.7 based on their targeted CE values. Pig iron (4.09%C, 0.89%Si, 0.07%Mn, 0.019%P, 0.012%S, 0.016%Cr, 0.003%Ti), ferrosilicon (Fe-75%Si), electrolytic iron and electrolytic manganese were used as raw materials and were melted using a high frequency induction melting furnace at 1743 K. Ferrosilicon (Fe-75%Si) was also used as an inoculant. The melts were poured into moulds made by the CO2gas process to produce the columnar bars with a length
[image:1.595.304.549.349.420.2]of 60 mm and a diameter of 46 mm. After each bar was cut into disks 10 mm thick, the disks were subjected to two kinds of heat treatments: annealing (AN) to obtain a ferrite based matrix and normalizing (NR) to obtain a pearlite based matrix. To treat these annealed and normalized disks, they were heated at 1123 K in a furnace for one hour and then
Table 1 Chemical composition of materials.
Material Chemical composition (mass%) CE
C Si Mn P S Cr Ti (%)
CE4.7 3.77 2.78 0.78 0.025 0.015 0.029 0.015 4.71 CE4.1 3.36 2.15 0.69 0.018 0.010 0.014 0.011 4.08 CE3.7 3.13 1.66 0.72 0.017 0.020 0.038 0.010 3.69
*This Paper was Originally Published in Japanese in J. JFS80(2008) 213–
218.
either cooled in the furnace or in air for AN and NR, respectively. These as-cast, normalized and annealed materi-als were designated AS, NR and AN, respectively. We thus produced 9 flake graphite cast iron materials with various matrices and graphite shapes as shown in Table 2.
[image:2.595.314.528.75.233.2]After grinding the specimen surfaces, their Brinell hard-ness HB (HBW 10/3000) was measured and is listed in Table 2. These hardness values indicate that the normalizing and annealing treatments were successful in producing the pearlitic and ferritic matrices, respectively.
2.2 Measurement of ultrasonic velocity
Both parallel surfaces of the disk specimen (10 mm thick) were polished well using a milling attachment and a 5 MHz broadband ultrasonic transducer was placed on one surface with coupling medium of machine oil. The ultrasonic velocity was evaluated by measuring the round-trip traveling time of the pulse between the two parallel surfaces using an oscilloscope.
2.3 Measurement of conductivity
The conductivity was measured by the DC four-terminal method. A schematic drawing of the experimental setup is shown in Fig. 1. The specimens were machined into columnar rods with a diameter of 3 mm and a length of 30 mm. A DC current of 1 A was provided using a bipolar power supply to both ends of the specimen. Voltage terminals were positioned on the side surfaces of the specimen at intervals of 2.5 mm and the voltage was measured using a digital multi-meter.
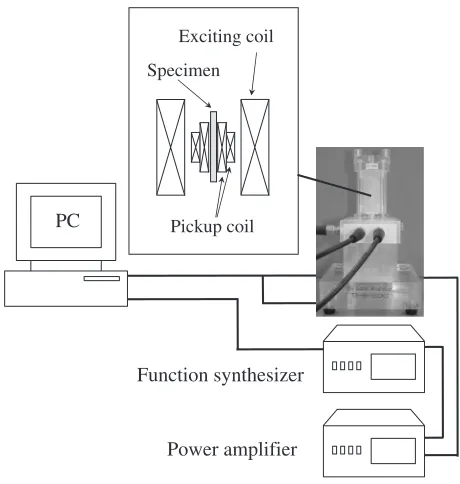
2.4 Evaluation of magnetic properties
ABHloop tracer, as shown in Fig. 2, was used to evaluate the magnetic properties of the specimens. This equipment consists of a function generator, a power amplifier and two solenoids (pickup and exciting coils). The columnar rod specimens used for the conductivity measurements were also used for these measurements. The specimens were magnetized by the coaxial exciting coil and the magnet-ization was evaluated by the voltage induced in the pickup coil. Finally, B-H curves were plotted by taking demag-netization factors into consideration. The test frequency and the maximum applied field were 10 Hz and 80 kA/m, respectively.
3. Results and Discussion
3.1 Graphite structure and ultrasonic velocity
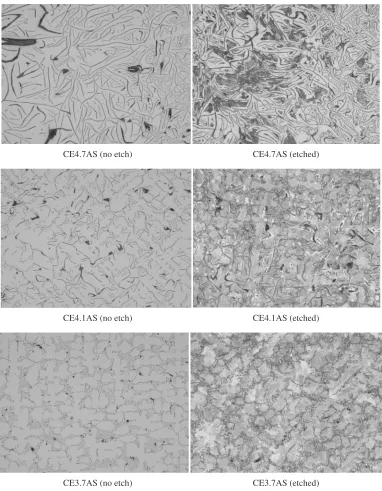
The metallographic examination of the graphite structures and the matrix structures were done according to ISO 945. Microphotographs of the three materials in their as-cast condition are shown in Fig. 3. The graphite flakes of CE4.7AS are comparatively longer and they are uniformly and isotropically distributed and are thus categorized as type B flakes. CE4.1AS has smaller graphite flakes than CE4.7AS and they are categorized as type A flakes. In CE3.7AS, very small eutectic graphite flakes were found to be distributed in the dendrite and they are categorized as type D and E flakes. The microphotographs, after etching with 3% Nital, indicate that CE4.7AS has a pearlite-ferrite matrix and CE3.7 has a completely pearlitic matrix. CE4.1 mainly has a pearlitic matrix but a small amount of ferrite surrounds the graphite flakes. These matrix observations are consistent with the hardness listed in Table 2.
CE4.1AS CE4.1 NA (As-cast) 183
CE4.1AN CE4.1 850C1 h, furnace cooling 110 CE4.1NR CE4.1 850C1 h, air cooling 209
CE3.7AS CE3.7 NA (As-cast) 207
CE3.7AN CE3.7 850C1 h, furnace cooling 130 CE3.7NR CE3.7 850C1 h, air cooling 221
Bipolar power supply
Digital multi-meter
Fig. 1 Experimental setup for conductivity measurement with DC four-terminal method.
Function synthesizer PC
Power amplifier Pickup coil Specimen
Exciting coil
[image:2.595.46.291.84.234.2] [image:2.595.311.541.281.523.2]The area fraction and average length of graphite flakes were evaluated using an image processing software. The area fraction of graphite was evaluated using microphoto-graph binary images of 5 fields at the same magnification as those in Fig. 3. The length of graphite is defined as the average diameter of the minimum circle circumscribing each graphite flake larger than 5mm. The area fraction of graphite for CE4.7AS, CE4.1AS and CE3.7AS is 17.8, 12.6 and 10.0%, respectively. The length of the graphite flakes for CE4.7AS, CE4.1AS and CE3.7AS is 67, 39 and 28mm, respectively.
The ultrasonic velocity of each material was measured by the method described in section 2.2. Figure 4 shows the
ultrasonic velocity for the as-cast materials as a function of the graphite area fraction and length, respectively. The ultrasonic velocity depends on the area fraction and length of graphite. In the reference,3) a model for the ultrasonic
velocity of flake graphite cast iron was discussed based on the effective cross-section area fraction of the matrix which is related to the total projected area of the graphite flakes in the stress direction. Based on this model, the ultrasonic velocity should decrease with an increase in the amount of graphite and/or graphite length. This model is consistent with the relation shown in Fig. 4. Hereafter, the graphite structure of the materials will be quantitatively discussed with regards to the ultrasonic velocity.
CE4.7AS (no etch) CE4.7AS (etched)
CE4.1AS (no etch) CE4.1AS (etched)
CE3.7AS (no etch) CE3.7AS (etched)
200 µm
[image:3.595.107.489.69.560.2]3.2 Conductivity
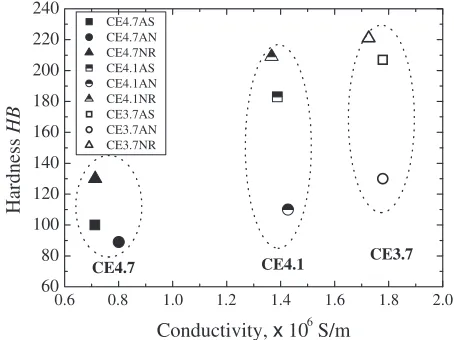
Figure 5 shows the relationship between the conductivity and the hardness. Considering each set of materials, CE4.7, CE4.1 and CE3.7, the dependence of conductivity on hardness or matrix is very small. For CE4.7, the conductivity increased slightly after annealing. For CE4.1 and CE3.7, the conductivity decreased slightly after normalizing. On the other hand, the change in conductivity after a change in the graphite structure is very large since the conductivity differences among CE4.7, CE4.1 and CE3.7 are clear as shown in Fig. 5. Therefore, the conductivity of flake graphite cast iron materials depends on their graphite structures far more than on their matrix structures.
Figure 6 shows the conductivity of all specimens as a function of the ultrasonic velocity. The previous studies reported that the ultrasonic velocity of flake graphite cast iron materials decreases with an increase in the graphite content and it decreases after heat treatment as well.3,4)The ultrasonic velocity results in Fig. 6 show a similar tendency to that observed in the previous work. It should be noted that the conductivity is clearly different among CE3.7, CE4.1 and CE4.7 but the difference in ultrasonic velocity among CE3.7 and CE4.1 is not clear, as shown in Fig. 6. Therefore, the
conductivity mainly depends on the content and size of the graphite and is independent of the matrix, which implies that the structure of graphite may be evaluated by measuring conductivity.
In the case of ductile cast iron, the conductivity correlates to the matrix and is independent of the shape and number of graphite nodules and this behavior is contrary to the case of flake graphite cast iron discussed above.10) In general, the conductivity of the matrix is much larger than that of graphite. In the case of ductile cast iron, the graphite nodules are located apart from each other and the electric current mainly flows through the matrix. Therefore, the macroscopic conductivity of ductile cast iron is mainly affected by the matrix structure rather than the graphite structures. However, in the case of flake graphite cast iron, the graphite flakes link in a complicated manner to each other and the electric current passes through the graphite flakes whose conductivity is much lower than that of matrix. A change in the graphite structure, as is the case in this study, results in a relatively larger effect on the conductivity of the cast iron. This difference in the current flow medium is considered to be the main reason for the flake graphite cast iron showing different behaviors with regards to the graphite structure and the macroscopic conductivity compared with the ductile cast iron.
3.3 Relative permeability
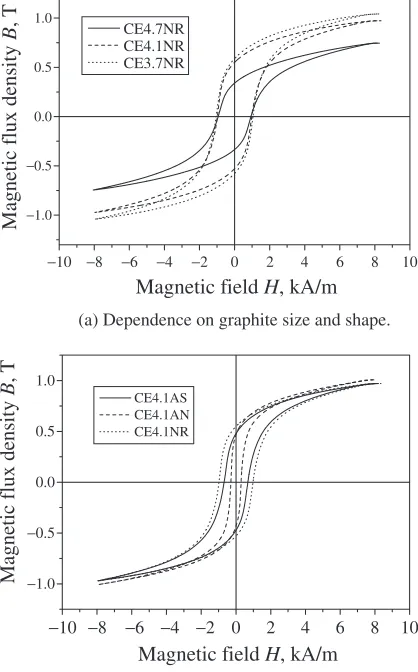
Magnetization curves were measured at a field amplitude of 8.0 kA/m and a frequency of 10 Hz. Figure 7 shows the different magnetization curves for the materials. In Fig. 7(a), magnetization curves of the specimens with pearlitic matrices (CE4.7NR, CE4.1NR and CE3.7NR) are plotted to determine the dependence on the graphite structure. Although the coercivity does not depend on the graphite structure, the remanence and magnetic flux density at the maximum fields change according to the graphite structure. In Fig. 7(b), the magnetization curves of the specimens with the same CE values (CE4.1AS, CE4.1NR and CE4.1AN) are plotted to determine their dependence on the matrix. The change in coercivity caused by a change in the matrix is larger than that for the remanence and the magnetic flux density at the maximum field. The reference11)discusses the 4.0
4.5
0 20 40 60 80
Graphite length
Graphite length, µm Ultrasonic velocity, km/s CE4.7AS
Graphite area fraction
Fig. 4 Relationship between ultrasonic velocity and graphite parameters.
0.6 0.8 1.0 1.2 1.4 1.6 1.8 2.0 60
80 100 120 140 160 180 200 220 240
CE3.7 CE4.1
CE4.7
Hardness
HB
Conductivity, x 106 S/m
CE4.7AS CE4.7AN CE4.7NR CE4.1AS CE4.1AN CE4.1NR CE3.7AS CE3.7AN CE3.7NR
Fig. 5 Relationship between conductivity and Brinell hardness.
3.0 3.5 4.0 4.5 5.0 5.5
0.6 0.8 1.0 1.2
Conductivity,
Ultrasonic velocity, km/s
CE3.7NR [image:4.595.315.538.75.242.2] [image:4.595.65.281.75.254.2] [image:4.595.55.282.301.471.2]magnetic properties of cast iron with different matrices and graphite structures from flaky to spheroidal graphite. The results of a principal component analysis for all samples indicate that the coercivity depends on the matrix rather than on the graphite structure and the flux density at high field (31.8 kA/m) depends on the graphite structure. This is very consistent with the results shown in Fig. 7.
In this study, we used the relative permeability, ¼
B=ð0HÞ at a magnetic field of 8 kA/m, where B is the
magnetic flux density,0the permeability of free space and
H the magnetic field. Figure 8 shows the relationship between the relative permeability and the ultrasonic velocity. The relative permeability as well as the conductivity correlates well to the ultrasonic velocity which reflects the size and content of graphite flake. However, in each set of materials the relative permeability changes slightly by heat treatments compared with the conductivity, which implies that the permeability has a small dependence on the matrix.
4. Application of the Potential Drop Method
This investigation on the electromagnetic properties of flake graphite cast iron showed that the graphite structure dominates the electromagnetic properties. Especially, the conductivity correlates well to the graphite structure and is independent of the matrix. Based on this finding, the DC
[image:5.595.317.537.73.240.2]potential drop method was used to evaluate the graphite structure. The experimental setup is shown in Fig. 9. The probe consists of four needles; the two outer needles at intervals of 25 mm are current terminals and the two inner needles at intervals of 15 mm are the voltage terminals. Each needle is attached to a spring so that all needles can contact the target surfaces at the same pressure. The 3 A of DC current was fed to the current terminals in this study.
Figure 10 shows the relationship between measured voltage and ultrasonic velocity. As was the case for the conductivity measurements, the potential drop of the probe
−10 −8 −6 −4 −2 0 2 4 6 8 10
−1.0
−0.5 0.0 0.5 1.0
Magnetic flux density
B
, T
Magnetic field H, kA/m
CE4.7NR CE4.1NR CE3.7NR
(a) Dependence on graphite size and shape.
−10 −8 −6 −4 −2 0 2 4 6 8 10 −1.0
−0.5 0.0 0.5 1.0
Magnetic flux density
B
, T
Magnetic field H, kA/m
CE4.1AS CE4.1AN CE4.1NR
(b) Dependence on matrices.
Fig. 7 Magnetization curves at frequency of 10 Hz.
3.0 3.5 4.0 4.5 5.0 5.5
65 70 75 80 85 90 95 100 105 110 115 120
Relative permeability
µ
Ultrasonic velocity, km/s
CE4.7AS CE4.7AN CE4.7NR CE4.1AS CE4.1AN CE4.1NR CE3.7AS CE3.7AN CE3.7NR
Fig. 8 Relationship between relative permeability and ultrasonic velocity.
Digital multi-meter
5mm 15mm 5mm Terminal
Bipolar power supply
Fig. 9 Experimental setup for DC potential drop method.
3.0 3.5 4.0 4.5 5.0 5.5 6.0 0.00
0.05 0.10 0.15 0.20
Probe voltage, mV
[image:5.595.65.277.74.230.2]Ultrasonic velocity, km/s
CE4.7AS CE4.7AN CE4.7NR CE4.1AS CE4.1AN CE4.1NR CE3.7AS CE3.7AN CE3.7NR [image:5.595.65.274.80.416.2] [image:5.595.313.544.285.407.2] [image:5.595.316.538.450.617.2]In this study, the feasibility of characterizing graphite structures by considering their shape and size in flake graphite cast iron was studied by evaluating their electro-magnetic properties. Several flake graphite cast iron mate-rials with various graphite structures and matrices were systematically evaluated. The following conclusions are made from this investigation:
(1) The conductivity of flake graphite cast iron materials depends largely on their graphite structure and not so much on their matrix structure. The reason for this is that the graphite flakes with far lower conductivity than the matrices are distributed continuously and stereoscopically within the matrix and the structure of the graphite dominates the macroscopic conductivity of flake graphite cast iron materials.
(2) The permeability of the flake graphite cast iron materials depends mainly on the graphite structure rather than on the matrix. However, the permeability changes slightly accord-ing to the heat treatment procedure.
(3) Both the conductivity and the permeability of as-cast flake graphite cast iron materials correlates well with their ultrasonic velocity which indicates the amount and size of the graphite flakes.
(4) The potential drop of the flake graphite cast iron specimens were measured by the DC potential method. The potential drops correlates well to the ultrasonic velocity with a high coefficient of determination R2 of 0.88, which
Industrial Technology Research Grant Program, ‘‘Character-ization of microstructure of advanced cast iron for energy-saving automobile based on multi-scale electro-magnetic approach’’, 04A48512.
The authors are grateful to Mr. Toshihiko Nozaki of Mitsui Chemicals, Inc. for supporting the experiments in this study. The authors appreciate the large amount of support by Mr. Takeshi Sato, Mr. Tsutomu Watanabe and the technical staff at the Institute of the Fluid Science in processing the specimens prepared in this study.
REFERENCES
1) T. Shiota and S. Komatsu: IMONO44(1972) 492. 2) T. Shiota and S. Komatsu: IMONO47(1975) 409. 3) T. Abe and K. Ikawa: IMONO58(1986) 479. 4) T. Abe and K. Ikawa: IMONO57(1985) 704. 5) A. B. Everst: Foundry Trade J.89(1950) 57.
6) T. Abe, T. Uchimoto, T. Takagi and S. Tada: J. JFS75(2003) 675. 7) M. Kurosawa, T. Uchimoto, T. Abe, T. Takagi, T. Sato, H. Kage and T.
Noguchi: J. JFS77(2005) 826.
8) T. Uchimoto, T. Takagi, S. Konoplyuk, T. Abe, H. Huang and M. Kurosawa: J. Magn. Magn. Mater.258–259(2003) 493.
9) G. Vertesy, T. Uchimoto, T. Takagi, I. Tomas, O. Stupakov, I. Meszaros and J. Pavo: Physica B372(2006) 156.
10) T. Uchimoto, T. Takagi, M. Kurosawa, S. Konoplyuk and T. Abe: Studies in Applied Electromagnetics and Mechanics 24: Electro-magnetic Nondestructive Evaluation (VIII), ed. by T. Sollier, D. Pre´mel and D. Lesselier, (IOS Press, 2004) pp. 159–165.