Simultaneous Determination of Interfacial Friction and Flow Curves of Temperature
and Rate Dependent Materials for Bulk Metal Forming Processes
Faramarz Fereshteh-Saniee
+and S. Mahmoud Pezeshki
Mechanical Engineering Department, Faculty of Engineering, Bu-Ali Sina University, Hamedan, Iran
This paper is concerned with application of the ring test to temperature and rate dependent materials. With this regard, the stressstrain response of AZ80 magnesium alloy was obtained for various temperatures, strains and strain rates by means of this experiment. Usingfinite element (FE) simulations, numerical sigmoid curves and calibration curves of the ring compression test were also determined. Moreover, the effects of temperature and deformation rate on the geometry of the numerical sigmoid curves were evaluated. By comparing the load-displacement curves obtained from the FE analyses with those of the experiments, it was found that the numerical sigmoid curves, compared with analytical ones, provided more accurateflow curves. Furthermore, the influences of the temperature and strain rate on the shape of the sigmoid curves were more perceptible at higher levels of friction. [doi:10.2320/matertrans.M2011246]
(Received August 11, 2011; Accepted October 24, 2011; Published December 14, 2011)
Keywords: ring compression test,flow curve, friction, sigmoid curve, bulk metal forming, magnesium alloy
1. Introduction
Knowing accurate stressstrain curves of various materials is essential for almost all of the solid mechanics and metal forming studies. There are different test methods for evaluation of theflow behavior of the materials such as the tensile test, the compression test and the torsion test. Many engineering structures and metal forming operations are subjected to compressive state of stress. Therefore, analysis of these structures or processes requires knowledge of compressive stressstrain response of the materials. The cylindrical compression test is a common method for determination of compressive flow curves. However, this experiment has inevitable drawback of contributing friction to the test results. On the other hand, in a ring compression test, there is a relatively exact estimation of the frictional condition. Therefore, this experiment is not only suitable for evaluation of the interfacial friction, but also is an appropriate test for derivation of theflow curve of the material, specially for bulk metal forming operations and various process conditions.1)
The ring compression test is performed using a short ring-shaped sample forged axially between two flat and parallel platens. The inner diameter of the ring may decrease, increase or remain constant, depending on the interfacial friction condition. For low levels of friction, as the height decreases, both the inside and outside diameters of the ring increase.2)
The internal diameter will decrease if the friction is large (Fig. 1). Buchneret al.claimed that theflow stress obtained from the ring test was suitable for studying the forging and similar processes because there was a similar deformation region in this experiment.3) The ring test, which has been classified as an indirect test for evaluation of friction, is easy to perform and represents the conditions of a real process very well.
In a ring test, the friction coefficient is derived from calibration curves, which are plots of percentage reduction
in internal diameter against that in height. These curves could be obtained analytically or numerically. Theflow stress of the material could also be extracted from sigmoid curves of the ring compression test. Normal pressure and geo-metrical changes of the deformed sample are included in such plots.2)These graphs were analytically obtained earlier and are used in this research work for comparison with numerical ones.
Some assumptions such as no strain hardening or soften-ing, no barreling effects, and homogeneous deformation of the ring sample were made for obtaining analytical sigmoid and calibration curves of the ring compression test.1)Later,
these assumptions were doubted by some researchers. In order to examine the validity of the analytical calibration curves of the ring test, Sofuoglu and Rasty carried out several ring tests with white and black Plasticine.4)They found that
using the same analytical calibration curves for both types of Plasticine could result in significant errors. Fereshteh-Saniee
et al. conducted ring compression tests with Plasticine and lead for various frictional conditions.5)They claimed that the material properties of the sample might affect the shape of the calibration curves of the ring compression test. The numerical calibration curves, determined based on the FE simulations, were employed by Shahriari et al. for hot ring compression tests of a superalloy.6)They specified the friction coefficient
for four various frictional conditions (lubricants) at two different temperatures. Some researchers used results of ring compression tests together with the calibration curves
Fig. 1 Flow of material during a ring test with different levels of friction, where the broken lines exhibit the initial shape of the specimen.2)
+Corresponding author, E-mail: ffsaniee@basu.ac.ir or ffsaniee@yahoo. com
[image:1.595.370.483.309.398.2]proposed by Male et al.7) for obtaining friction factor of
extruded AZ31 magnesium alloy at elevated temperatures.8)
They also investigated the effect of tool material interface on frictional characteristics of this alloy. In a similar research work, the friction factor of the oil and MoS2lubricants were
compared for this alloy.9)
It is important to know whether the flow curve of the material affects the geometries of the calibration curves of the ring test. With this regard, it is obvious that the compressive flow curve of the material should be concerned, because some alloys (such as magnesium alloys) represent different behaviors in compression and tension. Fereshteh-Saniee and Fatehi-Sichani conducted the ring and cylindrical compres-sion tests in conjunction with each other.10)They employed
the flow curves obtained by means of the compression tests for determination of the calibration curves of the ring test. The flow curves and the friction coefficient gained via this procedure, resulted in a much more accurate prediction of the load-displacement curve.
For determination of the flow curve of the material, Hwuet al.employed the ring test for estimation of theflow stress of steels at both the room and elevated temperatures.11) They utilized the upper-bound technique for obtaining the calibration curves. It was concluded that the ring compres-sion test was a suitable test for estimation of theflow curve. Cho and Altan used an inverse method with the ring compression test in order to predict the flow stress and friction factor at elevated temperatures.12)They obtained the
values of three parameters involved in the function of the interfacial friction and flow stress by minimizing the differences between the experimental and FEfindings.
In the present study, ring compression tests of AZ80 magnesium alloy were conducted for flow stress estimation as well as friction evaluation for this alloy. This high strength alloy has been categorized as a wrought magnesium alloy and is usually used in various forms such as extruded or forged parts.13) The forged AZ80 magnesium alloy has also been utilized for manufacturing different parts in automotive industries.14)To obtain theflow curve of any alloy by using the ring compression test, it is necessary to employ precise sigmoid curves. For this reason, the numerical sigmoid curves were determined based of the FE simulations of the test. These curves were employed to evaluate theflow curve of AZ80 magnesium alloy. Using theflow curves obtained by this means, the FE simulations were conducted and the resulted force-displacement curves were in good agreement with the experimental ones, specially in comparison with those gained using the analytical sigmoid curves. Moreover, the influences of temperature and strain rate on the geometry of the sigmoid curves were studied and the results and the corresponding discussions and conclusions are reported in this paper.
2. Flow Stress Determination Using the Ring Test
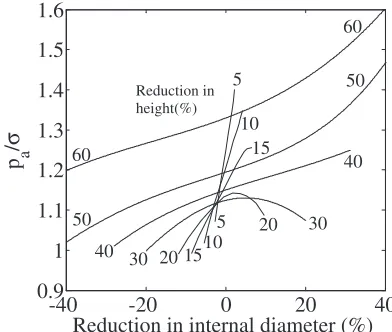
For obtaining the stressstrain curve from the ring compression test, the sigmoid curves should be used. A set of analytical type of these curves is illustrated in Fig. 2. In this figure, pa/· is plotted against percentage reduction in
internal diameter, where pa is the average normal pressure
at the mid-plane of the ring sample and · is theflow stress of the material. By dividing the experimental load (F) by the mid-plane area of the deformed sample (Amid), one can
calculate paas below:
pa¼F=Amid ð1Þ
Therefore, the dimensions of the sample should be measured after the deformation. Having pa and pa/·, the flow stress
could be calculated.2)
The friction coefficient of interfacial surfaces can also be determined from the ring compression test. Calibration curves are used for this purpose. Typical calibration curves are shown in Fig. 3. The initially proposed sigmoid and calibration curves for the ring test have been general and the same for different materials. Hence, the results obtained from these curves could be inappropriate for friction and flow stress evaluation of all the materials. However, these curves could separately be gained for each specific material by using FE simulations, in order to obtain more accurate results.
-401 -20 0 20 40 60
1.2 1.4 1.6 1.8 2 2.2 2.4
5 1015
20 25
30 35
40 45 50 55
60
65
70
Reduction in internal diameter (%) p a
/
σ
Reduction in height (%)
Fig. 2 Analytical sigmoid curves for evaluation offlow stress.2)
0 20 40 60
-40 -20 0 20 40 60 80
0 0.03 0.07 0.1 0.15 0.2 0.3 0.4 0.577
Reduction in height (%)
Reduction in internal diameter (%)
[image:2.595.329.522.70.256.2] [image:2.595.372.481.300.494.2]3. Numerical Sigmoid and Calibration Curves
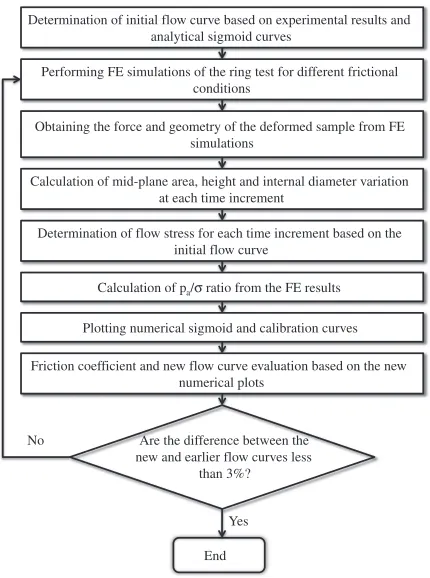
In the present research work, numerical sigmoid and calibration curves are obtained from FE analyses. The flowchart of the employed procedure is shown in Fig. 4. As the first step, initial flow curves of the material were obtained from the experiments by using the analytical sigmoid curves mentioned in the previous section. By using these flow curves, the FE simulations of the ring test were performed for 11 different frictional conditions. Thereafter, thefirst set of numerical sigmoid and calibration curves were obtained. Deformed geometry of the ring samples should be used to find the corrected flow curve based on the average pressure at the mid-plane of the sample. The simulations should be repeated with this new set of flow curves. This procedure must be continued until the results are not changed greater than a certain small value, namely 3%. The finally obtainedflow curves, sigmoid curves and calibration curves are assumed to be the best ones. For evaluating the accuracy of the obtained results, the force-displacement curves of the FE simulations could be compared with experimental ones.
4. Experimental Procedure
Using casting and machining processes, AZ80 samples for conducting the ring tests were manufactured. The composi-tion of the material is shown in Table 1. The standard ring specimen ratio of 6 : 3 : 2 and the ring samples with outer diameter, inner diameter and height of 9, 4.5 and 3 mm, respectively, were used.
Hot ring compression tests were conducted employing a 150 KN servo-electric testing machine, equipped with an electrical furnace. The samples were compressed under dry (no lubricant) frictional conditions with various percentages of height reduction. The maximum height reduction of the ring samples was about 50%and the tests were performed at strain rates of 0.001, 0.01 and 0.1 s¹1 and temperatures of 200, 225 and 250°C. The ring samples deformed at 250°C and various strain rates are shown in Fig. 5.
5. Finite Element Simulations
5.1 Finite element model
All the finiteelement simulations were conducted using ABAQUS software. Based on the experimental results, the flow stress of the material was introduced into the FE code for various temperatures, strains and strain rates. The type of analysis was selected to be coupled temperature displacement. Moreover, the element type employed for numerical modeling of the process was CAX4T. Because of axisymmetric nature of the model, a quarter of diametral section of a ring sample was modeled. The ram was also modeled by means of an axisymmetric analytical rigid surface.
5.2 The friction law used for FE simulations
Coulomb friction law was used for FE simulations. This friction law is expressed as follow:
¸¼®p ð2Þ
where¸is the frictional stress,®is the friction coefficient and
p is the interfacial normal pressure. In the ring compression test, the normal stress distribution is almost uniform over the contact area. Therefore, this friction law has acceptable results in this case.15) At high interfacial contact pressures, employing Coulomb friction model results in a critical shear stress at the toolworkpiece interface which is greater than the shear flow stress of the material. Such a situation is actually unacceptable and for this reason, in the present research work, a shear stress limit is also considered for the Coulomb friction law.
Determination of initial flow curve based on experimental results and analytical sigmoid curves
Obtaining the force and geometry of the deformed sample from FE simulations
Performing FE simulations of the ring test for different frictional conditions
Calculation of mid-plane area, height and internal diameter variation at each time increment
Determination of flow stress for each time increment based on the initial flow curve
Calculation of pa/σ ratio from the FE results
Plotting numerical sigmoid and calibration curves
Friction coefficient and new flow curve evaluation based on the new numerical plots
Are the difference between the new and earlier flow curves less
than 3%?
End Yes No
[image:3.595.62.277.69.358.2]Fig. 4 Flowchart of the proposed procedure for obtaining numerical sigmoid and calibration curves and correction of theflow stress.
Table 1 Composition of AZ80 magnesium alloy employed. Material Composition, mass%
Mg Al Zn Mn Si Cu Fe Ni Other AZ80 Mg
alloy Bal. 7.9 0.5 0.24 0.05 0.001 0.002 0.001 0.1
[image:3.595.302.552.82.245.2]The material softening of the magnesium alloy under consideration can be represented very well in Fig. 6. This figure illustrates the FE mesh of the original ring before deformation [Fig. 6(a)] together with the deformed mesh after different reductions in height [Figs. 6(b)6(e)]. For this simulation the friction coefficient, the temperature and the axial strain rate were, respectively, 0.2, 225°C and 0.1 s¹1. Observing Fig. 6, one canfind out that compared with 60% reduction in height, in which the Mises stress is quite homogeneous and between 120 to 140 MPa, the effective stress for 15% reduction is significantly greater, namely around 180 MPa. This is mainly due to strain softening behavior of the material.
6. Results and Discussions
6.1 Flow curves
The finally obtained flow curves for AZ80 magnesium
alloy under consideration are illustrated in Fig. 7. Thisfigure shows that for each level of temperature, with any increase in the strain rate, theflow stress is also increased. For a specific deformation rate, theflow stress decreases with any increase in the temperature.
The flow curves explain that the work hardening has occurred during the initial stage of the ring test. At this stage of the experiment, the hardening rate is higher than the softening rate. Afterwards, a short stable stage was exhibited, and then the softening rate dominated the hardening rate. Finally, a balance between hardening and softening was maintained and the flow stress became steady. These phenomena are in agreement with observations reported earlier for AZ91 magnesium alloys.16)
The strain corresponding to the peak stress has also varied from 0.2 to 0.3. When the strain rate is increased, in the vicinity of this strain the differences between various flow curves are greater in most the cases. Another important point is that the higher the temperature, the greater is the effect of the axial strain rate. For the magnesium alloy under consideration, at a test temperature of 250°C, there is an increase of about 70%in theflow stress, when the strain rate is changed from 0.001 to 0.1 s¹1. However, at 200°C, this increase in value offlow stress is nearly 37%. After the peak stress and with increase in the induced strain, the distances between various flow curves gradually decrease in most the cases. At the steady parts of the curves, the differences are normally the least. Considering the above points, it can be concluded that similar to the hardening stage, the greater values of the strain rate, intensify the softening behavior of AZ80 magnesium alloy.
Figure 8 shows the microstructures of the magnesium alloy before and after deformation at 225°C, a strain rate of 0.01 s¹1and about 30%reduction in height. Tofind that how axis of symmetry
Fig. 6 Thefiniteelement model of the ring test with a friction coefficient of®=0.2, a strain rate of 0.1 s¹1and a temperature of 225°C for different percentages reduction in height.
0 0.1 0.2 0.3 0.4 0.5 0.6 0.7 0.8 0.9 1
0 25 50 75 100 125 150 175 200 225
True strain, ε
Flo
w stress,
σ /MP
a
0.1/s 0.01/s 0.001/s
(a)
0 0.1 0.2 0.3 0.4 0.5 0.6 0.7 0.8 0.9 1
0 25 50 75 100 125 150 175 200
True strain, ε
Flo
w stress,
σ /MP
a
0.1/s 0.01/s 0.001/s (b)
0 0.1 0.2 0.3 0.4 0.5 0.6 0.7 0.8 0.9 1
0 25 50 75 100 125 150 175
True strain, ε
Flo
w stress,
σ /MP
a
0.1/s 0.01/s 0.001/s (c)
[image:4.595.50.289.71.201.2] [image:4.595.97.500.500.768.2]the deformation affected the grain size, employing the linear intercept method, the average grain size were calculated to be 10.5 and 8.1 µm for as-cast and deformed samples, respectively.
6.2 Variations of the friction coefficient with
[image:5.595.121.476.70.192.2]temper-ature and strain rate
Figure 9 shows that how the friction coefficient for samples made of AZ80 varies with the temperature and strain rate. This graph illustrates that the higher the temper-ature, the greater is the friction coefficient. Larger strain rates also resulted in lower frictions. It seems that the variation of
®with temperature quite accelerated for strain rates of 0.001 and 0.01 s¹1, compared with 0.1 s¹1. It could be due to
greater contact time and interactions between the tool and the workpiece during the course of deformation at low rates. This observation is also in agreement with findings gained by Wang and Lenard.17)
6.3 The numerical sigmoid curves
In this section, the effect of material behavior on the sigmoid curves is described. Furthermore, the influences of temperature and rate dependency on these curves are investigated and discussed. Numerical sigmoid curves are obtained based on the method expressed in Fig. 4. Figure 10 typically illustrates these curves for T=225°C and ¾_= 0.001 s¹1. The numerical calibration curves for these conditions are also shown in Fig. 11.
6.3.1 A comparison between analytical and numerical
sigmoid curves
By comparing Figs. 2 and 10, one can find out that for 40% reduction in height and 30% reduction in internal
diameter,pa/·ratio is reduced from 2.0 to 1.24. Therefore, it
can be claimed that for various materials, specially for those with flow softening, different sets of sigmoid curves should be used for the ring test. This remedy can considerably improve the accuracy of the flow curve obtained.
Figure 12 illustrates the flow curves obtained from the analytical (Fig. 2) and numerical (Fig. 10) sigmoid curves for comparison purposes. It can be seen that, for many values of strain, the difference is greater than 20%, although the general shapes of the curves are almost the same. For
Fig. 8 Optical micrograph of the cast AZ80 magnesium alloy, (a) before performing ring compression test (b) after deformation at temperature of 225°C and strain rate of 0.01 s¹1and nearly 30%reduction in height.
0.18 0.20 0.22 0.24 0.26 0.28 0.30
175 200 225 250 275
Coeff
icient of friction,
μ
Temperature, T/°C 0.001/s
0.01/s
0.1/s
Fig. 9 Variations of the friction coefficient with temperature and strain rate.
-40
-20
0
20
40
0.9
1
1.1
1.2
1.3
1.4
1.5
1.6
Reduction in internal diameter (%)
p
a/
σ
5 5
10 10
15
15
20
20
30
30 40
40
50
50
60
60
Reduction in height(%)
Fig. 10 Numerical sigmoid curves for AZ80 magnesium alloy at 225°C and 0.001 s¹1.
0 10 20 30 40 50 60 -20
-10 0 10 20 30 40 50 60
Reduction in height (%)
Reduction in internal diameter (%)
0 0.03
0.07 0.1 0.15 0.2 0.25
0.3 0.577
[image:5.595.328.524.240.406.2] [image:5.595.78.261.241.357.2] [image:5.595.360.492.457.621.2]evaluation of the accuracy of these curves, they were incorporated in two separate FE simulations. It is notable that eachflow curve was used with the corresponding friction coefficient specified from the relevant calibration curves (Fig. 3 for the analytical coefficient and Fig. 11 for the numerical one).
The load-displacement curves obtained from these FE simulations together with the experimental results are shown in Fig. 13. It is clear from this figure that the flow curves obtained from the numerical sigmoid curves, compared with the analytical one, resulted in a more accurate load-displacement curve.
The numerical and analytical sigmoid curves are compared with each other in Fig. 14. This comparison is made for
T=250°C, ¾_=0.001 s¹1 and various reductions in height.
It is obvious that for lower frictions (negative reduction in internal diameter), the numerical and analytical curves are quite closer to each other, whereas at high frictions, there are more clear dissimilarities between them. The significant difference between the numerical and analytical curves at early stages of the deformation could be due to strain softening behavior of the AZ80 alloy. With this regard it can be claimed that for 60%reduction in height, where theflow stress reaches a quite steady value, the general shapes of both the analytical and numerical sigmoid curves are almost the same.
6.3.2 The effects of temperature on the numerical
sigmoid curves
Both the temperature and the rate of deformation affect the flow stress of the material. Therefore the geometry of sigmoid curves could be influenced by these process variables. For three levels of temperatures, namely 200, 225 and 250°C, and three different reductions in height, namely 15, 30 and 60%, the sigmoid curves are plotted in Fig. 15. The average strain rate for all these curves is 0.1 s¹1.
By comparing the ranges of variation of the internal diameter for different graphs of Fig. 15, it can be found that for a higher reduction in height, the influence of friction on the geometry of the ring sample is much more perceptible. Figure 15 also indicates that the higher the temperature, the lower is the contribution offlow stress in the average pressure (pa). Furthermore, this graph implies that around the peak
stress of the flow curve, there is a peak in the relevant sigmoid curve [Fig. 15(a)]. However, sigmoid curves for 60% reduction in height [Fig. 15(b)] are monotonically increasing. This means that when the deformed sample is thin enough, the effect of friction is predominant and with any increase in interfacial friction, pa/· ratio increases
consid-erably. For this situation, as well as other reductions in height, any growth in temperature reduces the contribution of flow stress in pa.
0 0.1 0.2 0.3 0.4 0.5 0.6 0.7 0.8 0.9 1
0 20 40 60 80 100 120
True strain, ε
Flo
w stress,
σ /MP
a
[image:6.595.332.521.71.213.2]Numerically based flow curve Analytically based flow curve
Fig. 12 Comparison of theflow curves obtained based on the analytical and numerical sigmoid curves for a temperature of 225°C and a strain rate of 0.001 s¹1.
0 0.2 0.4 0.6 0.8 1 1.2 1.4 1.6 1.8 2
0 2 4 6 8 10 12 14 16 18 20 22
Displacement, Δh /mm
F
orce,
F
/KN
[image:6.595.71.273.71.198.2]With numerical flow curve With analytical flow curve Experiment
Fig. 13 Force-displacement curves gained from FE simulations with numerical and analytical flow curves together with the experimental findings forT=225°C and¾_=0.001 s¹1.
-201 -10 0 10 20
1.1 1.2 1.3 1.4 1.5 1.6 1.7 1.8
Reduction in internal diameter (%) p a
/
σ
Analytical, 15% Numerical, 15%
Numerical, 30% Analytical, 30% (a)
-60 -40 -201 0 20 40 60 80 1.2
1.4 1.6 1.8 2 2.2 2.4
Reduction in internal diameter (%) p a
/
σ
Analytical, 45% Numerical, 45% Analytical, 60% Numerical, 60% (b)
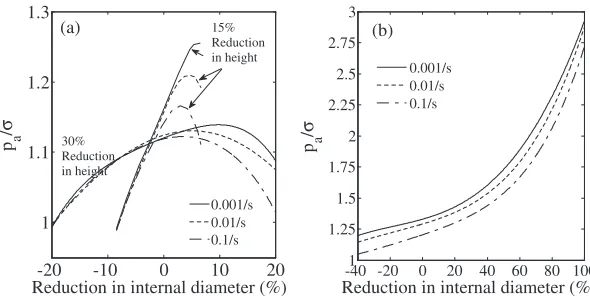
[image:6.595.154.442.278.420.2]6.3.3 The effects of strain rate on the numerical sigmoid curves
In order to examine the influence of the rate of deformation, the sigmoid curves for three reductions in height, three levels of strain rate and a temperature of 225°C are illustrated in Fig. 16. It can be seen that for low frictions (negative values on the horizontal axis) the strain rate did not have a significant influence on pa/· ratio. However more
apparent effect of the rate dependency can be observed at higher frictions (right part of each curve). Considering a specific reduction in height, at higher frictions, the average pressure andflow stress increase when the strain rate rises but the ratiopa/·decreases, i.e. the contribution offlow stress in
paincreases.
7. Concluding Remarks
Based on the observations made in the previous sections, following conclusions can be drawn:
(1) The experimental technique proposed can be used for simultaneous evaluation of the interfacial friction and theflow stress of the material under various conditions of the bulk metal forming processes with considerable time and cost savings.
(2) It is feasible to employ the ring compression test for evaluation of the flow stress of rate and temperature
dependent materials provided that the relevant sigmoid and calibration curves are employed.
(3) The FE simulations showed that the geometry of the sigmoid curves is significantly influenced by the mate-rial behavior, specially for metals with strain softening. (4) The numerical sigmoid and calibration curves gained from the FE simulations were used for flow stress evaluation of AZ80 magnesium alloy. Theflow curves obtained by this method, compared with the analytical ones, resulted in a good agreement with experimental findings.
(5) The sigmoid curves showed that the effect of the friction on the sample geometry was more apparent at higher reductions in height.
(6) Any increase in the test temperature shifted the sigmoid curves upwards, specially at higher levels of friction. (7) The effect of the strain rate on the geometry of the
numerical sigmoid curves was minor for low levels of friction. However, this effect was significant at high frictions, where pa/· reduced considerably by certain
increase in the rate of deformation.
REFERENCES
1) K. P. Rao and K. Sivaram:J. Mater. Process. Technol.37(1993) 295 318.
-20 -10 0 10 20
0.95 1 1.05 1.1 1.15 1.2 1.25
Reduction in internal diameter (%) p a
/
σ
200°C 225°C 250°C
(a) 15%
Reduction in height
30% Reduction in height
-40 -20 0 20 40 60 80 100
1 1.3 1.6 1.9 2.2 2.5 2.8
Reduction in internal diameter (%) p a
/
σ
200°C
225°C
[image:7.595.146.448.72.220.2]250°C (b)
Fig. 15 Effects of the temperature on the numerical sigmoid curves for 0.1 s¹1axial strain rate and, (a) 15 and 30%reduction in height, (b) 60%reduction in height.
Reduction in height
-20 -10 0 10 20
1 1.1 1.2 1.3
Reduction in internal diameter (%) p a
/
σ
0.001/s 0.01/s 0.1/s
(a) 15%
Reduction in height
30%
-40 -201 0 20 40 60 80 100
1.25 1.5 1.75 2 2.25 2.5 2.75 3
Reduction in internal diameter (%) p a
/
σ
0.001/s 0.01/s 0.1/s (b)
[image:7.595.150.445.274.422.2]2) M. E. Mielnik:Metalworking Science and Engineering, (McGraw-Hill, New York, 1991).
3) B. Buchner, G. Maderthoner and B. Buchmayr: J. Mater. Process. Technol.198(2008) 4147.
4) H. Sofuoglu and J. Rasty:Tribol. Int.32(1999) 327335.
5) F. Fereshteh-Saniee, I. Pillinger and P. Hartley: J. Mater. Process. Technol.153154(2004) 151156.
6) D. Shahriari, A. Amiri and M. H. Sadeghi:J. Mater. Eng. Perform.19 (2010) 633642.
7) A. T. Male and M. G. Cockcroft: J. Inst. Metals93(1964) 3846. 8) L. F. Chiang, N. Nishioka, J. Y. Wang, H. Hosokawa, T. Uesugi, Y.
Takigawa and K. Higashi:Mater. Trans.51(2010) 477481.
9) L. F. Chiang, H. Hosokawa, J. Y. Wang, T. Uesugi, Y. Takigawa and K. Higashi:Mater. Trans.51(2010) 12491254.
10) F. Fereshteh-Saniee and F. Fatehi-Sichani:J. Mater. Process. Technol.
177(2006) 478482.
11) Y. J. Hwu, C. T. Hsu and F. Wang:J. Mater. Process. Technol.37 (1993) 319335.
12) H. Cho and T. Altan:J. Mater. Process. Technol.170(2005) 6470.
13) ASM International Handbook Committee: ASM Handbook, Vol. 2, (Properties and Selection: Nonferrous Alloys and Special-Purpose Materials, ASM International, 1990) pp. 455460.
14) B. Viehweger, A. Karabet, M. Düring and L. Schaeffer:Materialwiss. Werkstofftech.36(2005) 211217.
15) M. S. Joun, H. G. Moon, I. S. Choi, M. C. Lee and B. Y. Jun:Tribol. Int.42(2009) 311319.
16) E. Cerri, P. Leo and P. P. De Marco:J. Mater. Process. Technol.189 (2007) 97106.


![Leistungen des Ökolandbaus für Umweltschutz und Nachhaltigkeit [Services of Organic Agriculture for Environmental Protection and Sustainability]](data:image/gif;base64,R0lGODlhAQABAIAAAP///wAAACH5BAEAAAAALAAAAAABAAEAAAICRAEAOw==)