Munich Personal RePEc Archive
Improving Patient’s Satisfaction at
Urgent Care Clinics by Using
Simulation-based Risk Analysis and
Quality Improvement
Sajadnia, Sahar and Heidarzadeh, Elham
M.Sc., Industrial Engineering, Faculty of Engineering, Islamic Azad
University, West Tehran Branch, Iran, M.Sc., Industrial
Engineering, Faculty of Engineering, Islamic Azad University, West
Tehran Branch, Iran
5 September 2016
Online at
https://mpra.ub.uni-muenchen.de/73989/
Improving Patient’s Satisfaction at Urgent Care Clinics by Using
Simulation-based Risk Analysis and Quality Improvement
Sahar Sajadnia 1, Elham Heidarzadeh 2
1 M.Sc., Industrial Engineering, Faculty of Engineering, Islamic Azad University, West Tehran
Branch, Iran
2 B.Sc., Industrial Engineering, Faculty of Engineering, Islamic Azad University, Karaj Branch,
Iran
Abstract
Several factors are expected to significantly increase stakeholders’ interest in healthcare simulation studies in the foreseeable future, e.g., the use of metrics for performance measurement, and increasing patients’ expectations. Total time spent by a patient as an important issue leads to patients’ dissatisfaction which should be improved in any healthcare facility. We reported on the use of discrete event simulation modeling, quality function deployment (QFD) and failure mode effects analysis (FMEA) to support process improvements at urgent care clinics. The modeling helped identify improvement alternatives such as optimized healthcare facility staff numbers. It also showed that lack of identified role for all team members and inconsistent process of ordering and receiving blood products and lab results are crucial failures that may occur. Moreover, using experienced staff and forcing staff to follow correct procedures are important technical aspects of improving the urgent care clinics in order to increase patient’s satisfaction. Quantitative results from the modeling provided motivation to implement the improvements. Statistical analysis of data taken before and after the implementation indicate that total time spent by a patient was significantly improved and the after result of waiting time is also decreased.
1. Introduction
Healthcare is mainly related to the diagnosis and treatment of the patient at different levels and varied departments. So a hospital is the place that can be counted on the healthcare apart from other conventional methods of treatment at home. Hospital is a place where different departments work on treating different kinds of patients towards common goal. Hospital include different departments/units namely outpatient unit, urgent care, emergency care, Intensive Care Unit (ICU), radiology, clinical laboratory, internal medicine, obstetrics and gynecology unit, surgical unit etc.
There are several studies related to improving urgent care clinics. McCarthy et al. [1] considered correlation between waiting time and non-attendance at an urgent care as indicators of quality to show that 64% of patients rated waiting times as unsatisfactory. In addition, that study reported that a significant number of patients who decline to attend their appointment do so because of the expectation of long waiting times. Such “no-shows” are an obviously undesirable occurrence where they can be avoided. In the similar environment of appointments for physicians, survey results show patient waiting time as one of the top three differentiators for “best practice” offices versus average offices [2]. Ho et al. [3] presented theoretical models of detailed daily operations with patient arrivals and resource constraints as well as the impact on staff idle time. Harper el al. [4] and references therein discuss simulation approaches to designing detailed daily schedules, e.g., to minimize waiting times for patients after they arrive in the clinic. Shim et al. [5] used a case study conducted at the hospital and uses historical data provided by the hospital to simulate the emergency care process. Their simulation resulted demonstrate that the changes proposed can shorten patient wait times in the emergency care process. The proposed changes involve adding another payment station and a new short-stay ward in the process. Based upon the results, the paper supported the implementation of the changed proposed.
planning the characteristics of a new or existing service based on the customer’s need of the industry [6]. It turns the customer demand into a step-by-step process by prioritizing the several characteristics of the service in demand [7]. By using the QFD model, we were able to comprehend the basic customer quality and care requirements at urgent care clinics. By considering all major customer requirements and technical requirements we could establish fundamentals for improving and designing process flows in the urgent care clinics. Furthermore,
failure modes and effects analysis (FMEA) is utilized in this paper in order to assess risk of patient injury by prospectively identifying and prioritizing potential system failures. The FMEA method that we used is practical in discovering patient’s conditions and active failures and to prioritize these based on the potential severity of risks associated with them. Process failures were analyzed for occurrence, severity, and detect of occurrence using the FMEA [8].
2. Urgent Care Unit
Urgent care clinic is modelled using simulation. For this, a lot of preliminary steps are involved right from creating logic to animating the process and getting the results. The results are then compared with different scenarios along with the resource manipulation and other feasible solution that help in making the process simpler and efficient.
There are only processing times and only the run length but not the data where distribution can be done. The logic is divided into three different sections for convenient and easy understanding. The sections are entrance gate, treatment procedure and the exit gate.
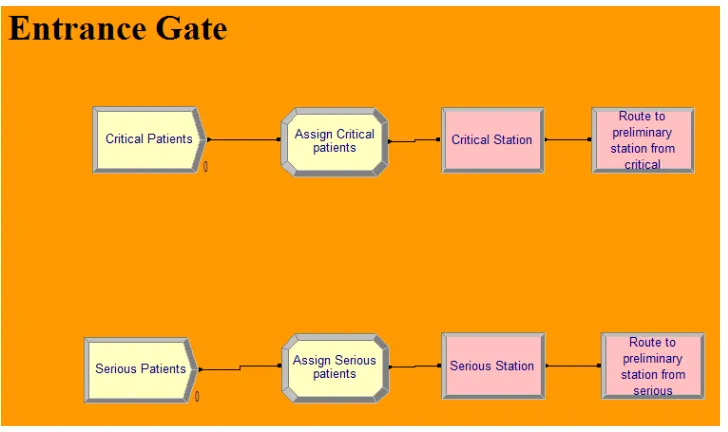
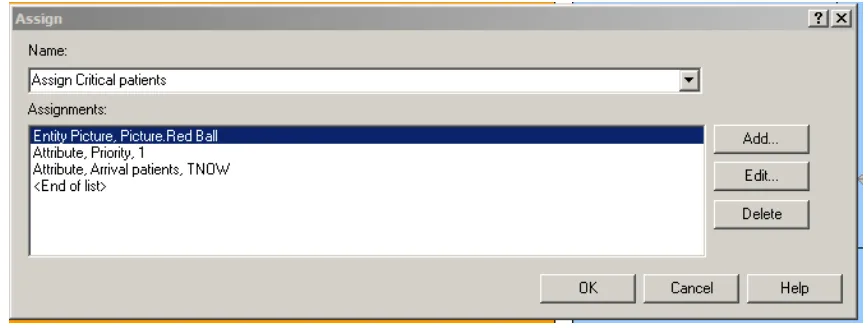
The entrance gate has the create modules which helps in creating the entities. There are two types of patients that enter the urgent care clinic; they are critical patients and serious patients. Upon arrival into the clinic these two kinds of patients are given priority depending on their condition. If the patient is very critical, he is assigned a priority 1 so that the patient would be attended on highest priority.
Figure 1. Entrance gate
Figure 2. Assign critical patients
The serious patients are given priority 2 so that depending on the arrival of the critical patients, the priority is checked with them and they are attended by the clinic staff.
Figure 3. Assign serious patients
[image:6.612.71.541.332.506.2]Figure 4. Decision the criticality of patient
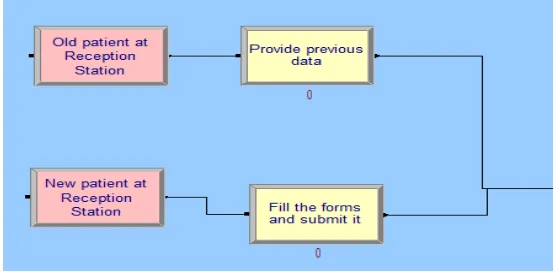
As described above if the patient is not critical and new then there is a procedure to be followed as filling the forms and waiting in the room if the patient is able to find an appointment with the doctor. All the above mentioned process is mentioned with different process module names. The process times are 10 minutes which is a constant value for both the above mentioned processes. If the patient is old, then a process of retrieving the old data is created with a time of minutes.
Figure 5. Entry of old and new patients
[image:7.612.167.445.408.544.2]Figure 6. Queue to medical assistant
[image:8.612.131.486.278.379.2]The next process is waiting in the examination room with a time of minutes. Then the process is routed to physician’s station using a route module.
Figure 7. Medical assistant and waiting room
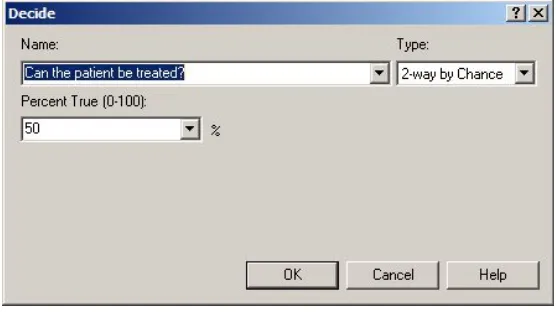
A decision module is used to check if the patient can be treated or not.
Figure 8. Decision treatment status
[image:8.612.167.445.461.617.2]the doctor or the physician and then sent to another decision module for checking the condition of the patient for level of lab tests required.
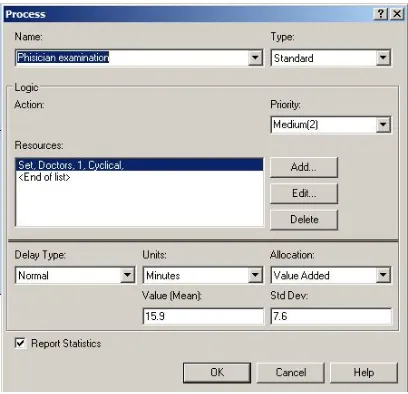
Figure 9. Process of physician’s examination
If the decision module sends the entities directly to pharmacy, then the condition is false and the patient does not require any tests. If the physician decisions positive on the tests, the entity is directed to lab using a station and route with a no specific route time mentioned.
The testing process has a mean value of 13.67 minutes and a standard deviation of 13.3 minutes. After the lab reports, the patient is sent for re-examination with the physician with a process time of 7.58 minutes mean and 4.2 minutes standard deviation.
With the help of the logic mentioned above, a clear animation is created to help understanding the system better using the routes and stations that connects all the processes and the decision module.
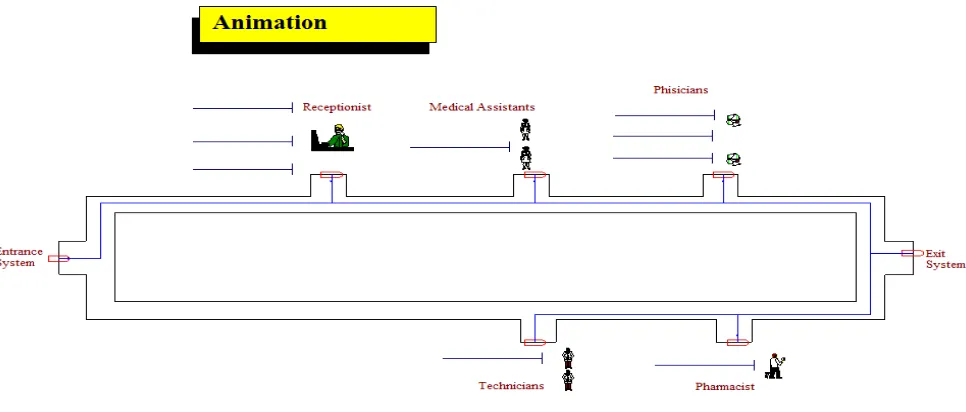
Figure 10. Animation
The animation has different symbols and figures used to represent the entities and the processes. The lines beside the pictures represent the queues for the model. The animation above is another than the pictorial representation of all the discussed processes above
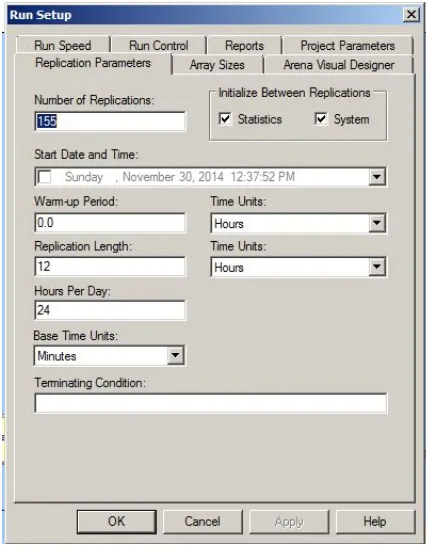
Figure 11. Run setup
The setup is for a period of 24 hours and this set up is saved and results in the system are saved. These set up parameters can be altered based on the situation. The warm-up period can also be calculated if the clinic is running for a period of 24 hours around the clock.
3. Implementation of Quality Function Deployment (QFD)
In this section, we developed part of QFD model that was proposed by Akar et al. [9] in order to develop services at urgent care clinics which results in enhancing patients’ satisfaction.
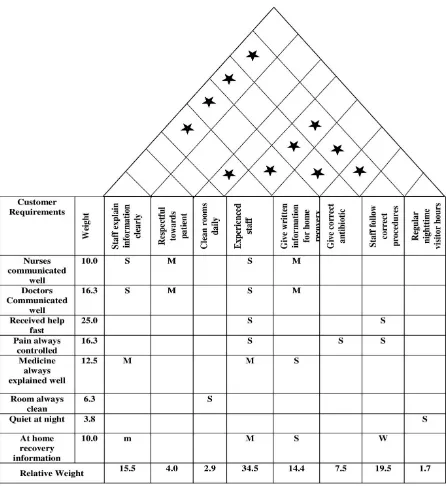
The matrix illustrated in figure 12 called House of Quality due to a roof-like structure in its top. This house is divided in “rooms”. Rooms are patients’ requirements (customer requirements), technical requirements (design requirements), benchmarking, and correlation matrix.
4. Implementation of Failure Mode Effects Analysis (FMEA)
In order to implement Failure Mode Effects Analysis (FMEA) in urgent care clinics to find potential failures associated with laboratories, we used proposed FMEA model in Feili’s et al. [10] paper.
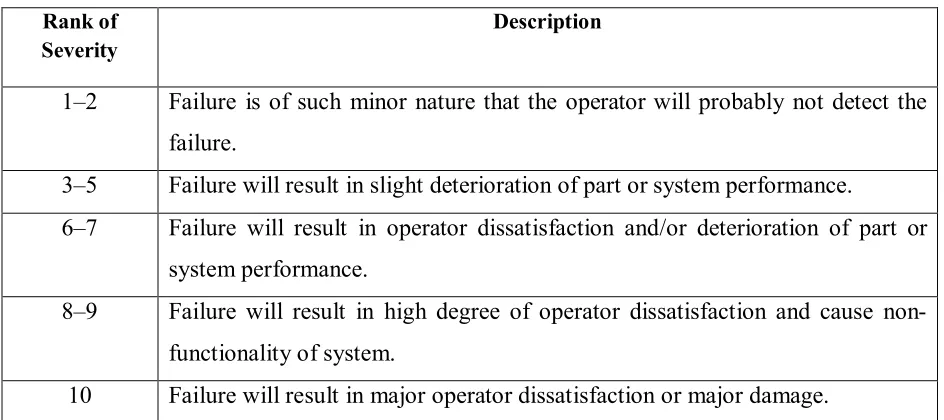
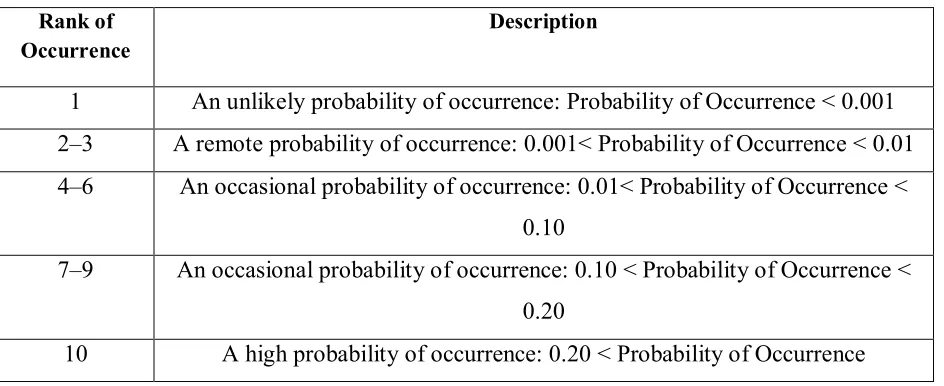
[image:13.612.71.543.317.527.2]In FMEA, Severity refers to the immensity of the last effect of a system failure (Table 1). Occurrence refers to the probability of a failure to occur (Table 2). Detection refers to the likelihood of detecting a failure before it can occur (Table 3).
Table 1
Severity rating scale for FMEA
Description Rank of
Severity
Failure is of such minor nature that the operator will probably not detect the failure.
1–2
Failure will result in slight deterioration of part or system performance. 3–5
Failure will result in operator dissatisfaction and/or deterioration of part or system performance.
6–7
Failure will result in high degree of operator dissatisfaction and cause non- functionality of system.
8–9
Table 2
Occurrence rating scale for FMEA
Table 3
Detection rating scale for FMEA
Rank of
Detection Description
1–2 Very high probability that the defect will be detected. 3–4 High probability that the defect will be detected. 5–7 Moderate probability that the defect will be detected. 8–9 Low probability that the defect will be detected.
10 Very low (or zero) probability that the defect will be detected.
Risk priority number (RPN) is the multiplication of severity of failures (S), their portability of occurrence (O), and the possibility of detection (D).
RPN = S ×O ×D (1)
Description Rank of
Occurrence
An unlikely probability of occurrence: Probability of Occurrence < 0.001 1
A remote probability of occurrence: 0.001< Probability of Occurrence < 0.01 2–3
An occasional probability of occurrence: 0.01< Probability of Occurrence < 0.10
4–6
An occasional probability of occurrence: 0.10 < Probability of Occurrence < 0.20
7–9
[image:14.612.73.540.364.504.2]Table 4
FMEA worksheet
Failure Effect O S D RPN
Lack of identified role for all team
members in a Code C-section. Confusion in task assignment Uncoordinated and fragmented
care
10 8 9 720
Inconsistent process of ordering and receiving blood products and lab
results Mismanagement of clinical Delay in receiving blood situation
10 10 7 700
Lack of closed-loop communication
with lab/blood bank Delay in receiving blood Inefficiency of care
10 10 6 600
No standardized communication between RN, OB, and NNP
regarding clinical status Mismanagement of clinical situation
8 8 9 576
“Dead spaces” noted when Code
C-section is called overhead Delay in personnel arriving to the Code C-section
10 9 5 450
Failure to use common language in
calling Code C-section Delay in personnel arriving to the Code C-section
4 5 9 180
Drugs for treatment of hemorrhage
are not located in same place Delay in treatment 10 8 1 80
Anesthesiologist in OR not able to
talk directly with the lab/blood bank Delay in receiving blood Mismanagement of clinical
situation
10 4 1 40
Neonatal resuscitation needs not
standardized among NNPs Variability in care Delay in care
5 8 1 40
Interpreter services utilized in
5. Results
5.1. Simulation Model
[image:16.612.75.540.200.438.2]When the model/logic is made to run for all the replications, we get an average total time of 311.05 of the patients. Some of the other results for the simulations are also displayed in the picture below.
Figure 13. Results for urgent care clinic
In each day 14 patients are coming to the Urgent care and the average time in the system for Critical patient is 61.50 minutes and for Serious patient is 80.64 minutes. The average for all patients can be seen in the below table.
Table 5
Average wait for urgent care Physician
examination Lab test Pharmacy
Provide previous
data
Update medical records
Preliminary
differentiation Fill the forms
[image:16.612.71.551.601.681.2]Since all the other process are fast enough, we can say that preliminary differentiation takes lot of time as the queue here is really busy and also multiple number of queues. The average utilization of staffs can be seen in below table.
Table 6
Staff utilization of Urgent care
Doctor 1 Doctor 2 Assistant 1 Assistant 2 Pharmacist Receptionist Technician
0.97 0.95 0.31 0.3 0.04 0.99 0.07
From the above table we can see that the receptionist is the one that is more extensively used. So while having a procedure for reducing the total time of the patient in the system, we can concentrate on reducing or increasing the number of receptionist to have an optimal solution.
N calculation:
The system is a terminating system with a fixed operation timing. So for having the analysis more detailed and accurate calculation of n is an important task.
We used the below equation to obtain this number:
n = t , / (2)
h = μ. α (3)
At first we ran the model with 10 replications, so n0 is equal to 10. We used confidence interval of 95% (α = 0.05). We saved the output of total cycle time, then we opened this file in Output Analyzer in other to obtain the standard deviation (s) and the mean (μ). We have the below results from the Output Analyzer:
μ = 30.43
h= 30.43*0.05 = 1.52
t 9,97.5= 2.26
n1 = 2.26 * .. = 135
As a result, the total number of replications is equal to:
n = n0 + n1 = 10 + 135 = 145
We did the same method for urgent care and the total number of replications for that is 155.
5.1.1. Process Analyzer-best Scenarios
[image:18.612.74.540.470.616.2]For calculating the optimal solution, we have used the process analyzer. The optimal solution is the best scenario that the analyzer gives that reduces the total time in the system. We have taken into consideration only the resources to change the total time in the system which is the objective of the process. We have used different combinations by manipulating the resources. The cost analysis was not in the scope of the project.
Figure 14. Urgent Care best scenario
resources such as doctor and the assistant are one and the number of receptionist value is increased to two.
When this solution is compared to the original scenario, we found that the total time in the system has been reduced to around 36 minutes which when converted in terms of money is a huge amount to the organization. The system ran with the value of n calculated above.
So there are two scenarios that give almost the similar time in the system but as per thinking of an Industrial engineer, we would select the second scenario which has a total time in the system as 81.442 minutes. Since the last scenario has only few second of reduced time but the second one has only two doctors with all the other resources being the same number as the base scenario. Increasing the nurse 1 to get a discount of few seconds would not be a good idea as per the statistics. Thus the second scenario would be considered as a best one.
5.2. Applied QFD and FMEA
We conducted series of questionnaires in order to find potential patient’s requirements so we ended up with 9 customer requirements. Among the 9 CRs, 3 of them including receiving help fast, good communication among doctors and patients, and controlling pain regularly with weight of 25.0, 16.3, and 16.3, respectively are really crucial.
According to the quality function deployment (QFD) study, we figured out 8 technical requirements in order to satisfy patient’s requirements. 3 vital TRs are experienced staff, following correct procedure by staff, explaining information by staff clearly with crisp value of 34.5, 19.5, and 15.5, respectively.
6. Conclusion
It is obvious that total spent time by patient is a crucial factor that leads to patients’ dissatisfaction at any healthcare facility. Reducing this total time can help each urgent care clinic to increase patients’ satisfaction effectively. In this research project we could show how modifying number of doctors, nurses, pharmacists, and staff can make a change in total time spent by patient at an urgent care by using desecrate event simulation. We also could show that lack of identified role for all team members and inconsistent process of ordering and receiving blood products and lab results are crucial failures that may occur. So appropriate corrective actions are required to come up with practical solutions in order to prevent these to occur. Moreover, using experienced staff and forcing staff to follow correct procedures are important technical aspects of improving the urgent care clinics in order to increase patient’s satisfaction.
References
[1] K. McCarthy, H.M. McGee, C.A. O’Boyle, “Urgent Care Clinic Waiting Times and Non-attendance as Indicators of Quality,” J. Psych Health Med, Volume No. 5, PP. 287–293, 2000.
[2] R. Blizzard, “Patient Satisfaction Starts in the Waiting Room,” J. Gallup Poll News Service, Volume No. 30, PP. 40-48, 2009.
[3] C.J. Ho, H.S. Lau, “Minimizing Total Cost in Scheduling Outpatient Appointments,” J. Management Science, Volume No. 38, PP. 1750-1764, 1992.
[4] P.R. Harper, H.M. Gamlin, “Reduced Outpatient Waiting Times with Improved Appointment Scheduling: a Simulation Modeling Approach,” J. OR Spectrum, Volume No. 25, PP. 207-222, 2003.
[5] S.J. Shim, A Kuma, “Simulation for Emergency Care Process Reengineering in Hospitals,” J. Business Process Management, Volume No. 16, PP. 795-805, 2010.
[6] Mazur, Glenn. “History of QFD” http://www.qfdi.org/what_is_qfd/history_of_qfd.html
[7] QFD online. “House of Quality Example”.2007-2010
http://www.qfdonline.com/qfd-tutorials/house-of-quality-qfd-example/
[9] Akar, Navid, Elaheh Daj, and Shahrooz Sharifi Boroojerdi. "Using Fuzzy Quality Function Deployment in Improving Reliabality of Wind Power Systems." (2016).