Thermodynamic Analysis of the Mg
RE
Zn (RE
=
Y, La) Ternary hcp Phase
Using the Cluster Variation Method
Satoshi Iikubo
1, Shuji Hamamoto
2and Hiroshi Ohtani
31Graduate School of Life Science and Systems Engineering, Kyushu Institute of Technology, Kitakyushu 808-0196, Japan
2Graduate School, Kyushu Institute of Technology, Kitakyushu 804-8550, Japan
3Department of Materials Science and Engineering, Kyushu Institute of Technology, Kitakyushu 804-8550, Japan
In this study, thermodynamic properties of the MgREZn (RE=Y, La) ternary hcp phase atfinite temperature have been investigated by
means offirst-principles calculations combined with the cluster variation method (CVM). Free energy calculation, including the configurational
entropy, shows that the MgYZn ternary hcp phase has a tendency to phase separation. Conversely, the MgLaZn ternary system does not
exhibit such behavior even around room temperature. Furthermore, the calculated spinodal region extends to a broader composition range and
the maximal spinodal temperature reaches above 1000 K for the MgYZn system. Conversely, the spinodal region for the MgLaZn system is
a limited narrow region near the Mg-rich side, and the maximal spinodal temperature is 300 K. Formation enthalpies calculated on the basis of
recent information from structure analyses do not show a definite difference in these two ternary systems. Therefore, we propose that the
dominant factors in the formation of a novel long period stacking ordered structure include spinodal decomposition as well as structure
transformation from 2H to other structures having periodic stacking faults. [doi:10.2320/matertrans.MI201222]
(Received November 29, 2012; Accepted January 23, 2013; Published April 25, 2013)
Keywords: first-principles calculations, cluster variation method, long period stacking ordered (LPSO), magnesium alloy, spinodal
decomposition
1. Introduction
The discovery of the long period stacking ordered (LPSO) structure in Mg-based alloys has attracted enormous interest
in the field of material science.110) Four types of LPSO
structure®10H, 14H, 18R and 24R®have been found and
the mechanical properties of these structures have been extensively investigated. A LPSO structure is characterized by the periodical arrangement of a stacking fault (SF) introduced on the hcp lattice. In addition, rare earth and transition metal atoms added to alloys form a chemically ordered structure in the SF layers. These processes result in a simultaneous modulation in composition as well as atomic structure. This novel structure is widely acknowledged to be a prerequisite for an excellent mechanical properties of the Mg-based alloys, such as a yield strength of 610 MPa and an
elongation of 5% at room temperature.2) To improve the
qualities of alloys, it is important to investigate the detailed process of the formation mechanism of the LPSO structure, particularly focusing on the origin of the compositional and structural modulation.
The atomic arrangement in LPSO structures has been
identified by transmission electron microscopy.9,10) Before
the system reaches the final structure, some intermediate
states possibly exist. For example, in an early stage of the microstructure development, rare earth atoms and transition metal atoms in the alloys are randomly distributed on the hcp-Mg lattices. On the basis of our thermodynamic analysis
of the MgYZn ternary system,7) we showed that a solid
solution of the hcp has a strong tendency to phase separation between the Mg-rich phase and the Y- and Zn-enriched phases. This could yield a compositional modulation observed in the LPSO structures. For a structural modulation, on the other hand, we found that long periodic structures become stable because of the vibrational entropy in a high
temperature region.8) Using first-principles phonon
calcula-tions, we propose “disordered”long periodic structures as a
preliminary step in the formation of the LPSO structures.
With these findings as a background, the present study
aims to conduct a more detailed investigation of the thermodynamic properties of the hcp phase in the entire composition and all temperature ranges. Two alloy systems
are investigated, i.e., MgYZn and MgLaZn systems.
The former has a typical LPSO structure, while the latter does not. Free energies of the hcp phase at various temperatures
were computed by means of first-principles calculations
combined with the cluster variation method (CVM).
2. Calculation Procedures
In this study, the CVM11,12) has been used to calculate
configurational thermodynamic properties. The Helmholts
free energyFis minimized with respect to the configurational
degrees of freedom such as site occupancies and correlation functions. The enthalpy and entropy terms in CVM are given by eq. (1) using a cluster expansion (CE) as:
F ¼X¡max ¡
J¡²¡T X¡max
¡
£¡S¡ ð1Þ
where¡represents a cluster,Jan effective cluster interaction
(ECI), ² a correlation function, £ a KikuchiBarker
coefficient,12) and S
¡ the entropy contribution from the
cluster ¡.¡max represents the maximal cluster considered in
an expansion. For CE and CVM, we used the code developed
by Sluiteret al.13)
Once an accurate CE has been obtained, the total energy of
any MgREZn arrangement can be calculated, and
there-fore, the free energies at afinite temperature can be obtained.
To make a CE for Mg, RE, and Zn configurations, we assign
an occupation variable·ito each possible site i, which takes
the value+1 if Y or Zn resides at that site and 0 if Mg is at
that site. It has been shown that the dependence of any Special Issue on Long-Period Stacking Ordered Structure and Its Related Materials (I)
property on a configuration can be exactly expanded in terms
of polynomials ²¡ of these discrete occupation variables ·i.
²¡ is defined as a product of occupation variables
·i;·j;. . .;·k, where the indices i, j, +, k correspond to a
collection of sites that form a cluster¡, such as a pair cluster,
a triplet cluster.
The maximal clusters were generated using an algorithm
that searches for the most compact clusters.14) Maximal
clusters are defined by two values, one is maximum distance between two vertexes, another is maximum number of vertex consisting clusters. As a result of several trial, we found the following optimum values; the maximum distance is 5.0 and
7.0¡, and the maximum number of vertex is 4 and 2, for
MgYZn and MgLaZn, respectively. A singular value
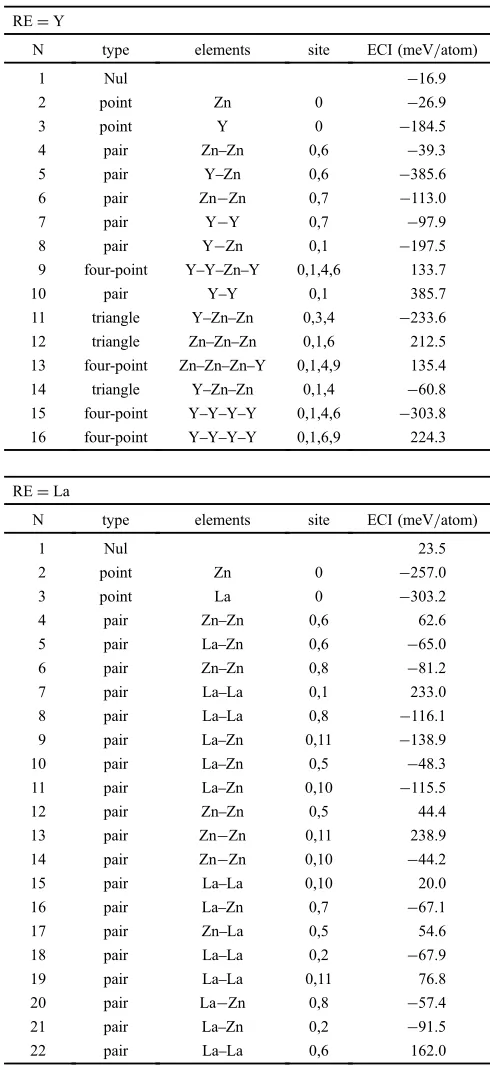
decomposition algorithm was used to extract values for 16 ECI out of a set of 244 using 133 enthalpies of formation for
MgYZn. The same procedure was applied to extract values
for 22 ECI out of a set of 71 using 143 enthalpies of
formation for MgZnLa. The formation enthalpy of a
structure is defined as the difference between its enthalpy and the concentration weighted enthalpies of pure Mg, RE and Zn with each stable structure. Figure 1 shows the hcp structure and Table 1 lists the number of points consisting each
clusters. As shown in the Table 1, for the MgYZn system,
an optimal set of clusters consists of point, pair, triangle, and
four-point clusters, whereas for the MgLaZn system, the
clusters consist of point and pair clusters. The values of the ECI for a particular system must be determined using an
accuratefirst-principles method. This is typically obtained by
calculating the energy of a series of configurations, and then
fitting a truncated form of the first term of eq. (1) to the
values of these energies. In this work, we disregard the electronic and vibrational degrees of freedom and consider only the contributions to the free energy of the configura-tional degrees of freedom associated with Mg, Y and Zn distributions. Free energy of a disordered state was calculated
from the obtained ECI energyJ¡. Thermodynamic properties
such as tendency to phase separation can be investigated by this method.
Total energy calculations were performed using the VASP
code,15,16) which is based on the density functional theory.
We employed Blochl’s projector augmented wave (PAW)
method as implemented by Kresse and Joubert.17,18)
Ex-change and correlation functions were given by the generalized gradient approximation as proposed by Perdew
et al.19) We used the standard version of the PAWGGA potential for Mg, Y, La and Zn. A kinetic energy cutoff
was set to 345.9 eV. The k-point meshes of Brillouin zone
sampling in a primitive cell were¥centered grids with Fermi
broadening of 0.1 eV. The convergence criterion for
elec-tronic self-consistency and ionic relaxation loop are 10¹4and
10¹3eV, respectively. In the present calculations, the unit
cells of the MgREZn ordered structures are fully relaxed
with respect to the volume, shape of the unit cell and atomic positions.
y
x
z
B
O A
C
0 1 2
3 4 5
6 7
8 9
10 11
Fig. 1 Side view of the a hexagonal cell with 11 atoms constituting a
cluster. The numbers denote atomic sites and correspond to the fourth column of Table 1. For pure magnesium, the a, b and c lattice parameters
[image:2.595.84.257.71.186.2]are 3.15, 3.15 and 5.14¡, respectively.
Table 1 Effective cluster interaction for the multibody clusters. Site
numbers correspond to the numbers denoted in Fig. 1.
RE=Y
N type elements site ECI (meV/atom)
1 Nul ¹16.9
2 point Zn 0 ¹26.9
3 point Y 0 ¹184.5
4 pair ZnZn 0,6 ¹39.3
5 pair YZn 0,6 ¹385.6
6 pair Zn¹Zn 0,7 ¹113.0
7 pair Y¹Y 0,7 ¹97.9
8 pair Y¹Zn 0,1 ¹197.5
9 four-point YYZnY 0,1,4,6 133.7
10 pair YY 0,1 385.7
11 triangle YZnZn 0,3,4 ¹233.6
12 triangle ZnZnZn 0,1,6 212.5
13 four-point ZnZnZnY 0,1,4,9 135.4
14 triangle YZnZn 0,1,4 ¹60.8
15 four-point YYYY 0,1,4,6 ¹303.8
16 four-point YYYY 0,1,6,9 224.3
RE=La
N type elements site ECI (meV/atom)
1 Nul 23.5
2 point Zn 0 ¹257.0
3 point La 0 ¹303.2
4 pair ZnZn 0,6 62.6
5 pair LaZn 0,6 ¹65.0
6 pair ZnZn 0,8 ¹81.2
7 pair LaLa 0,1 233.0
8 pair LaLa 0,8 ¹116.1
9 pair LaZn 0,11 ¹138.9
10 pair LaZn 0,5 ¹48.3
11 pair LaZn 0,10 ¹115.5
12 pair ZnZn 0,5 44.4
13 pair Zn¹Zn 0,11 238.9
14 pair Zn¹Zn 0,10 ¹44.2
15 pair LaLa 0,10 20.0
16 pair LaZn 0,7 ¹67.1
17 pair ZnLa 0,5 54.6
18 pair LaLa 0,2 ¹67.9
19 pair LaLa 0,11 76.8
20 pair La¹Zn 0,8 ¹57.4
21 pair LaZn 0,2 ¹91.5
[image:2.595.303.548.92.625.2]3. Results and Discussion
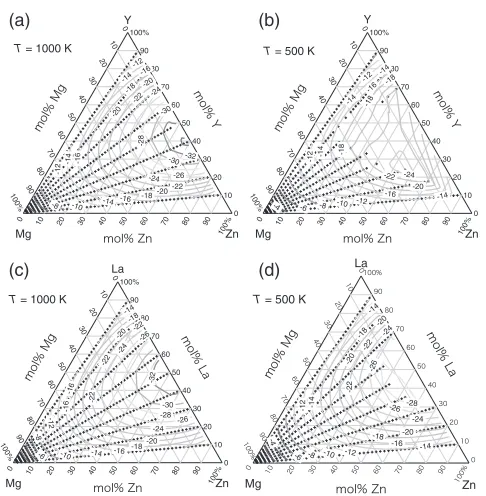
Figure 2 shows the calculated free energy surfaces of
MgYZn hcp phase at (a) T=1000 K and (b) 500 K, and
of MgLaZn hcp phase at (c) 1000 K and (d) 500 K. CVM
calculations were performed for various (x, y) values of
Mg1¹y(RExZn1¹x)y, and safely converged results are denoted
by small crosses in the figure. The free energies have the
lowest values around Y0.4Zn0.6 or La0.5Zn0.5 at 1000 K.
Around this compositional region, the system becomes much more stable compared to pure Mg. These results clearly show a strong attractive interaction between the Y and Zn atoms, or La and Zn atoms. These behaviors did not change at 500 K;
however, we could not obtain information around Y0.4Zn0.6
or La0.5Zn0.5because the CVM calculation did not converge
well. In a highly ordered state in which several correlation functions are nearly 0 or 1, CVM calculation becomes difficult. This situation was also caused by the strong attractive interaction between the RE and Zn atoms. The shapes of the free energy surfaces look similar in the
MgYZn and MgLaZn systems; however there is a
difference in their phase separation behaviors. Figure 3
shows the calculated free energies of Mg1¹y(YxZn1¹x)y, and
Mg1¹y(LaxZn1¹x)y. At the RE-rich corner forx=0.9, namely
Mg1¹y(Y0.9Zn0.1)yand Mg1¹y(La0.9Zn0.1)y, the sectional view
of the free energy curves has a simple parabolic form, as shown in Figs. 3(b) and 3(d). Conversely, the free energies
of Mg1¹y(Y0.5Zn0.5)y and Mg1¹y(La0.5Zn0.5)y, shown in
Figs. 3(a) and 3(c), respectively, show a monotonous
decrease with an increase in the y value. This is a clear
result from the attractive interaction energy between Y and Zn or La and Zn, and the system becomes more stable with a decrease in the Mg content. Here we note that the calculated
free energies of Mg1¹y(Y0.5Zn0.5)y at T=400 and 600 K
exhibit a slight additional positive contribution to the curves
around y=0.3. This represents a less stable condition in a
randomly mixed state, and directs the system towards a phase
separation between the Mg-rich corner and the YZn-rich
side, as pointed out in our previous paper.7) Our previous
work was based on the calculation of phase diagrams (CALPHAD) method, in which the experimental data and
the enthalpy of formation calculated using thefirst-principles
method were analyzed, and thermodynamic properties were
simply predicted at a finite temperature. In this paper, we
confirm phase separation by first-principles calculations
combined with CVM, explicitly considering the finite
temperature effect of configuration.
Here, we will discuss spinodal decomposition accompa-nied by the phase separation. In this study, spinodal
temperatureTspiwas obtained as described below. Instability
of the system can be investigated by the the second derivative of the free energy with regard to the correlation functions. In a stable state, the free energy has the lowest value, and consequently the second derivative of the free energy with
regard to its variables are all positive. Therefore, we defined
Tspi as the temperature at which the smallest eigenvalue of
the second derivative of the free energy changes its sign from positive to negative. The calculated contours of the spinodal
(a) (b)
Mg Zn
Y
0 10 20 30 40 50 60 70 80 90
100% 90 80 70 60 50 40 30 20 10 0 10 0% 0 10 20 30 40 50 60 70 80 90 100%
-8 -10
-12 -12 -14 -14 -14 -16 -16 -16 -18
-18 -20
-20 -20 -22 -22 -24 -24 -26 -28 -30 -30 -32
T = 1000 K
0 10 20 30 40 50 60 70 80 90
100% 90 80 70 60 50 40 30 20 10 0 100% 0 10 20 30 40 50 60 70 80 90 100% Mg Zn Y
-4 -6 -8 -10 -12
-12 -12 -14 -14 -14 -14 -16 -16 -18 -18 -18 -20 -22 -24
T = 500 K
(c) (d)
0 10 20 30 40 50 60 70 80 90
100% 90 80 70 60 50 40 30 20 10 0 100% 0 10 20 30 40 50 60 70 80 90 100% Mg Zn La -6 -8 -10 -12 -14 -14 -16 -16
-16 -18
-18 -20 -20 -22 -22 -22 -24 -24 -26 -26 -28 -30 -32
T = 1000 K
Mg Zn
La
-4
-6 -8 -10 -12
-12 -14
-14 -14
-16
-18
-18 -20
-20 -20 -22 -22 -24 -24 -2 6
-26 -28
T = 500 K
Fig. 2 (a) Calculated free energy surfaces of MgYZn at 1000 K, (b) at
500 K (upper right), (c) MgLaZn at 1000 K, and (d) 500 K. Small
crosses indicate compositions where the CVM calculations are converged.
The contour lines of the free energy are shown up to ¹35 kJ/mol in
decrements of 2 kJ/mol.
-35 -30 -25 -20 -15 -10 -5 0 F (kJ/mol)
Mg1-y-(Y0.5Zn0.5)y
600 K 800 K 1000 K
(a)
-30 -20 -10 0 F (kJ/mol) 1.0 0.8 0.6 0.4 0.2 0.0 y Mg1-y-(La0.5Zn0.5)y600 K 400 K 1000 K
(c)
-30 -20 -10 0 F (kJ/mol) 0.8 0.4 0.0 yMg1-y-(La0.9Zn0.1)y 600 K 800 K 1000 K
(d)
-30 -20 -10 0 F (kJ/mol) 0.8 0.4 0.0 y 600 K 800 K 1000 KMg1-y-(Y0.9Zn0.1)y
(b)
Fig. 3 (a) Calculated free energies of Mg1¹y(YxZn1¹x)y for x=0.5,
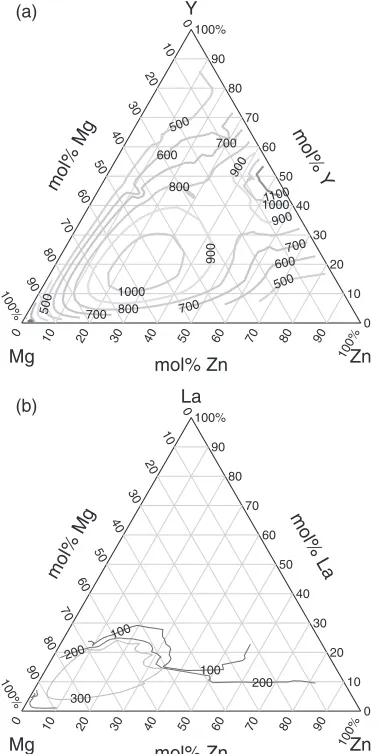
[image:3.595.330.520.71.427.2]temperatures of (a) MgYZn, and (b) MgLaZn are shown
in Fig. 4. For the MgYZn system, the spinodal temperature
reaches 1000 K and above at around Mg0.5Y0.2Zn0.3 and
exceeds 1100 K near Y0.5Zn0.5, and the spinodal region
extends to a broader compositional region. In contrast, for
MgLaZn, the maximum spinodal temperature is 350 K, and
the spinodal region is limited to a small compositional region near the Mg-rich side. This comparison clearly shows the difference in phase separation behavior of these two systems. Taking account of the fact that an LPSO structure is formed
in the MgYZn system and not observed in the MgLaZn
system, it is strongly suggested that phase separation plays a key role in the formation mechanism of an LPSO structure.
Recent studies using transmission electron microscopy have shown that alloying elements such as Zn and RE form
local L12-type clusters in the fcc stacking layers in a hcp
matrix, and proposed plausible space groups ofP63/mcm for
the 14H type andC2/m,P3112 orP3212 for the 18R type.10)
The energies of formation for these structures were estimated
using the first-principles method, as shown in Table 2. All
LPSO structures have a negative values, and a definite
difference in the formation energies could not be found
between RE=Y and RE=La. These values are compared
with the calculated free energies of the hcp phase of the Mg
REZn system at T=300 and 500 K, as shown in Fig. 5.
The dashed line shows a tangent plane touching the free
energy surface of the MgYZn system at 500 K. This
line represents the total energy of the two-phase mixture
composed of the Mg-rich hcp and YZn-rich hcp phases. It
should be noted that the formation energies of these LPSO structures locate above the energy of the two separated hcp
phases. According to our previous calculations,7) the LPSO
structures become slightly stable at finite temperatures
because of the lattice vibration effect. However, the energy
gain is less than 1 kJ/mol and the situation depicted in Fig. 5
does not change. If the energy of formation plays a key role in the formation of an LPSO structure, as in the case of precipitation in the solution phase, an LPSO structure could
also be expected in the MgLaZn system, but actually there
are no such reports to the best of our knowledge. Conversely, there is a pronounced difference in the spinodal temperatures
of the two systems above 1000 K and³350 K for the MgY
Zn and MgLaZn systems, respectively. This contrast in the
behaviors of phase separation and spinodal decomposition may suggest a dominant factor governing the formation of an LPSO structure.
According to the information concerning the
thermody-namic aspect of the MgREZn alloys, it would be denoted
that whether the occurrence of spinodal decomposition in the temperature range where the alloying elements diffuse sufficiently enough is closely related to a key factor of the formation mechanism of an LPSO structure. This spinodal
(a)
(b)
0 10 20 30 40 50 60 70 80 90
100% 90
80 70
60 50
40 30
20 10
0
100%
0 10 20 30 40 50 60 70 80 90 100%
Mg Zn
Y
mol% Mg
mol%
Y
mol% Zn 1100
1000
1000
900 900
900
800
800
700
700
700
700
600
600
500
500
500
0 10 20 30 40 50 60 70 80 90
100% 90
80 70
60 50
40 30
20 10
0
100%
0 10 20 30 40 50 60 70 80 90 100%
Mg Zn
La
mol% Mg
mol% La
mol% Zn
300
200
200
100
100
Fig. 4 Calculated spinodal temperatures of (a) MgYZn and (b) MgLa
[image:4.595.77.269.72.449.2]Zn. The contours of the spinodal temperatures are shown up to 1200 K in increments of 100 K.
Table 2 Calculated energies of formation of 14H RE4Mg35Zn3(P63/mcm),
18R RE4Mg29Zn3(C2/m) and 18R Y4Mg29Zn3(P3112). The unit is for
the mole of atoms in each of the structures.
RE Energy of formation (kJ/mol)
14H (P63/mcm) 18R (C2/m) 18R (P3112)
Y ¹6.1 ¹7.0 ¹7.0
La ¹5.8 ¹6.7 ¹6.7
-14 -12 -10 -8 -6 -4 -2 0 2
F (kJ/mol)
0.12 0.08
0.04 0.00
x in Mg1-7/3xRE4/3xZnx
14H 18R
RE = Y RE = La RE = Y
RE = La
300 K
500 K
Free energy of separated hcp in RE = Y (500 K)
Fig. 5 Comparison of the formation energies of two-phase mixtures of the
[image:4.595.324.526.113.391.2]decomposition may result in the segregation of Y and Zn on the (0001) plane of a hcp matrix, similar to the plate-like G.P.
zone observed in, for example, MgZn alloys. Because the
radius of a rare earth element is, in general, 1722% larger
than that of Mg, the hcp lattice is expanded in the vicinity of these enriched layers. Our previous calculation showed that the introduction of large-radius atoms causes structural transformation from hcp to other long periodic structures in
the finite temperature region.8) The transformation brings
about the periodic introduction of SFs in the hcp lattice. Then, the RE and Zn atoms will segregate to the SFs, mainly because of the difference in chemical potentials for each
element between fcc and hcp.20)This is the so-called Suzuki
effect.21)Consequently, the LPSO structures form through the
spinodal mechanism and structure transformation in the hcp matrix.
4. Conclusions
To investigate the formation mechanism of long period stacking ordered (LPSO) structures, the thermodynamic
properties of the hcp phase of the MgREZn system were
examined by means of the first-principles calculations
combined with the cluster variation method. As RE elements, Y and La were selected because an LPSO structure has been
observed in the MgYZn system, while no such formation
has been reported in the MgLaZn system. The keyfindings
in the present study are as follows:
(1) The calculated free energy surfaces showed a
down-ward slope with an increase in the yvalue of Mg1¹y(RE0.5
-Zn0.5)y. This is mainly because of the strong attractive
interaction energy between the RE and Zn atoms. Both systems show a tendency to phase separation between the
Mg-rich corner and the REZn-rich side.
(2) The spinodal temperatures in the ternary miscibility gaps were examined from a second derivative of the free energies. The critical temperature of the spinodal
decom-position in the MgYZn system reaches 1000 K and above.
In contrast, it is ³350 K at most for the MgLaZn system
and the spinodal region is limited to the Mg-rich side. (3) The formation enthalpies of the 18R-type LPSO
structure with C2/m, P3112 and 14H-type with P63/mcm
were calculated at ground state. All computed structures have negative values, and there seems to be no significant difference in the formation energies of these two ternary systems. It is noteworthy that the evaluated values locate
above the free energies of the Mg-rich and REZn-rich
two-phase separated microstructure.
(4) On the basis of the results obtained in the present study, the LPSO structure in Mg alloys is formed by spinodal
decomposition between the Mg-rich and YZn-rich regions
in the hcp matrix as well as structure transformation from the hcp to other structure in which periodic stacking faults are introduced.
Acknowledgment
We are grateful to Prof. M. H. F. Sluiter for helpful discussions about the CVM calculations. This work was supported by MEXT KAKENHI Grant Number 23109005 and JSPS KAKENHI Grant Number 24656416.
REFERENCES
1) Z. P. Luo and S. Q. Zhang:J. Mater. Sci. Lett.19(2000) 813815.
2) Y. Kawamura, K. Hayashi, A. Inoue and T. Masumoto:Mater. Trans.
42(2001) 11721176.
3) A. Inoue, Y. Kawamura, M. Matsushita, K. Hayashi and J. Koike:
J. Mater. Res.16(2001) 18941900.
4) E. Abe, Y. Kawamura, K. Hayashi and A. Inoue:Acta Mater.50(2002)
38453857.
5) M. Yamasaki, M. Sasaki, M. Nishijima, K. Hiraga and Y. Kawamura:
Acta Mater.55(2007) 67986805.
6) Y. Kawamura and M. Yamasaki:Mater. Trans.48(2007) 29862992.
7) R. Masumoto, H. Ohtani and M. Hasebe: J. Japan Inst. Metals 73
(2009) 683690.
8) S. Iikubo, K. Matsuda and H. Ohtani:Phys. Rev. B86(2012) 054105.
9) H. Yokobayashi, K. Kishida, H. Inui, M. Yamasaki and Y. Kawamura:
Acta Mater.59(2011) 72877299.
10) D. Egusa and E. Abe:Acta Mater.60(2012) 166178.
11) R. Kikuchi:Phys. Rev.81(1951) 9881003.
12) D. de Fontaine:Solid State Physics, Vol. 34, (Academic Press, New
York, 1979).
13) M. H. F. Sluiter, C. Colinet and A. Pasturel:Phys. Rev. B73(2006)
174204.
14) M. H. F. Sluiter, Y. Watanabe, D. Fontaine and Y. Kawazoe:Phys. Rev.
B53(1996) 61376151.
15) G. Kresse and J. Furthmüller:Phys. Rev. B54(1996) 1116911186.
16) G. Kresse and J. Furthmüller:Comp. Mater. Sci.6(1996) 1550.
17) P. E. Blöchl:Phys. Rev. B50(1994) 1795317979.
18) G. Kresse and D. Joubert:Phys. Rev. B59(1999) 17581775.
19) J. P. Perdew, K. Burke and M. Ernzerhof:Phys. Rev. Lett.78(1997)
13961396.
20) H. Ohtani, H. Kakiuchi, K. Matsuda and S. Iikubo: Collected Abstracts of 2012, Spring Meeting of The Japan Institute of Metals, (2012) p. 424.