Phase-Field Modelling on the Formation Process
of LPSO Structure in Mg-Y-Zn System
Toshiyuki Koyama
+1, Yuhki Tsukada and Keisuke Narita
+2Graduate School of Engineering, Nagoya Institute of Technology, Nagoya 466-8555, Japan
It has been proposed that a long-period stacking ordered (LPSO) structure is responsible for the excellent mechanical properties of lightweight alloys of Mg-Y-RE (RE: rare earth elements) system. In this study, the phenomenological simulation model for describing the formation process of the LPSO structure in MgYZn system is constructed by means of the phase-field method. The results obtained are as follows: The proposed phenomenological model is useful for describing the formation process of LPSO structure, where the enrichment of solute elements Zn and Y on stacking fault region induces the growth of the stacking fault itself. This model is able to calculate not only the formation of lamella structure of LPSO phase but also the growth of single stacking fault region in LPSO phase, simultaneously. It is suggested that the lamella spacing of LPSO structure may depend on the initial condition when a LPSO phase nucleates. [doi:10.2320/matertrans.MH201414]
(Received January 6, 2015; Accepted February 10, 2015; Published June 25, 2015)
Keywords: phase-field method, phase decomposition, long-period stacking ordered structure, Gibbs energy, magnesium alloy, stacking fault
1. Introduction
Recently, new alloys of Mg-Zn-RE (RE: rare-earth element) have been developed by Kawamura et al.,14)who identified the presence of a characteristic microstructure, the long-period stacking ordered (LPSO) structure, in these alloys. MgZnRE alloys containing LPSO structures show mechanical properties that are superior to those of other Mg-based lightweight alloys. Therefore, quantitative model-ling of the formation process on LPSO microstructure is important in ensuring a wide variety of structural applications for magnesium alloys.
In the previous study,5)we elucidated that it was difficult to explain the formation of the LPSO structure directly in terms of a spinodal decomposition of the hcp phase in the MgY Zn ternary system. Therefore, as a next approach in the current study, we try to model the formation process of LPSO structure in terms of a preferential solute enrichment on the stacking fault region of hcp crystal structure.
The objective of this study is to construct the phenome-nological simulation model for describing the formation process of the LPSO structure reasonably. Since this is a phenomenological model, it is impossible to understand the physical bases of the formation mechanism of LPSO structure by this model. However, the phenomenological simulation model has a wide range of ability to provide the complex morphology of LPSO microstructure, quantitatively, and it is useful because the simulated microstructure has recently been applied for calculating materials properties in the image-based property calculation on the industrial point of view.6,7) In the current study, we modelled LPSO structure formation in the MgYZn system by means of the phase-field method where the stacking fault in LPSO phase is stabilised by the solute enrichment on it.
2. Simulation Method
We employed the conventional phase-field method810)
coupled with the phase-field dislocation dynamics11) to model the formation process of LPSO structure in the Mg YZn system. Detail of the calculation methods that we used are described below.
2.1 Definition of order parameters
Because our aim was to simulate the a preferential solute enrichment on the stacking fault region of hcp crystal structure in MgYZn ternary system, we used three order parameters: the local yttrium compositioncY(mole fraction of solute atom Y), the local zinc composition cZn (mole fraction of solute atom Zn), and the phase-field order parameter s which describes provability of finding the stacking fault region in the microstructure,11)as independent ones to describe the morphology of LPSO structure. The compositionscXðr; tÞ, (X=Y, Zn) andsðr; tÞare functions of
the local positionr¼ ðx; y; zÞin the microstructure and of the time t. According to the local conservation condition of solute elements, the compositionfield of magnesium is given bycMgðr; tÞ 1cYðr; tÞ cZnðr; tÞ; in this case, we do not
take the vacancy composition into account. The conditions:
sðr; tÞ ¼1andsðr; tÞ ¼0, mean the stacking fault region and the hcp crystal region without defect, respectively. Although a stacking fault is a plane defect with no thickness, it is defined as a thin region with finite thickness of interatomic distance in the theory of phase-field dislocation dynamics.11)
2.2 Evolution equations and evaluation of total free energy
A nonlinear diffusion equation810)for composition fields (CahnHilliard equation) and an evolution equation for the phase-field of stacking fault region (AllenCahn equation) were used in the calculation of the LPSO structure formation:
@cXðr; tÞ
@t ¼ r Mc r
¤Gsys ¤cXðr; tÞ
; X¼Y or Zn;
@sðr; tÞ
@t ¼ L
¤Gsys ¤sðr; tÞ
: ð1Þ
Here, Mcand L are the mobility of atom diffusion and the relaxation coefficient of the phase-field, which are assumed to be a constant in this study for the sake of simplicity. The total +1Corresponding author, E-mail: koyama.toshiyuki@nitech.ac.jp
+2Graduate Student, Nagoya Institute of Technology
Special Issue on Long-Period Stacking Ordered Structure and Its Related Materials II
free energy of the heterogeneous microstructureGsysis given by the expression Gsys=Gc+Egrad+Estr+Esf, where Gc is the weighted average of Gibbs energy of each phase in microstructure,9) E
grad is the gradient energy,810) Estr is the elastic strain energy9,12,13)induced from the coherency strain between the constituent phases, andEsfis an excess energy of stacking fault region caused by the crystal defect. According to the conventional phase-field method,9,10) Gcis evaluated by the following form:
Gc¼
Z
r½G
¡
cf1pðsÞg þG
LPSO
c pðsÞ þWg
2ðsÞdr;
pðsÞ s2ð32sÞ; gðsÞ sð1sÞ; ð2Þ
where the integration range is set to be a unit volume of the microstructure. The G¡c is the Gibbs energy density of disorder hcp phase in MgYZn ternary system, which is expressed as a sub-regular solution approximation as follows:14)
G¡c ¼0GMgðTÞcMgðr; tÞ þ0GYðTÞcYðr; tÞ þ0GZnðTÞcZnðr; tÞ
þLMg,YcMgðr; tÞcYðr; tÞ þLMg,ZncMgðr; tÞcZnðr; tÞ
þLY,ZncYðr; tÞcZnðr; tÞ
þLMg,Y,ZncMgðr; tÞcYðr; tÞcZnðr; tÞ
þRTfcMgðr; tÞlncMgðr; tÞ þcYðr; tÞlncYðr; tÞ
þcZnðrÞlncZnðr; tÞg; ð3Þ
cXis the composition of a given component X(=Mg, Y or Zn), and the relationshipcMg+cY+cZn=1 is assumed. The
Ris the gas constant,Tis the absolute temperature,0G XðTÞis
the Gibbs energy of the pure element X(=Mg, Y or Zn), and
LA,Bis the interaction parameter between elements A and B, as expressed in the RedlichKister polynomial form in the CALPHAD method,15,16)
LA,B¼ð0ÞLA,BðTÞ þð1ÞLA,BðTÞðcAcBÞ
þð2ÞL
A,BðTÞðcAcBÞ2
þð3ÞL
A,BðTÞðcAcBÞ3þ ; ð4Þ
in which the description of ðr; tÞis omitted. The coefficients ðiÞL
A,B, ði¼0;1;2; Þin the right-hand side of the above
equation are functions ofT.LMg,Y,Zn is the coefficient of the excess mixing enthalpy term unique to ternary system, which is given by the expression:
LMg,Y,Zn¼ð0ÞLMg,Y,ZncMgþð1ÞLMg,Y,ZncY
þð2ÞL
Mg,Y,ZncZn: ð5Þ
Although, in general, the coefficientsðiÞL
Mg,Y,Zn,ði¼0;1;2Þ
are functions of the temperature, they are regarded as constants in the current work.14)
GLPSO
c in eq. (2) is the Gibbs energy density of the solute
rich region formed on the stacking fault in LPSO phase. Henceforth this solute rich region on the stacking fault is denoted by “LPSO compound phase” in this paper. Note that this LPSO compound phase is a hypothetical phase introduced in the current study for the convenience of the phase-field simulation, and the phase-field of LPSO com-pound phase is also described bysðr; tÞwhich is a phase-field of the stacking fault region.Win eq. (2) is an energy barrier between¡hcp phase and LPSO compound phase to avoid the mixing of these two phases.9,10)We assumed the expression of GLPSO
c as
GLPSOc A0þA1ðcYc0YÞ2þA2ðcZnc0ZnÞ2; ð6Þ
wherec0
Yandc0Znare the equilibrium compositions of LPSO
compound phase. The coefficientsA0,A1andA2are functions of temperature, but we assumed them to be constants in this study because the temperature considered is 573 K only in the work. The defect energy of stacking fault region Esf is calculated by
Esf¼
Z
rAsfpðsÞdr; ð7Þ
where the coefficientAsfis also assumed to be constant. The gradient energy811)with respect to compositionfield and phase-field can be expressed as follows:
Egrad¼
Z
r
1
2¬cðrcYÞ
2þ1
2¬cðrcZnÞ 2
þ1
2¬cðrcMgÞ
2þ1
2¬sðn rsÞ 2 dr ¼ Z r
¬cðrcYÞ2þ¬cðrcZnÞ2þ¬cðrcYrcZnÞ
þ1
2¬sðn rsÞ 2
dr; ð8Þ
where, for the sake of simplicity, we assumed that the gradient energy coefficients are constants, and the relation-shipcMgðr; tÞ 1cYðr; tÞ cZnðr; tÞis used in the
deriva-tion of the above equaderiva-tion. The last term in the integrant of eq. (8) is the gradient energy determined in the phase-field dislocation dynamics.11)
The elastic strain energy is evaluated by means of the following equation, based on the phase-field microelasticity theory:12,13)
Estr ¼ 1 2
Z
r
Cijkl¾elijðr; tÞ¾elklðr; tÞdr
¼1
2
Z
rCijklf¾ c
ijðr; tÞ ¾ 0 ijðr; tÞgf¾
c
klðr; tÞ ¾ 0
klðr; tÞgdr
¼1
2
Z
r
Cijklf¾cijþ¤¾ c
ijðr; tÞ ¾0ijðr; tÞgf¾ c klþ¤¾
c klðr; tÞ
¾0
klðr; tÞgdr; ð9Þ
We assumed the elastic stiffnessCijkl to be constants and we used the value for pure magnesium, i.e. we considered the anisotropic elastic medium of the hcp crystal structure. The eigen strain¾0
ijðr; tÞis evaluated by using the following
equations as functions of composition field and phase-field:
¾0
ijðr; tÞ ¼¾00ijsðr; tÞ þ©YijcYðr; tÞ þ©ZnijcZnðr; tÞ: ð10Þ
The ¾00
ij is defined based on the phase-field dislocation
dynamics11)as
¾00 ij ¼
1
2dfbinjþbjnig ¼ 1 2d
0 b 0
b 0 0
0 0 0
2 6 4
3 7
5; ð11Þ
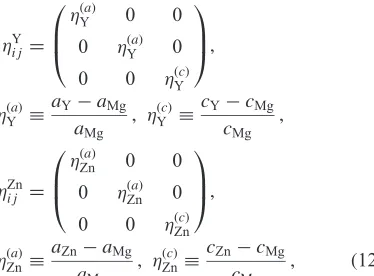
where b is a Burgers vector of Shockley partial disloca-tion and d is a interatomic distance between (0001) plane of Magnesium. The ©Y
ij and ©Znij in eq. (10) are defined
©Y ij ¼
©ðaÞ
Y 0 0
0 ©ðYaÞ 0
0 0 ©ðYcÞ
0 B @
1 C A;
©ðaÞ
Y
aYaMg aMg
; ©ðYcÞ cYcMg cMg
;
©Zn ij ¼
©ðaÞ
Zn 0 0
0 ©ðZnaÞ 0
0 0 ©ðZncÞ
0 B @
1 C A;
©ðaÞ
Zn
aZnaMg aMg
; ©ðZncÞ cZncMg cMg
; ð12Þ
where Vegard’s low is assumed, and a(X) and c(X) are the lattice constants of the respective component X(=Mg, Y or Zn) along the a-axis and c-axis of the hcp structure, respectively.5) The total strain ¾c
ijðr; tÞ is defined by ¾c
ijðr; tÞ ¾ c ijþ¤¾
c
ijðr; tÞ, where¾ c
ij is the spatial average of ¾c
ijðr; tÞ, and¤¾cijðrÞis the deviation from¾cij.10)The value of ¤¾c
ijðr; tÞis evaluated by means of the mechanical equilibrium
equation8,9)with the numerical data for¾0
ijðr; tÞandCijkl. The value of¾c
ij is determined from the eigen strain¾0ijðr; tÞand
the boundary condition that the surface traction on the body of the entire alloy is equal to zero.8)
Finally, how to estimate the numerical value of (A0+Asf) is explained. The value of (A0+Asf) is determined by using the Gibbs energy of LPSO single phase.17)The Gibbs energy of LPSO phase, G0;LPSOMg:Y:Zn, in MgYZn system is available from thermodynamic Gibbs energy parameter determined by Calphad approach,17) and G0;LPSO
Mg:Y:Zn is divided into four
energies: Gc, Egrad, Estr and Esf, because we consider the LPSO compound phase in this study. Therefore, the energy balance for LPSO single phase provides
Z
r
G0;LPSOMg:Y:Zndr¼GcþEgradþEstrþEsf: ð13Þ
Substituting eqs. (2) and (6) into eq. (13) gives Z
rðA0þAsfÞpðsÞdr
¼
Z
r
G0;LPSOMg:Y:ZnG¡cf1pðsÞg Wg2ðsÞ
fA1ðcYc0YÞ2þA2ðcZnc0ZnÞ2gpðsÞ
" #
dr:
ðEgradþEstrÞ ð14Þ
Calculating this equation numerically on the unit structure of LPSO phase, we obtain the value of (A0+Asf), where R
rpðsÞdr¼0:27, that is a phase fraction of LPSO compound phase in a unit structure of LPSO phase, is used.1719)
2.3 Calculation conditions
The numerical values of the parameters that we used in this study are listed in Table 1. In the study, we performed a two-dimensional simulation and we therefore assumed a plane strain condition for calculating the elastic quantities, i.e., the same morphology for the two-dimensional microstructure is continued congruently along the depth direction. A periodic boundary condition was also assumed for the purpose of simulating the two-dimensional microstructural changes. We used the conventional finite-difference method with a structured grid for the numerical calculation of the evolution equations. Each distance was normalized by the length of the
unit cellb1for thefinite-difference method. The conditions of two-dimensional difference grid size are 128©128 for Fig. 1 and 256©256 for Fig. 2, respectively. These conditions are determined because more than two difference unit cells are required to resolve the finite thickness of the stacking fault region for accurately calculating the stressfields around it.
For the sake of simplicity, we also assumed that the each solute component has the same diffusion constant D. The aging timetwas normalized by the quantityD/b1, so that the dimensionless time was given by the expression tA=tD/b1. We could therefore estimate8)the value of the aging time t
from the dimensionless time tA provided that we knew the value ofD. Furthermore, as long as we discuss the simulation results exclusively in terms of the dimensionless timetA, we do not need to know the value ofD.8)
3. Simulation Results and Discussions
[image:3.595.99.286.70.208.2]In this section, we explain the results of phase-field
Table 1 Numerical values used in the calculations.
Calculation area/nm2 10©10
Thermodynamic parameters14)/J·mol¹1
(0)L
Mg,Y ¹37000+28T
(1)L
Mg,Y ¹14000+7.75T
(2)L
Mg,Y 4500¹2T
(3)L
Mg,Y 6000¹T
(0)L
Mg,Zn ¹27500+40T
(1)L
Mg,Zn 16000¹15T
(2)L
Mg,Zn ¹10000+12T
(0)L
Y,Zn ¹143000+49T
(1)L
Y,Zn 93800¹35T
(2)L
Y,Zn 20300¹18T
(0)L
Mg,Y,Zn 364700
(1)L
Mg,Y,Zn ¹117000
(2)L
Mg,Y,Zn ¹119700
Composition gradient energy coefficient,
/J·m2·mol¹1 ¬c ¬s
1.0©10¹14 1.0©10¹14
Elastic coefficients20)/1011Pa Mg
C11 0.597
C33 0.617
C44 0.164
C12 0.262
C13 0.217
Lattice parameters20)/nm Mg Y Zn
a 0.32094 0.3647 0.2665
c 0.52105 0.57306 0.49468
Burgers vector,20)b/nm 0.1504
Interatomic distance between slip planes,20)d/nm 0.2605
Composition of LPSO compound phase1719) c0
Y c0Zn
0.1 0.05
Thermodynamic parameters
/J·mol¹1 A0+Asf A1 A2
simulation on the formation of LPSO structure and the energetic analysis on the stability of lamella spacing of LPSO structure.
3.1 Solute enrichment behaviour on stacking fault region
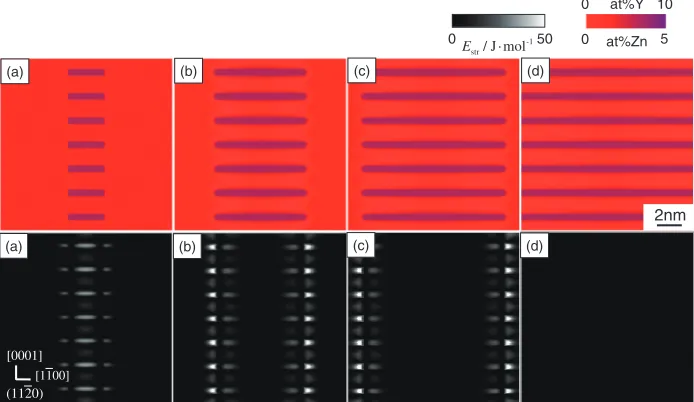
Figure 1 is a two-dimensional simulation on the ð1120Þ
plane of the hcp structure in Mg4 at%Y2 at%Zn alloy at 573 K, which shows the enrichment behaviour of solute elements Zn and Y into the stacking fault region. Upper and lower rows in Fig. 1 indicate the compositionfield and elastic strain energy field, respectively. The temporal evolution of the microstructure is shown in Figs. 1(a) through 1(d). The local composition and the elastic strain energy density are indicated by means of the color and gray scales indicated in Fig. 1, respectively.
The initial state [Fig. 1(a)] is a supersaturated solid solution of hcp phase on which seven stacking fault nuclei with composition Mg10 at% Y5 at% Zn,1719)i.e. a LPSO compound phase, are located. Since the region of LPSO compound phase overlaps with the stacking fault region, we set the phase-fields(r)=1 on the LPSO compound phase and
s(r)=0 outside it in Fig. 1(a). Small composition fl uctua-tions of «1 at% Y and«1 at% Zn are imposed by applying computer-generated random numbers at the initial state.
With the enrichment of solute elements Zn and Y on the stacking fault region, it spreads in a lateral direction and then the solute enrichment behaviour on the stacking fault region progresses continuously. When we focus on the elastic strain energy field, the large lattice distortion is induced by the dislocations located on the each side edge of stacking fault region. As the elastic field acts as a long range interaction
(d) (c)
(b) (a)
(a) (b) (c) (d)
2nm
[0001]
[1100]
(1120)
0 at%Zn 5 at%Y
0 10
0 -150
str/ J·mol
E
Fig. 1 Phase-field simulation of solute enrichment behavior of Zn and Y on the stacking fault region during isothermal aging at 573 K. Upper and lower rows indicate the compositionfield and elastic strain energyfield, respectively; (a)tA=0, (b)tA=0.07, (c)tA=0.13 and (d)tA=0.2.
(d) (c)
(b) (a)
0 at%Zn 5 at%Y
0 10
0 30
(a) (b) (c) (d)
10nm
[0001] [1100]
(1120)
-1 str/ J·mol
E
[image:4.595.125.472.73.274.2] [image:4.595.125.471.338.539.2]force, the elastic field among dislocations influences each other.
Figure 2 shows the typical simulation result of this study, where we do not consider the several stacking fault nuclei but a single stacking fault nucleus as an initial condition. Other initial conditions and the representation offigure are the same as Fig. 1, but the calculation area is set wider. Although the stacking fault is single, the stacking fault region spreads in a lateral direction with enrichment of solute elements.
The originality of this simulation method is the definition of order parameter sðr; tÞ, which is not only the phase-field of stacking fault region but also the phase-field of LPSO compound phase. Therefore, the driving force for the formation of LPSO compound phase induces the growth of the stacking fault region.
3.2 Lamella spacing of LPSO structure dependent on the initial condition
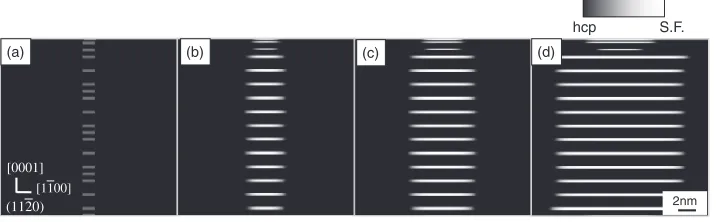
Figures 3 and 4 are the simulation results dependent on the
[image:5.595.121.479.73.184.2]initial condition of the position on which the stacking fault nuclei are located. The phase-field of the stacking fault is indicated by gray scale, and the black and white parts are the hcp crystal without defect and the stacking fault region, respectively. The degree of randomness of the initial position of the stacking fault nuclei in Fig. 4 is larger than that of Fig. 3.
In the case of Fig. 3, it is observed that lamella spacing of the LPSO structure becomes uniform with aging. Note that the stacking fault having smaller spacing at the initial stage disappears with aging. On the other hand, it is interesting the initial nonuniformity of lamella spacing of the LPSO structure remains at the later stage of aging in Fig. 4. As a consequence, there exists a stable lamella spacing of LPSO structure but its stability in lamella spacing seems to be not so high. Therefore, the lamella spacing of LPSO structure may depend on the initial condition when the LPSO structure nucleates. This inhomogeneity with respect to lamella spacing is often observed in experiments.4,18,19)
3.3 Energetic analysis of the lamella spacing of LPSO structure
The red circles in Fig. 5 show the numerical calculation results of the relation between total free energy of LPSO structure and its lamella spacing. Although there is a numerical computation error slightly, it is recognized that the global shape of the total free energy is a downwardly convex curve, and the minimum value seems to be located within the lamella spacing from 1.5 nm to 2.0 nm. In particular, the curvature around this region is so small that the energetic stability of LPSO structures taking lamella spacing from 1.5 nm to 2.0 nm is not so different. It is interesting that a lot of experimental data18,19) of lamella
2nm
(d) (c)
(b) (a)
[0001]
[1100]
(1120)
hcp S.F.
Fig. 3 Phase-field simulation of the LPSO lamella structure formation dependent on the initial configuration of stacking faults (at 573 K). White part indicates the phase-field of stacking fault region; (a)tA=0, (b)tA=0.1, (c)tA=0.2 and (d)tA=0.5.
2nm
(d) (c)
(b) (a)
[0001]
[1100]
(1120)
hcp S.F.
Fig. 4 Phase-field simulation of LPSO lamella structure formation dependent on the initial configuration of stacking faults (at 573 K). The initial configuration of stacking faults is different from that of Fig. 3; (a)tA=0, (b)tA=0.1, (c)tA=0.2 and (d)tA=0.5.
1 1.5 2 2.5 3 3.5 4
-4500 -2500
-2900
-3300
-3700
-4100
Lamella spacing, L /nm
T
o
tal free energy of LPSO phase,
Gsys
/J
mol
-1
[image:5.595.120.474.233.340.2]spacing of LPSO structure such as 14H and 18R are included in this range. It has been pointed out from the theoretical calculation on the stability of LPSO phase that the formation energies of LPSO phases with different lamella spacing are not greatly changed.21)Since the Calphad data of formation energy of LPSO phase G0;LPSOMg:Y:Znis employed for estimating the free energy of LPSO compound phase in this study, the calculation result of Fig. 5 is a reconfirmation of the point above mentioned, but it is also a good confirmation that the estimation of free energy of the LPSO compound phase introduced in a current work is reasonable.
4. Conclusions
In this study, we modelled the formation process of LPSO structure in MgYZn system by means of the phase-field method where the stacking fault region stabilised by the solute enrichment on it. The results we obtained are as follows:
(1) The phenomenological model based on the phase-field method proposed in this work is useful for describing the formation process of LPSO structure, where the enrichment of solute elements Zn and Y on stacking fault region induces the growth of stacking fault itself. (2) This simulation model can calculate not only the formation of lamella structure of LPSO phase but also the growth of single stacking fault region in LPSO phase, simultaneously.
(3) There exists a stable lamella spacing of LPSO structure but its stability is not so high. Therefore, the lamella spacing of LPSO structure may depend on the initial condition when a LPSO phase nucleates.
Acknowledgment
This work was supported by a Grant-in-Aid for Scientific Research on Innovative Areas: “Materials science on
synchronized LPSO structure (Grant Number 23109001, 26109709)”.
REFERENCES
1) Y. Kawamura, K. Hayashi, A. Inoue and T. Masumoto:Mater. Trans.
42(2001) 11721176.
2) A. Inoue, Y. Kawamura, M. Matsushita, K. Hayashi and J. Koike: J. Mater. Res.16(2001) 18941900.
3) E. Abe, Y. Kawamura, K. Hayashi and A. Inoue:Acta Mater.50(2002) 38453857.
4) M. Yamasaki, M. Sasaki, M. Nishijima, K. Hiraga and Y. Kawamura: Acta Mater.55(2007) 67986805.
5) K. Narita, T. Koyama and Y. Tsukada:Mater. Trans.54(2013) 661 667.
6) T. Koyama:Sci. Tech. Adv. Mater.9(2008) 013006. 7) T. Koyama:ISIJ Int.52(2012) 723728.
8) T. Koyama: Computational Materials Design: Simulation of Micro-structures, (Uchida Rokakuho Publishing, Tokyo, 2011).
9) T. Koyama and T. Takaki: Introduction to Phase-field Method, (Maruzen, Tokyo, 2013).
10) N. Provatas and K. Elder:Phase-Field Methods in Materials Science and Engineering, (Wiley-VCH, Weinheim, Germany, 2010). 11) Y. U. Wang, Y. M. Jin, A. M. Cuitiño and A. G. Khachaturyan:Acta
Mater.49(2001) 18471857.
12) T. Mura: Micromechanics of Defects in Solids, 2nd Rev. ed., (Kluwer Academic, Dordrecht, Netherlands, 1991).
13) A. G. Khachaturyan:Theory of Structural Transformations in Solids, (Dover Publications, New York, NY, USA, 2008).
14) M. Matsuda, S. Ii, Y. Kawamura, Y. Ikuhara and M. Nishida:Mater. Sci. Eng. A393(2005) 269274.
15) T. Abe:Computational Materials Design: Computational Thermody-namics, (Uchida Rokakuho Publishing, Tokyo, 2011).
16) N. Saunders and A. P. Miodownik: CALPHAD (Calculation of Phase Diagrams): A Comprehensive Guide, (Pergamon Science, Oxford, United Kingdom, 1998).
17) J. Gröbner, A. Kozlov, X. Y. Fang, J. Geng, J. F. Nie and R. Schmid-Fetzer:Acta Mater.60(2012) 59485962.
18) E. Abe, Y. Kawamura, K. Hayashi and A. Inoue:Acta Mater.50(2002) 38453857.
19) D. Egusa and E. Abe:Acta Mater.60(2012) 166178.
20) Japan Institute of Metals:Metals Data Book, 4th ed., (Maruzen, Tokyo, 2004).