Munich Personal RePEc Archive
Strategic Default Induced by Loan
Modification Programs
Li, Xianghong and Zhao, Xinlei
Department of Economics, York University, Credit Risk Analysis
Division, Office of the Comptroller of the Currency
31 August 2016
Online at
https://mpra.ub.uni-muenchen.de/73594/
Strategic Default Induced by Loan Modification Programs
*Xianghong Li Department of Economics
York University
and
Xinlei Zhao
Credit Risk Analysis Division Office of the Comptroller of the Currency
August 2016
Abstract
We use the October 2008 Countrywide legal settlement as a natural experiment to investigate how borrowers may change their payment behavior to be eligible for loan modifications. We find that the Countrywide modification program induces strategic default among both borrowers current in their loan payments and those already in payment delinquency before the settlement. By January 2009, modification-induced strategic default is about nine percentage points, on a base default rate of 30 percent, and such strategic behavior is more severe among riskier loans. These findings have implications on designs of loan modification programs that are different from the existing literature.
JEL Classification: G18, G21
Keywords: Loan modification, mortgage modification program, strategic default, Countrywide legal settlement.
*
1. Introduction
Loan modification has long been adopted by banks as a loss prevention and recovery
method, and it has become more commonly used since the latest financial crisis. It was
also among the major tools by the federal governments to help homeowners during the
housing market downturn (for example, the Home Affordable Modification Program, or
HAMP). Since modifications are mainly targeted at troubled loans, financial hardship
(delinquency or at least being in danger of falling behind on loan payments) is among the
requirements of most loan modification programs. Such an eligibility requirement could,
however, possibly induce strategic default behavior, i.e., borrowers intentionally missing
payments to qualify for modifications with very favorable terms. It is a potential issue
widely acknowledged among lenders, policy makers, and academics.2 Furthermore, there
is a general consensus that strategic default is costly, as it not only increases the cost of
modification programs, but may also weaken the moral standard of society: if some
debtors are perceived as being bailed out unjustly, more strategic default might follow
(e.g., Guiso, Sapienza, and Zingales [2011]).
The scope of such behavior is difficult to assess because the true cause behind any
default is largely unobservable. Further, government loan modification programs (such as
HAMP) are often applied nationwide, so there is a lack of a counterfactual. On the other
hand, proprietary modification programs by individual banks are rather sporadic, making
it difficult to draw an informative inference. A good understanding of
modification-induced strategic default is important, however, as it can help design effective loan
modification programs so that strategic default can be minimized. Deep insight into such
behavior also constitutes a major component of a full evaluation of the economic impact
of any government-sponsored loan modification proposals (for example, Calomiris,
Higgins, and Mason [2011]). Although the worst days of the housing market may be
over, modification-induced strategic default is by no means confined to the mortgage
sector and can happen in any segments with rising default risk. A thorough analysis of
modification-induced default thus bears tremendous implications for banking practice
and public policy decisions in general.
2
For example, “Four AGs Say Foreclosure Settlement Proposal Promotes Strategic Default” by Jon Prior,
We rely on the empirical evidence arising from the Countrywide legal settlement
to assess the extent of modification-induced strategic default. Countrywide was among
the largest mortgage lenders in the United States, if not the largest, during the booming
years of the latest housing bubble.3 Under a multi-state settlement on October 6, 2008,
Countrywide committed to offer unsolicited loan modifications to borrowers who have
difficulty making mortgage payments. The settlement, affecting Countrywide but not
other lenders, has been applied nationally from the beginning, and it provides a valuable
natural experiment for studying modification-induced strategic behavior.
The existing literature (for example, Mayer, Morrison, Piskorski, and Gupta
[2014], hereafter MMPG) has exploited the exogenous shock of the Countrywide legal
settlement and provided evidence supporting the existence of modification-induced
strategic default. Our study contributes to the literature by adopting a broader view of
induced strategic default. Specifically, MMPG investigates
modification-induced strategic default only among borrowers who were current in payments before the
program announcement. They focus on the impact of the modification program on the
transition rate from current to default. We argue that the modification program has a
second form of impact, namely reducing the rate of transition from default back to
current among borrowers who were already in payment delinquency before the
settlement. Our evidence indicates that the second form of impact is as important as the
first one. By investigating loans both current and delinquent upon modification
announcement, we reveal new evidence on modification-induced behavior. Such
evidence casts serious doubt on the effectiveness of the practice of incorporating rigorous
audits into loan modification programs as a preventive measure to deter strategic
behavior.
Our primary dataset is DataQuick, which is a monthly loan-level panel dataset
covering over 95 percent of private-label mortgage-backed securities.4 We include in our
3
For example, Countrywide’s market share in the loans covered by our primary dataset, DataQuick, exceeds 17 percent, while the market share of the second largest lender is less than 6 percent.
4
study mortgages that are likely to qualify for the modification program.5 We directly
estimate the fraction of modification-induced default relying on mortgage fixed effect
models. We find that the modification program induces significant strategic default
among the likely eligible loans. By the fourth month since the modification
announcement, the estimated induced default from our base sample is about nine
percentage points among Countrywide loans, relative to the base default rate of 30
percent among loans by other lenders. There is clear evidence that the modification
program induces strategic default not only among loans current in their payments, but
also among borrowers who were already past due in their payments before the
modification announcement. In general, we find that modification-induced strategic
default is rather widespread, and this behavior seems to be more serious among more
risky loans, such as those interest only loans, balloon loans, and those already delinquent
in the mortgage payment at the time of the modification announcement.
Our evidence thus suggests that it is very difficult even for a program requiring
rigorous audits, such as HAMP, to effectively address the problem of strategic default.
HAMP requires borrowers to submit many documents, such as proof of their occupancy
status, an affidavit of financial hardship, and income verification. The lengthy process of
audit may be one of the reasons leading to its ineffectiveness, and HAMP has been
heavily criticized for not doing much to mitigate the housing market problem.6 In spite of
being too slow, HAMP may be justified as a way to minimize strategic default, as argued
in MMPG. Our evidence, however, casts much doubt on such an argument, as borrowers
already delinquent on their mortgage payments before the modification announcement
can most likely survive rigorous audits. In fact, our estimates suggest that roughly half of
the loans defaulted strategically in the base sample are already in payment delinquency
immediately before the announcement of the Countrywide settlement.
Besides adding to the literature on strategic default, our study connects to the
stream of literature examining the strategic behavior resulting from government bailouts
5
There is some uncertainty on whether a borrower may qualify for the modification. For example, assessing fair market value of a residential property is by no means an easy task, so the eligibility criterion of 75 percent loan-to-value ratio (LTV) does not create a clear cutoff point.
6
and bank regulation,7 the strategic behavior by lenders to take advantage of the
securitization market,8 loan modification,9 and potential solutions to strategic default.10
The rest of the paper proceeds as follows. Section 2 reviews the existing studies
on strategic default. The Countrywide legal settlement, the subprime market, and the
market share of Countrywide are discussed in section 3. We elaborate on the data source,
data construction, and graphical patterns in section 4, and describe our statistical models
in section 5. Section 6 presents the empirical results, and finally, we draw conclusions in
section 7.
2. Existing Studies and Findings on Strategic Default
There is a broad range of literature on strategic default. One stream of studies focuses on
how negative home equity is related to mortgage default (Quercia, Ding, and Ratcliffe
[2009]; Foote, Gerardi, and Willen [2008]; Bajari, Chu, and Park [2008]; and Guiso,
Sapienza, and Zingales [2011]). These papers document a strong link between negative
home equity and default. Further, the link seems to be much stronger during the latest
financial crisis than earlier periods. Another stream of research investigates the strategic
choice of default among different types of debts by the same person (Cohen-Cole and
Morse [2009]; Elul, Souleles, Chomsisengphet, Glennon, and Hunt [2010]; Jagtiani and
Lang [2010]; and Anderson et al. [2013]). These papers generally suggest that borrowers
who default on their mortgages are often current on their other debts. In addition, other
studies use different approaches to show the existence of strategic default, for example,
by linking default behavior with state recourse laws (Ghent and Kudlyak [2009]) or
documenting borrower behavior prior to mortgage default (Jennings [2011]11).
Therefore, there is quite extensive evidence on the existence of strategic default;
that is, at least some default is driven more by choice than by economic hardship. None
7
For example, Agarwal et al. (2012), Farhi and Tirole (2009), and Poole (2009).
8
For instance, Mian and Sufi (2009), Keys et al. (2010, 2012), Rajan et al. (2010), Berndt and Gupta (2009), and Purnanandam (2010).
9
For example, Mason (2007); Thompson (2009); Mayer, Morrison, and Piskorski (2009); Piskorski et al. (2010); and Agarwal, Amromin, Ben-David, Chomsisengphet, and Evanoff (2011).
10
For example, Edmans (2010).
11
of the above studies, however, particularly addresses the extent of this strategic behavior
induced by mortgage modification programs. MMPG is the first and only study so far that specifically examines modification-induced strategic default, and it is also the first to
explore this issue using the Countrywide legal settlement as a natural experiment. MMPG
provides strong evidence suggesting that loan modification programs can induce strategic
default. As discussed in the introduction, its research design does not, however, capture
the full extent of strategic default. To better understand the empirical setting of strategic
default and analyze the modeling approaches, we borrow a bathtub theory, which is often
used in macroeconomics and labor economics to model unemployment (e.g. Shimer
[2012]).
In a bathtub analogue, the fraction of the bathtub filled with water is dynamically
determined by both the water inflow rate and outflow rate. In an unemployment study,
the fraction of bathtub filled with water is the unemployment rate, and analogously, it is
the fraction of loans being current in our case.12 In an unemployment study, the water
inflow consists of transitions from employment to unemployment and the outflow
consists of transitions from unemployment back to employment. In our case, the water
outflow consists of loans transiting from current to default, and the water inflow consists
of loans transiting from default back to current, i.e., the cure of defaulted loans.
MMPG models the transitions from current to default, but completely ignores the
transitions from default back to current. They essentially estimate a discrete time
single-spell (being current) hazard model.13 Its focus of interest, the “rollover rate” from current
to 60 days past due (DPD), is the hazard rate of becoming default given that it is current
in the previous period (that is, the water outflow rate in the bathtub analogue.)
The implications of modification-induced strategic default are different among
loans current or delinquent upon the modification announcement. For loans current
12
At the first glance, it seems to be more natural to link the bathtub water to defaulted loans as mortgage default is the focus of this study. Our choice of current loans, however, can give a natural interpretation to the central concept in MMPG, namely, the rollover rate. In our set-up, the rollover rate is equivalent to the water outflow speed (the hazard rate in duration analysis).
13
before the modification announcement, modification-induced strategic default involves
borrowers who intentionally stop payments (default) to become eligible for mortgage
modification. On the other hand, among loans already delinquent upon announcement,
modification-induced strategic default implies that some borrowers would continue
missing the payments to remain eligible and take advantage of the modification program.
These two types of strategic behavior have different policy implications. While the first
type of strategic defaulters can probably be detected by a rigorous audit, identifying the
second type of strategic defaulters might be difficult even with a rigorous audit. This is
because efforts put in remedy activities, such as job searches, are unobservable. Over 30
percent of the loans in our base sample (as defined in section 4.2) have payments past
due, with the overwhelming majority of them more than 60 DPD in the month right
before the modification announcement. Sample cure rates, i.e., the rate of becoming
current given that the loan is in default in the previous period, (that is, the water inflow in
the bathtub analogue) are substantial both before and after the settlement, and our
estimates indicate that the modification announcement indeed induces strategic default
among borrowers who were already in payment delinquency before the modification
announcement.
The substantial cure rates complicate the conversion of the key parameter in
MMPG, the effect of modification on “rollover rate,” to the fraction of loans induced into strategic default by the modification program, the parameter of ultimate interest to banks and policy makers. We discuss this issue in greater detail in section 6 when we
compare our estimates with those in MMPG.
3. Countrywide Legal Settlement, Subprime Markets, and Countrywide's
Market Share
3.1. Countrywide Legal Settlement
Under the allegation that it “implemented a deceptive scheme through misleading
marketing practices designed to sell risky and costly loans to homeowners,” Countrywide
entered a multi-state settlement on October 6, 2008. Following the settlement,
namely mortgages that were 60+ DPD or otherwise likely to become delinquent. The
terms of the settlement have been applied nationally from the beginning.
The settlement covers subprime hybrid adjustable-rate mortgages (including 2, 3, 5, 7, and 10 hybrid, ARM hereafter),14 all pay option adjustable-rate mortgages, and
subprime fixed-rate mortgages. Qualified loans under the settlement are eligible for
several types of loan modifications, including elimination of the negative amortization
feature; optional introduction of a 10-year interest-only period on the loan; interest rate
reduction, with an annual increase subject to an interest rate cap of 7 percent;15 and, for
certain option ARM borrowers, the possibility of a permanent principal write-down.
Obviously, the modification terms appear extremely favorable and the benefits last
through the life time of the loan. How borrowers change their behavior to take advantage
of these benefits is an empirical question.16
Countrywide agreed to implement the modification program starting December 1,
2008, by contacting eligible borrowers proactively. Countrywide was supposed to send a
communication to borrowers whose mortgage payments were scheduled to change due to
interest rate resets, inviting them to contact Countrywide if they could not afford the new
payments. The foreclosure process for any potentially eligible borrowers was also
expected to be suspended until modification eligibility had been determined.
14 A 2, 3, 5, 7, or 10 hybrid ARM’s fixed-rate loan period is offered for a maximum of 2, 3, 5, 7, or 10
years. After this time is up, the loan reverts to an adjusted rate, which runs the remainder of the mortgage loan time.
15
A reduction of interest rate to the introduction rate or lower (but no less than 3.5 percent) during the first five years, and a fixed-rate at the higher of 1) the Fannie rate and 2) the introductory rate for the remainder years. By the end of the fifth year, if the new payment is still not affordable, an extension of two more years of reduced interest rate is available.
16
3.2 Subprime Mortgages and the Market Shares of Countrywide
Hybrid ARMs include a fixed interest rate for an initial period of time, which floats
thereafter. The date that a hybrid ARM shifts from fixed-rate to floating-rate is known as
the reset date. For example, ARMs 2/28 (ARMs 3/27) have fixed rates in the first two
(three) years and floating rates for the remaining 28 (27) years (these ARMs are referred
to as ARM2s and ARM3s hereafter). The introductory fixed interest rates for the first two
to three years are typically below the market interest rates and the interest rates usually
increase significantly upon reset. ARMs had been in existence for a long time before
2000, and the popularity of such mortgages increased dramatically after 2000. Since such
mortgages enable borrowers to qualify for a much larger loan (i.e., by taking on more
debt) than otherwise would be possible under the conventional fixed-rate mortgages,
many subprime borrowers who could not afford conventional fixed-rate mortgages
resorted to such loans, thus making these mortgages very risky.
We include in this study loans identified as subprime in DataQuick. Note that
DataQuick covers only loans securitized by private label issuers, that is, neither loans on
banks’ books (non-securitized loans), nor loans securitized by the government-sponsored
enterprises Freddie Mac, Fannie Mae, or Ginnie Mae. One concern is that our sample
from DataQuick may not be representative of subprime loans. We have access to the
Mortgage Metrics data, which include mortgages making up more than 60 percent of U.S.
residential mortgages, covering both loans securitized and those on banks’ books. We
find from the Mortgage Metrics data that the degree of securitization among ARM2s and
ARM3s by private labels is very high, above 90 percent before 2007. Therefore, the
overwhelming majority of the ARM2s and ARM3s originated before 2007 is covered in
DataQuick.
Countrywide was among the largest mortgage lenders, if not the largest, in the
United States during the latest housing bubble, and a significant proportion of its loans
were subprime.17 Panel A of online appendix table A1 presents Countrywide’s market
share (i.e., new originations) in the subprime ARM2 and ARM3 markets based on
DataQuick. This table suggests that Countrywide’s operation in the subprime markets
17
was nationwide and not concentrated in any particular states. Panel B of online appendix
table A1 shows Countrywide's market share over the 2005–2007 period among all loans
in DataQuick. It is clear that there is some variation in Countrywide's market share, but
the variation from one period to another is not large.
4. Data and Sample Construction
4.1. Data Source
DataQuick contains detailed loan and borrower information at origination, such as
loan amount, initial interest rate (upon loan origination), interest rate type,18 loan-to-value
ratio (LTV), combined loan-to-value ratio (CLTV),19 low/no documentation indicator,
owner/investor indicator, primary mortgage insurance (PMI) information,20 FICO credit
score, property type,21 property location, product type,22 interest only indicator, balloon
indicator,23 loan purpose,24 the existence of a prepayment penalty, etc. It also contains
monthly updated information since origination, such as loan balance, current interest rate,
monthly payment, delinquency status, date of last payment, date of next payment due,
etc. DataQuick provides LTVs and CLTVs at origination only. To construct updated
CLTVs, we assume that there is no pay-down on the second or higher liens from
origination to the current month. We then estimate updated LTVs and CLTVs for each
month based on 1) the current outstanding amount of the first lien, 2) the origination
amount of the second and higher liens, and 3) changes in zip-level home price index
18
Interest rate types typically include fixed interest rate, floating interest rate, and combinations of them as in ARMs.
19
When there is more than one lien on a residential property, the CLTV combines the outstanding debt from all liens, while the LTV reflects only the outstanding amount on the first lien.
20
PMI is usually needed when down payments are less than 20 percent.
21
Property types include single family house, one to four units, condominiums, planned unit development, etc.
22
Product types include FRM, ARM, etc.
23
Balloon loans do not fully amortize the term of the loans, thus leaving balances due at maturity; they are therefore more risky than the fully amortized loans but less risky than interest only loans.
24
(HPI) from the origination month.25 We further include zip-level unemployment rate
among the explanatory variables in our model specification.26
4.2 Sample Construction
Our samples consist of Countrywide loans that are likely eligible for modifications and
loans from other lenders that would likely be “eligible” had they been serviced by
Countrywide.27 Our base sample contains ARM2s originated in the second half of 2006. We chose ARM2 as it is the focus of most media discussions on subprime mortgages.
This particular origination period is chosen as it is at the height of the housing bubble,
thus naturally attracting more interest.28
To further shed light on a broad spectrum of subprime mortgages and other time
periods, we investigate two alternative samples, including ARM3s originated in the
second half of 2006 (alternative ARM3 sample hereafter) and ARM2s originated in the
first half of 2005 (alternative ARM2 sample hereafter).During the four-month window
after the settlement announcement, while the loans in the base sample are in the resetting
period, the loans in the alternative ARM3 sample are not up for interest rate reset yet, and
those in the alternative ARM2 sample have passed interest rate reset. So results from
these samples would shed light on whether results from the base ARM2 sample are
driven by the different reactions to interest rate reset between Countrywide and
non-Countrywide loans.
25
The zip level HPI information is from Black Knight (formerly known as LPS). We have also used the zip level HPI information from CoreLogic, and those results are qualitatively similar to the results reported here.
26
The zip-level unemployment rate variable used in our model was converted from county-level data. We obtain the county-level unemployment rate from Haver Analytics (http://www.haver.com). All zip code areas within the county share the unemployment rate at the county level. Some zip code areas span more than one county, and we calculate the population weighted averages using the 2010 census population available from the Missouri Census Data Center crosswalk (http://mcdc.missouri.edu/websas/geocorr12.html).
27
We find that all ARM2s and ARM3s serviced by Countrywide as of June 2008 or September 2008 were originated by Countrywide. Therefore, in the rest of the paper, we do not differentiate between servicers and lenders.
28
To construct our base sample, we apply several screening criteria to ARM2s
originated in the second half of 2006. We include only first lien loans on owner-occupied
properties, and exclude loans with missing values on the key variables used in the paper.
We require the loans to have an updated LTV at or above 75 percent as of September
2008 to meet the modification requirement, and exclude any loans with origination or
updated LTVs below 0.55 at any time during the period from January 2007 to January
2009 because these loans are unlikely to be subprime. Further, since mortgages with
different terms have different payment structures, we constrain our sample to 30-year
mortgages only.29 We exclude loans with an interest rate below 3 percent in September
2008, as these loans have little room for rate reduction.
For loans passing the screening criteria we exclude loan-month observations once
a loan enters the foreclosure procedure, as the probability of cure is virtually zero by the
time of foreclosure. In addition, if a loan received a modification either from
Countrywide or other lenders, we exclude its post modification observations. Typically
modifications brought defaulted loans back to current status immediately, but these loans
might be soon back to default. Including the post modification observations generates
excessive artificial transitions between default and current. This is particularly
problematic because of the overtime shift in the modification practice: mortgage
modifications become more common over the sample period and especially towards the
second half of 2008. Less than 0.2 percent of loans were modified before January 2008;
this proportion goes up to 1.06 percent in August 2008, and further increases to 2.43
percent in January 2009. Finally, we delete the month when a loan is paid off to avoid
classifying delinquency to paid off as cure, since a significant proportion of the paid-offs
are driven by short sales. 30
For each loan, given the monthly observations passing the screening process, we
construct a panel beginning in January 2007 and ending in January 2009. A loan may
drop out of our sample before January 2009 due to foreclosure, modification, or being
29
Countrywide has many mortgages with over 30-year amortization, whereas such types of mortgages are rare in other banks. To maintain comparability, we include only mortgages with 30-year amortization.
30
paid off. Loans falling out of the sample before September 2008 are not eligible for the
modification, and we exclude these loans.
Our panel stops in January 2009 because the American Recovery and
Reinvestment Act of 2009, from which the nation-wide federal mortgage modification
program HAMP derives authorization, was signed into law in February 2009.31
Non-Countrywide borrowers may default strategically in anticipation of possible
modifications under the new law, which can induce potential contamination on our
estimations.
Our panel thus consists of the pre-event window from January 2007 to September
2008, and the post-event window from October 2008 to January 2009. At the end, we
have 166,616 mortgages containing 3,885,002 monthly observations in the base ARM2
sample. Following the same procedure, we end up with 48,619 loans (1,183,678 monthly
observations) in the alternative ARM2 sample and 35,160 loans (819,470 monthly
observations) in the alternative ARM3 sample.
4.3 Default Rate
This section examines the monthly default rates of our samples, with the goal of
contrasting the Countrywide loans with loans by other lenders and providing the overall
picture of the housing market during our sample period from January 2007 to January
31
2009. A mortgage is considered to be in default if it becomes 60+ DPD.32 Note that the
payment status is defined at the end of the month.
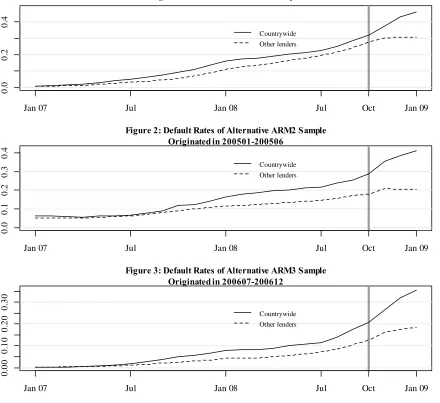
Figure 1 plots the default rates of our base sample. The vertical line marks
October 2008, the time of the Countrywide settlement announcement. Throughout the
sample period, the overall default rates display the well-known upward trend. The
Countrywide default line is always above that of the other lenders throughout the sample
period. The spread between Countrywide and other lenders is largely negligible in the
beginning of the period, and it slightly widens as the loans age. The spread between the
two lines suddenly enlarges drastically after October 2008, reaching nearly 16 percentage
points by January 2009.
Figure 2 plots the default rates for our alternative ARM2 sample, consisting of
loans originated in the first half of 2005. Note that loans in this sample are more than 18
months old by January 2007 and have passed interest rate reset in the post-announcement
window. The default rates of Countrywide loans are largely comparable to those of other
lenders before October 2007, and the spread between the two lines starts to emerge
afterwards. As in figure 1, a clear rise in the Countrywide default line quickly widens the
gap after October 2008, with the gap increasing from less than 10 percentage points in
September 2008 to over 20 percentage points in January 2009.
Figure 3 plots the default rates for the alternative ARM3 sample, consisting of
loans originated in the second half of 2006. The default rates between Countrywide and
other lenders are comparable before June 2007. The two lines begin to diverge in July
2007, and the gap widens as the loans age. The abrupt increase in the spread of default
rates between Countrywide and other lenders is again obvious around October 2008, with
the gap enlarging from seven percentage points in September 2008 to roughly 17
percentage points in January 2009.
Therefore, figures 1–3 all depict a sudden increase in the default rate in
Countrywide loans after October 2008, regardless of the reset status during the post-event
window. The abrupt increase in the spread between Countrywide and other lenders after
October 2008 is also evident in other alternative samples that we have investigated (but
32
not reported in the paper due to space limitations). This shared pattern across various
samples is unlikely to be driven by idiosyncratic risks, and it lends directional support to
the existence of strategic default induced by the settlement. Causal interpretation of these
graphs is unreliable, however, because of the selection bias, i.e., these loans result from
the two-way selection processes between the homeowners and mortgage lenders. In the
next section, we present our econometric models to correct for the selection bias and
estimate the scope of the strategic behavior induced by the modification program.
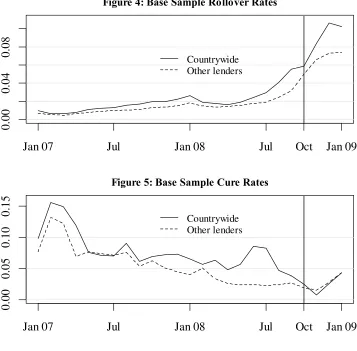
We next investigate graphically the observed transition rates from current to delinquent (the focal concept of rollover rates in MMPG) and the rates from delinquent back to current (cure rates). Both transition rates are referred to as empirical hazard rates in the duration model literature (see Kalbfleish and Prentice [1980]). In our setting, the
first type of empirical hazard rate (rollover rate hereafter to match the terminology of
MMPG) in month t is defined as the ratio of the number of loans becoming 60+DPD in month t to the number of loans being current in month t2. The rollover rates of our base sample are plotted in figure 4. It is clear that the trends are very similar between this
figure and figure 4 in MMPG, although our rollover rates are a couple of percentage
points higher especially after July 2008 because of sample differences. The jump in
Countrywide rollover rates after November 2008 is apparent.
The second type of empirical hazard rates, cure rates, are defined symmetrically,
namely, the ratio of the number of defaulted loans becoming current again in month t to the number of loans being 60+DPD in month t1. The cure rates of our base sample are presented in figure 5. The cure rates for both groups are high in the beginning and decline
afterwards.33 There is an exception to the overall declining pattern: the cure rates show a
brief rise among Countrywide loans in June and July of 2008 - exceeding eight
percentage points - and then fall drastically after August 2008. In the meanwhile, the cure
rate of other lenders cuts from below in November 2008 when the cure rate among
defaulted Countrywide loans approaches zero. Note that, because of the way we construct
our data, the transitions from default to current are not contaminated by unnatural cures,
such as loan modifications. Therefore, around modification announcement, we not only
33
observe changes in the rollover rates among loans that were current in payments, but also
adjustments in the cure rates among loans already in default before the announcement.
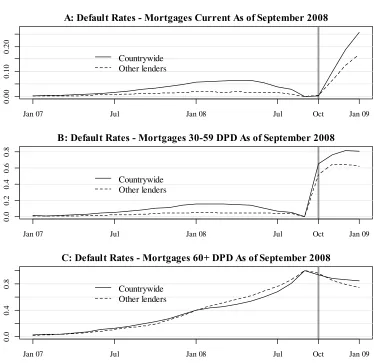
We further depict the default rates for the subsamples based on their delinquency
status as of September 2008 in figure 6: loans current as of September 2008 in panel A,
loans 30–59 DPD as of September 2008 in panel B, and loans 60+ DPD as of September
2008 in panel C. We first examine panel A of figure 6. By sample construction, both
default lines are at zero in September and October 2008. Before September, the overall
default rates are very low, with the Countrywide’s rates being higher. Both lines are,
however, obviously above zero before the settlement, suggesting that the transition from
default to current is far from rare and non-negligible. As the Countrywide line lies above
that of other lenders before October 2008, this panel indicates that the cure rates are
higher among Countrywide loans than among other lenders before October 2008, a
finding consistent with that from figure 5. Both lines of default rates climb up sharply
starting from November 2008. This pattern is intuitive as we define default as 60+ DPD,
and it therefore takes two months to go from current to 60+ DPD. The overall default
rates rise to around 20 percent, and the spread between Countrywide and other lenders
increases to more than nine percentage points at the end of the sample period.
In panel B of figure 6, the two default lines are again at zero in September 2008
by construction. Not surprisingly, panel B shows that the default rates before September
are higher than those in panel A, and this pattern again suggests substantial cure rates
among the defaulted loans. The sharp rise in default rates for all loans starts in October.
The default rates among Countrywide loans are higher than those of other lenders before
October 2008, but the gap is rarely in double digits. The positive gap between
Countrywide and other lenders enlarges in October, widens further in November and
December, and finally reaches over 18 percentage points in January 2009.
Panel C of figure 6 plots default rates of loans 60+DPD as of September 2008,
and consequently both default lines are at one for that month. Default rates during the
pre-event window in this panel are much higher than those shown in the previous two
panels. They start from low single digits in early 2007 to more than 40 percent in
February 2008 and to 100 percent in September 2008. Different from the patterns in
every month from February to September 2008. The default rates are less than one in
October, suggesting that some default has been cured, but the cure rate is slightly higher
among Countrywide loans, as the Countrywide line is below the line for other banks in
October 2008. Starting from November 2008, however, the line for other lenders drifts
sharply downward, while the Countrywide line falls more slowly, and the Countrywide
line cuts from below. By the end of the sample period, the default rate of Countrywide
loans is almost 10 percentage points higher than the rate of other lenders, suggesting that
the cure rate among loans of other lenders is actually 10 percentage points higher during
the post-announcement period.
We have also investigated the graphs in figures 4 to 6 among the alternative
samples and observe very similar patterns. In summary, there is directional evidence that
1) strategic default may take place not only among loans in better conditions, but also
among loans already in delinquency before the legal settlement is announced, and 2) the
modification program not only increases the transition rates from current to default but
also decreases the transition from default to current.
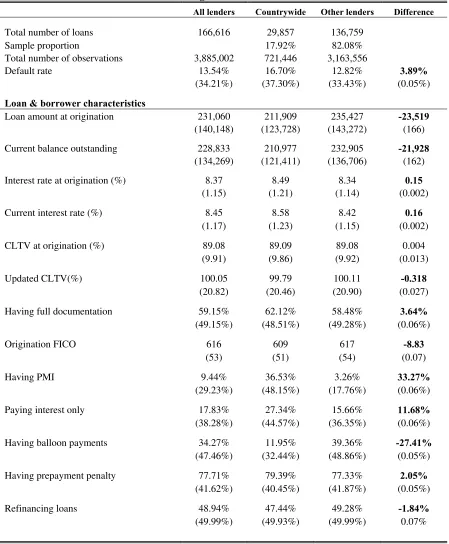
4.4 Summary Statistics
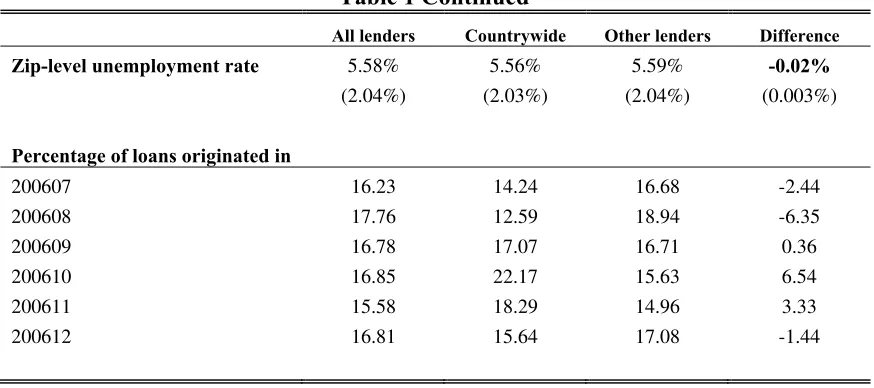
Table 1 presents characteristics of our ARM2 base sample with a comparison between
the Countrywide loans and those from other lenders. Roughly 18 percent of the loans in
the ARM2 base sample are serviced by Countrywide. Since the panel is unbalanced, we
also present the total number of observations.34 During the sample period, the
Countrywide default rate was 16.70 percent, which was 3.89 percentage points higher
than that of the other lenders.
Next we present the loan and borrower summary statistics. On average, both the
origination and the current outstanding loan amounts are lower among Countrywide
loans, and both origination and current interest rates are slightly higher for Countrywide
loans. The origination CLTVs are largely comparable between Countrywide loans and
those from other lenders. The average updated CLTV is roughly 100 percent for both
Countrywide and other lenders. Sample statistics (not included in the table) indicate that
34
38 percent of Countrywide loans and 39 percent of other lenders in the base sample are
underwater (the outstanding loan amount is greater than the house value).
Countrywide has a slightly higher proportion of loans with full documentation
than other lenders. The average FICO scores are below 620 among both groups,
consistent with the subprime status of these loans. The average FICO score of
Countrywide borrowers is even lower. The proportion of Countrywide loans with PMI is
10 times that of other lenders, and there is a significantly larger proportion of
Countrywide ARM2s paying interest only. More loans from other lenders are balloon
loans. The proportions of loans for refinancing purposes or with a prepayment penalty are
largely balanced between the two groups, and there is little difference in the zip-level
unemployment rates between the two groups. Overall, the lower loan amounts, higher
interest rates, lower FICO scores, higher PMI, and more interest only loans suggest that
the Countrywide borrowers are, in general, more risky than borrowers from other lenders,
consistent with the default rate patterns in figure 1.
The next panel of table 1 presents the distributions by origination month. More
Countrywide ARM2s are originated from September 2006 to November 2006, when the
housing market largely plateaued. This could be another reason that Countrywide loans
may be more risky. Further, this finding suggests that more Countrywide ARM2s are up
for interest rate reset during the post-settlement window in 2008.
Online appendixes tables A2–A3 present summary statistics for the alternative
samples. The proportion of Countrywide loans is 14.2 percent in the alternative ARM2
sample and 12.6 percent in the alternative ARM3 sample, both lower than the
Countrywide market share of 17.9 percent reported in table 1 for the base sample. In both
alternative samples, Countrywide borrowers tend to have lower FICO scores, a higher
proportion of interest only loans, and a higher proportion of PMIs. Overall, between
Countrywide and other lenders, there seems to be more similarity in ARM2s originated in
5. Econometric Approach
5.1 Target Parameter and Identification Issues
The target parameter of this study is the population fraction of strategic default induced by the modification program. The concept of the modification-induced default is as follows: for loans current upon modification announcement, the borrower chooses to miss
payments if serviced by Countrywide (to become eligible for the settlement) and does not
if serviced by other lenders; for loans delinquent upon modification announcement, the
borrower chooses not to resume payments if serviced by Countywide (to stay eligible for
the settlement), but resume payment if serviced by other lenders. In the bathtub analogue,
our target parameter is the difference between 1) the fraction of bathtub filled with water
without modification, and 2) the fraction after exogenously imposing the modification
program. However, each borrower is serviced by either Countrywide or other lenders, but
not both, and we thus face a typical missing data problem. The Countrywide legal
settlement, unlike a nationwide government program such as HAMP, provides an
exogenous variation on eligibility of the modification program, which allows us to
construct a plausible counterfactual and overcome the missing data problem. We next
discuss a few identification issues.
First, although it is reasonable to assume no anticipation of the Countrywide legal
settlement when the mortgages in our samples were formed in 2005 or 2006, there is still
no grounds to believe that the two loan populations, Countrywide and other lenders, are
completely comparable before the settlement. These loans resulted from the two-way
selection processes between the homeowners and mortgage lenders, and sections 4.3 and
4.4 indeed show notable differences between the Countrywide and other loans. Therefore,
we need to control for loan and borrower characteristics to address the selection bias.
Second, although containing a relatively rich set of variables, DataQuick still
misses some important borrower characteristics. For example, borrower occupation,
updated FICO scores, and job and family income are unavailable in mortgage data in
general, which is also the case with DataQuick. Therefore, an identification strategy
solely relying on selection on observables is compromised. Fortunately, our panel data
structure allows us to control for mortgage and borrower specific fixed effects to mitigate
mortgage fixed effects in these models not only controls for time-invariant
borrower/mortgage specific unobserved heterogeneity, but also controls for
time-invariant local market specific factors.
Finally, an additional threat to the inference may still exist if there are unobserved
factors whose effect may be triggered by the introduction of the modification program.
Our fixed effect models do not have a safeguard against such time-varying influences due
to unobservables. We follow the literature and take a proxy variable approach.35 We
consider a few loan characteristics at origination as proxies for those unobservable. For
instance, riskier borrowers with less stable income may choose loans paying interest only,
and these borrowers may be more likely to respond to loan modification programs and
default strategically. We include interaction terms between the proxy variables and the
post-settlement calendar month dummy variables in our richer models described below in
section 5.3.
5.2 Basic Specification
Our basic specification is a mortgage fixed effect model. As described in section 4.2, our
panel window is from January 2007 to January 2009. The basic specification takes the
following form:
1 2 2008 2008 2008 2009 31 31
2009
2007 4 1
ilm ilm lm oct i nov i dec i
Jan
jan i m m t i t i ilm
m Feb
Y X W CW Oct CW Nov CW Dec
CW Jan D D CW D
(5.1)where Yilm is default status, Yilm 1 if mortgage i located in local market l in calendar month m is 60+DPD ; Yim 0 otherwise. Xilm denotes a vector of time-varying mortgage
characteristics, and Wlm is a vector of local market (at the zip code level) conditions. ' s
are coefficients. The next four variables are the interaction terms between the
Countrywide dummy variable and the post-settlement calendar month dummy variables,
and their coefficients are ' s with the corresponding subscript. The calendar month effects are captured by the summation term with coefficients, and January 2007 is the
base calendar month. The loan age effects, separately for other lenders and Countrywide,
35
are represented by the next two summation terms with and coefficients
respectively. In the loan age step function for other lenders, t represents loan age
(measured by month) since origination, Dt is a dummy variable that takes on the value 1
if t and 0 otherwise, and are coefficients. Due to the relatively smaller number of
defaults during the first 15 months, the coefficients are constrained to be equal over
age intervals of three given by 4 6,7 9,10 12,13 15 and unrestricted for16,...,31
. The loan age step function of Countrywide assumes the same specification with a
different set of parameters: . i is the mortgage fixed effects and ilm is the iid error
term. Although the form of our dependent variable naturally leads to a nonlinear model,
such as Probit or Logit, we choose a linear probability model due to the well-known
incidental parameters problem and additional assumptions required to incorporate fixed
effects in such nonlinear models.36
The coefficients of interest areoct jan, the fraction of the modification-induced default
measured in each month during the post-settlement window. This specification allows the
measured size of strategic default to vary by month after the settlement. We interpret
these four parameters using the potential outcome framework. In particular, let 1
m
Y denote
the potential default status in month m if a representative loan were serviced by
Countrywide and Ym0 denote the potential default status in month m if that loan were serviced by other lenders. Then, our target parameter, the size of induced strategic default
in, for example October 2008, is measured by
1 0
2008
m m oct
E Y Y mOct .37 The
measures for the other three months are analogous. Note that parameters are stock measure of population fraction as of particular post-settlement calendar month.
To provide the usual comparison to fixed effect models, we also estimate an
ordinary least squares model by pooling all observations. In this OLS specification, we
36
MMPG chooses a pooled Probit model, which ignores the panel structure of observing each mortgage for multiple periods but has the advantage of including time-invariant borrower specific variables.
37
add time-constant loan characteristics at origination, a Countrywide dummy variable, as
well as state dummy variables to our basic specification in equation (5.1).
5.3 Specification Test and Richer Models
Using the base sample, we conduct a conventional specification test, i.e., applying the
basic specification in equation (5.1) to a before-treatment, non-event window, namely
June 2008 to September 2008. We do not expect the settlement to induce any strategic
default in this pre-announcement window. Systematic factors specific to Countrywide
loans beyond the settlement might be detected by this test. As with all specification tests
in this spirit, however, passing the test does not provide a complete assurance of our
model.
We also explore a spectrum of richer models allowing the settlement-induced
default behavior to differ among loans with various characteristics at origination. We
consider loan characteristics at origination, including interest rate, LTV, status of loan
documentation, balloon loans, and indicator of paying interest only. Our analysis is
conducted by adding one variable at a time to the basic specification. The richer models
are defined as
1 2 2008 2008 2008 2009 2008 2008 2008
2009 2008 2008 2008
ilm ilm lm oct i nov i dec i
jan i oct i i nov i i dec i i
jan i i oct i nov i dec
Y X W CW Oct CW Nov CW Dec
CW Jan CW Oct Z CW Nov Z CW Dec Z
CW Jan Z Oct Z Nov Z Dec
2009 31 31 2009
2007 4 1
i
Jan
jan i m m t i t i ilm
m Feb
Z
Jan Z D D CW D
(5.2)
where Zi represents one of the loan characteristics at origination. The four terms with the
coefficients allow strategic behavior to differ among loans with characteristics at
origination, and the four terms with coefficients capture the effects that such strategic
behavior may vary with the general macro conditions in the post-settlement window.
With the additional interaction terms, our target parameter, i.e., the fraction of strategic
default, becomes a function of ,, and Zi:
1 0
E Y Y Z z z. For example, if
Z takes two values, 0 and 1, represents the population fraction of settlement induced
1
Z . Note that is the difference between the two groups of loans in terms of such
strategic reaction to the settlement.
6. Empirical Results
6.1 Base Sample
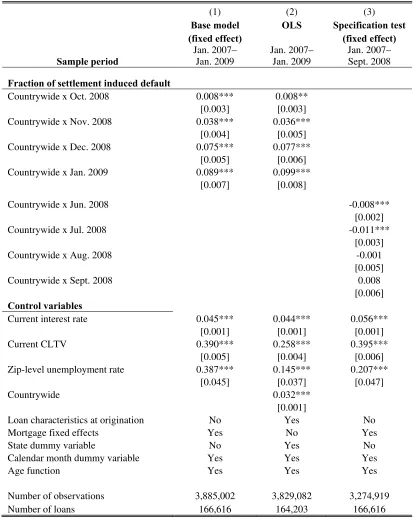
Table 2 provides estimates from the base sample, i.e., ARM2s originated from the second
half of 2006. Column (1) presents results from the basic specification (equation 5.1). The first four rows report the key parameter estimates. As discussed in section 5.2, these
estimates measure the fractions of the modification-induced default in each month during
the post-settlement window: 0.8 percentage points in October, 3.8 percentage points in
November, 7.5 percentage points in December, and 8.9 percentage points in January. All
four estimates are significant at the 1 percent significance level, and these estimates retain
much of the pattern shown in figure 1. Note that throughout the four-month performance
window, the average default rate among loans of other lenders is 29.85 percent for the
base samples. Therefore, the peak estimate of January 2009 in the first column of table 2
suggests a 30 percent relative increase in default rate because of the modification
program; this magnitude of modification-induced default is substantial.
As noted in section 2, the measure of induced default in MMPG, namely the
increased rollover rate (a flow measure) given the settlement compared with no
settlement, is the difference in water outflow speed (in a bathtub analogue) under the two counterfactual scenarios. In terms of the same bathtub analogue, our induced default
measure, as discussed in section 5.1, is the difference in water level (a stock measure) under the two counterfactual scenarios. Although the increase in rollover rate due to
modification as documented in MMPG provides directional evidence of induced strategic
default, it is not an easy-to-interpret parameter for banking industry and policy makers
because it is not trivial to convert a water outflow speed into a water level measure. This
conversion can only be achieved by estimating a full structural model, namely a
and from delinquent back to current (for example, see Ham, Li, and Shore-Sheppard
[2016]).38
We facilitate a rough comparison, however, by a simple “back-of-the-envelope”
calculation using the MMPG estimates. Their preferred estimate in column 4 of their
table 2 indicates that the Countrywide loan “rollover rate” (monthly hazard rate) rises by
0.0054 during the October to December period as compared with an overall sample mean
rollover rate of 0.048. Using their implicit assumptions of no chance for a defaulted loan
to cure, no duration dependence, and no unobserved heterogeneity, we calculate the
fraction of induced default to be about 1.5 percentage points ending in December 2008.
This number is much lower than our corresponding estimate of 7.5 percentage points in
table 2. This difference could be explained by 1) induced default in the form of a drop in
cure rates among the Countrywide loans, which is not considered in MMPG, and 2) the
difference in sample. A comparison between MMPG figure 4 and our figure 4 indicates
that our base sample is riskier than the ARM2 sample in MMPG.39 Our results below
from subsamples and richer models suggest the modification program induced default is
more severe among risky loans.
The remaining rows of table 2 show the coefficient estimates of the other control
variables. We find that the default probabilities are positively associated with current
interest rate, CLTV, and the zip-level unemployment rates. The calendar time coefficient
estimates (not reported in the table to save space) indicate a monotonically upward trend
in default during the sample period. The coefficient estimates of the loan age step
functions (not reported to save space) show a general increase in default risk as these
loans age.
38
The fixed-effect approach we use in this study is more practical than a multi-state multi-spell duration model approach. First, it estimates the fraction of induced default directly, while a fully structural duration model approach needs simulation to obtain our estimates. Second, our fixed-effect models are reduced-form models, relying on fewer structural assumptions.
39
As discussed in section 5.2, we also estimate an OLS model as a comparison to
our fixed effect model, and the results are reported in column (2) of table 2. In addition to
the time varying variables in the fixed effect model, the OLS specification also allows us
to control for the time-constant loan characteristics at origination, including loan amount,
initial interest rate, CLTV, FICO, dummy variables indicating full documentation, having
PMI, paying interest only, balloon payments, refinancing loans, whether there is cashout
upon refinancing, and property types.40 Further, we control for the calendar time effects,
a Countrywide dummy variable, state fixed effects, and loan age step functions. The OLS
estimate of induced default in January 2009 is one percentage point larger than that from
the basic specification in column (1), while the estimates of the other three months are
rather comparable between the two columns.
6.2 Specification Test and Subsample Results
To reassure the evidence we present in the previous section, we conduct a specification
test on the base sample using a non-event window from June 2008 to September 2008.
The results from this test are presented in column (3) of table 2. The estimated fractions
of induced default are negative and statistically significant in June and July, but the
magnitude is small, about one percentage point or less. The estimates are not statistically
significant in August and September. These results provide some reassurance for our
model specification by suggesting that, after controlling for other factors, the default rates
were comparable between Countrywide and other lenders before the modification
program was announced.
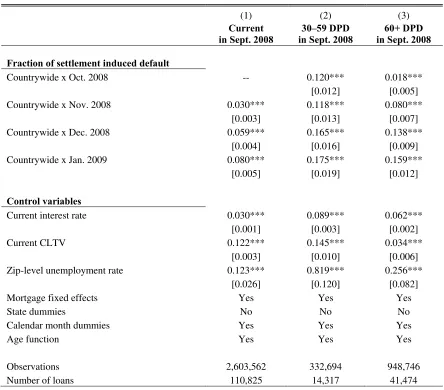
Next we investigate whether strategic defaulters are concentrated in a particular
segment of loans by breaking down the base sample into three subsamples: loans current,
30–59 DPD, and 60+ DPD as of September 2008. They represent 66.5 percent, 8.6
percent, and 24.9 percent of the base sample. The subsample results are reported in
columns (1), (2), and (3) of table 3, respectively. For the loans current as of September
2008, the earliest time to become 60+ DPD (our definition of default) is November 2008,
and thus we suppress the parameter measuring fraction of induced default in October
40
2008 in column (1). The estimated fraction increases from three percentage points in
November 2008 to eight percentage points in January 2009. By contrast, the fraction
estimates in column (2) are in double digits throughout the event window, suggesting that
the program-induced strategic default shows up immediately among those 30–59 days
behind their payments, and the effect is strong. Among loans 60+ DPD, the fraction
estimate is 1.8 percentage points in October 2008, which rises quickly and reaches almost
16 percentage points by January 2009. Overall, table 3 suggests that strategic default
occurs not only among borrowers who were current immediately before the modification
program was announced, but also among those borrowers who were already in
delinquency at that time. Overall, the estimated fraction of induced default is higher in
columns (2) and (3) than in column (1), implying that the strategic behavior in general is
more serious among riskier loans in this ARM2 sample. Further, to have a rough idea of
the distribution of strategic defaulters among the three subsamples, we can multiply the
fraction estimate in January 2009 with the corresponding number of loans for each
subsample. We find that slightly over half of the default induced by the modification
program is already in delinquency in September 2009. This finding confirms the
importance of also investigating the transitions from delinquent to current, a notion
discussed in the introduction of the paper.
The evidence in table 3 thus suggests that the extent of modification-induced
strategic default is more severe among more risky loans, which seemingly contradicts the
conclusion in MMPG that the estimated increase in rollover rates is largest among the
least risky borrowers. The MMPG sample is closest to our first subsample in column (1)
consisting of loans current in September 2008. To reconcile the differences between our
results and those in MMPG, we further investigate loans in the column (1) sample with
origination CLTVs below 80 percent (i.e., less risky loans in this group). We find that in
this subgroup the estimated induced default is 10 percentage points in January 2009,
which is two percentage points higher than the corresponding estimate for the overall
group in column (1) of table 3. This result is consistent with the evidence in MMPG. This
fraction estimate of 10 percentage points is still lower, however, than the corresponding
estimates in columns (2) and (3) of table 3 for more risky loans: 30–59 and 60+ DPD as
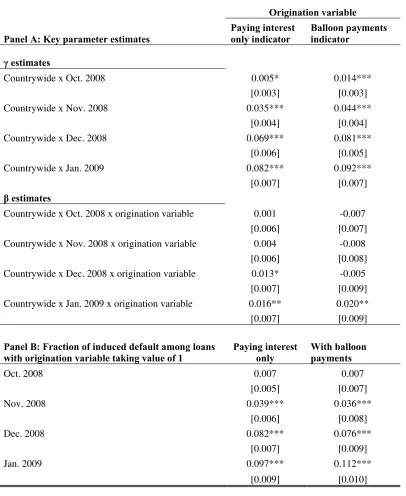
6.3 Results From Richer Models
In this section, we report results from the richer models specified in section 5.3. We
explore two origination characteristic variables: interest only indicator and balloon
indicator. We choose these two variables because interest only loans or balloon loans are
generally deemed to be more risky, and we examine whether these characteristics are
associated with more strategic default.
Table 4 presents the two richer models, estimates from the model involving
interest only indicator in the first column and those from the model involving balloon
indicator in the second column. Panel A presents the key parameter estimates as specified in equation (5.2), with estimates in the first four rows and estimates in the next four rows for both models. Recall that captures the fraction of induced default among loans
with the origination variable equal to 0, and captures the difference in reaction to the
settlement between the two groups of loans (indicator equal to 1 group minus indicator
equal to 0 group). In this model, the fraction of induced default among loans with the
origination variable equal to 1 is represented by , and we present these estimates in
panel B. Our discussion focuses on the difference in strategic behavior captured by the
two origination variables.
The estimates in the first column suggest that, compared with loans with
normal amortization, interest only loans have significantly higher tendency to default
strategically in the third and fourth months. For example, the estimated fraction of
induced strategic default in January 2009 is 1.6 percentage points higher among interest
only loans than among those with normal amortization. Similarly, the estimates in the
second column suggest that the modification program induces more strategic default
among balloon loans by 2.0 percentage points in the fourth month after the
announcement. Since interest only loans or balloon loans are riskier, these results add to
our earlier finding that strategic default is more pervasive among more risky loans.
We have also investigated other loan characteristics at origination, such as interest
rate, LTV, documentation, FICO scores, and primary mortgage insurance. We do not find
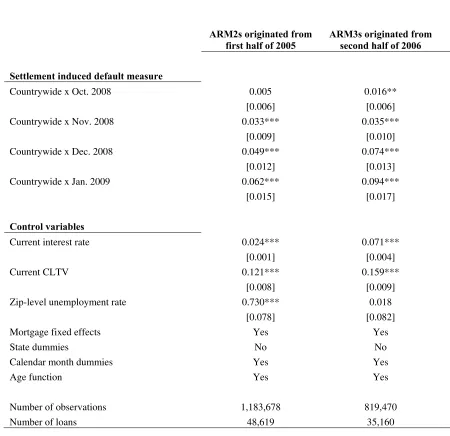
6.5 Alternative Samples
Table 5 reports the results from ARM2s originated from the first half of 2005 (column 1)
and ARM3s originated from the second half of 2006 (column 2). We use the basic
specification of equation (5.1). The fraction of induced default estimates in the first four
rows of table 5 show an upward trend, reaching six percentage points for the alternative
ARM2 sample and nine percentage points for the alternative ARM3 sample in January
2009. Again, these estimates confirm the directional evidence shown in figures 2–3.
Throughout the four-month performance window, the average default rates are
about 19.89 percent and 16.27 percent for the alternative ARM2 and ARM3 samples,
respectively. Therefore, the peak estimates of January 2009 in table 5 suggest that around
30 percent and 60 percent relative increases in default rate are due to the modification
program, respectively for the two alternative samples.
7. Conclusions
We conduct a comprehensive study to examine the extent of strategic default induced by
a loan modification program, the Countrywide settlement. Adopting a broader view on
modification-induced strategic default than the existing literature, we find that the extent
of modification-induced default reaches six to nine percentage points four months after
the modification announcement. Depending on the sample, we find that the induced
default represent 30 to 60 percent increases in mortgage default relative to comparable
loans by other lenders. Our fraction estimates are multiple times larger than the roughly
converted fraction estimates from MMPG.
More importantly, we find substantial modification-induced default not only
among borrowers who were current in their loan payments, but also among those who
were already in delinquency before the announcement of the modification program.
Among delinquent borrowers, the modification-induced strategic default is reflected as a
lower cure rate for otherwise comparable loans. This evidence, not documented in the
prior literature, suggests that it would be very difficult for even a rigorous audit to
identify strategic defaulters among delinquent borrowers, since the efforts put in job
searching and/or cost cutting are unobservable. As a result, designing a mortgage
we find that induced strategic behavior is widespread and tends to be more severe among
more risky loans.
References
Agarwal, Sumit, Gene Amromin, Itzzhak Ben-David, Souphala Chomsisengphet, and Douglas D. Evanoff, 2011, “The Role of Securitization in Mortgage Renegotiation,” Journal of Financial Economics, 102, 559–578.
Agarwal, Sumit, David O. Lucca, Amit Seru, and Francesco Trebbi, 2012, “Inconsistent Regulators: Evidence from Banking,” NBER working paper 17736.
Andersson, Fredrick, Souphala Chomsisengphet, Dennis Glennon, and Feng Li, 2013, “The Changing Pecking Order of Consumer Defaults,” Journal of Money, Credit, and Banking, 45(2–3), 251–276.
Bajari, Patrick, Sean Chu, and Minjung Park, 2008, “An Empirical Model of Subprime Mortgage Default From 2000 to 2007,” NBER working paper 14625.
Berndt, Antje, and Anurag Gupta, 2009, “Moral Hazard and Adverse Selection in the
Origination-to-Distribute Model of Bank Credit,” Journal of Monetary
Economics, 56, 725–743.
Calomiris, Charles W., Eric J. Higgins, and Joseph R. Mason, 2011, “The Economics of the Proposed Mortgage Servicer Settlement,” Columbia University Working Paper.
Cohen-Cole, Ethan, and Jonathan Morse, 2009, “Your House or Your Credit Card, Which Would You Choose? Personal Delinquency Tradeoffs and Precautionary Liquidity Motives,” working paper, University of Maryland.
Demyanyk, Yuliya, and Otto Van Hemert, 2011, “Understanding the Subprime Mortgage Crisis,” Review of Financial Studies24, 1848–1880.
Edmans, Alex, 2010, “The Responsible Homeowner Rewards: An Incentive-Based Solution to Strategic Mortgage Default,” working paper, University of Pennsylvania.
Farhi, Emmanuel, and Jean Tirole, 2009, “Collective Moral Hazard, Maturity Mismatch, and Systematic Bailouts,” Harvard University working paper.
Foote, Christopher, Kristopher Gerardi, and Paul Willen, 2008, “Negative Equity and Foreclosure: Theory and Evidence,” Journal of Urban Economics 64(2), 234– 245.
Gerardi, Kristopher, Christopher Foote, and Paul Willen, 2011, “The Seductive but Flawed Logic of Principal eduction,” Federal Reserve Bank of Atlanta Real Estate Research, March 9, 2011.
Gerardi, Kristopher, and Wenli Li, 2010, “Mortgage Foreclosure Prevention Efforts,”
Economic Review, Federal Reserve Bank of Atlanta.
Ghent, Andra C., and Marianna Kudlyak, 2009, “Recourse and Residential Mortgage Default: Theory and Evidence from U.S. States,” Federal Reserve Bank of Richmond Working Paper 09–10.
Goodman, Laurie, Roger Ashworth, Brian Landy, and Ke Yin, 2010, “Option ARMs, Performance and Pricing,” Amherst Mortgage Insight, January 11, 1–24.
Guiso, Luigi, Paola Sapienza, and Luigi Zingales, 2011, “Moral and Social Constraints to Strategic Defaults on Mortgages,” University of Chicago Working Paper.
Ham, John, Xianghong Li, and Lara D. Shore-Sheppard, 2016, “The Employment Dynamics of Disadvantaged Women: Evidence from the SIPP,” Journal of Labor Economics (forthcoming).
Jagtiani, Julapa, and William W. Lang, 2010, “Strategic Default on First and Second Lien Mortgages During the Financial Crisis,” working paper, Federal Reserve of Philadelphia.
Jakubson, George, 1991, “Estimating and Testing of the Union Wage Effect Using Panel Data,” Review of Economic Studies 58, 971–991.
Kalbfleish, J. D., and R. L. Prentice, 1980, “The Statistical Analysis of Failure Time Data,” New York: Wiley.
Keys, Benjamin, Tanmoy Mukherjee, Amit Seru, and Vikrant Vig, 2010, “Did Securitization Lead to Lax Screening? Evidence from Subprime Loans,”
Quarterly Journal of Economics 125, 307–362.