Munich Personal RePEc Archive
Multi-Battle Contests: An Experimental
Study
Mago, Shakun and Sheremeta, Roman
17 September 2016
Online at
https://mpra.ub.uni-muenchen.de/74524/
1
Multi-Battle Contests: An Experimental Study
Shakun D. Mago a and Roman M. Sheremeta b,c*
a Department of Economics, Robins School of Business, University of Richmond,
28 Westhampton Way, Richmond, VA 23173, USA
b Weatherhead School of Management, Case Western Reserve University
11119 Bellflower Road, Cleveland, OH 44106, U.S.A.
c Economic Science Institute, Chapman University
One University Drive, Orange, CA 92866
September 17, 2016
Abstract
We examine behavior of subjects in simultaneous and sequential multi-battle contests, where each individual battle is modeled as an all-pay auction with complete information. In simultaneous best-of-three contests, subjects are predicted to make positive bids in all three battles, but we find that subjects often make positive bids in only two battles. In sequential contests, theory predicts sizable bids in the first battle and no bids in the subsequent battles. Contrary to this prediction, subjects significantly underbid in the first battle and overbid in subsequent battles. Consequently, instead of always ending in the second battle, contests often proceeds to the third battle. Finally, although the aggregate bid in simultaneous contests is similar to that in sequential contests, in both settings, subjects make higher aggregate bids than predicted. The observed behavior of subjects can be rationalized by a combination of multi-dimensional iterative reasoning and a non-monetary utility of winning.
JEL Classifications: C72, C91, D72
Keywords: multi-battle contest, experiments, iterative reasoning, overdissipation
* Corresponding author: [email protected]
2
1. Introduction
In multi-battle contests, players expend resources in order to win a series of individual
battles and the player who wins a certain pre-determined number of battles wins the overall contest
and receives the prize. For instance, consider a competition between two firms for a patent. Each
firm must allocate resources to R&D in order to advance the innovation and secure the patent, but
only the first firm to complete all stages of development gets the patent, while the competitor gets
nothing. Similarly, a commander needs to win a majority of the battles in order to win the war.
Such multi-battle contests can be characterized along a number of different dimensions such as
asymmetry in resources, asymmetry in objectives, number of battles, interdependency between
battles, and the sequence of play. Over the years, significant theoretical advancements have been
made in examining how these factors impact behavior, resulting in a number of interesting
predictions in the fields of patent races (Dasgupta, 1986; Konrad and Kovenock, 2009), R&D
competitions (Harris and Vickers, 1985, 1987), multi-unit auctions (Szentes and Rosenthal, 2003),
sports championships (Szymanski, 2003), network security (Hausken, 2008; Levitin and Hausken,
2010), elections (Snyder, 1989; Klumpp and Polborn, 2006) and redistributive politics (Laslier,
2002; Roberson, 2008).1 However, the predictive power of these models is difficult to test using
field data. Laboratory experiments, on the other hand, provide a controlled environment more
conducive to collect direct empirical evidence.2
This paper reports an experimental investigation of two theoretical models of a multi-battle
contest by Szentes and Rosenthal (2003) and Konrad and Kovenock (2009). Their common
1 For the review of the theoretical literature see Kovenock and Roberson (2012).
3
framework captures a contest environment wherein players allocate resources (bids) over three
battles, and the player expending the highest bid wins the individual battle with certainty. Both
models assume that the player who wins a majority (two out of three battles) wins the contest and
gets the prize (minus his bids) while the loser gets nothing but must still pay her bids. Thus, each
individual battle is an all-pay auction with complete information.3 In the literature, this is a popular
method of modeling environments where outcome is deterministic and not influenced by random
exogenous noise. The models mainly differ in the timing of battles: Szentes and Rosenthal’s model
captures simultaneous multi-battle contest (players allocate resources in all three battles
simultaneously) while Konrad and Kovenock’s model captures sequential multi-battle contest
(players observe the outcome of the first battle before making the bid decision for the second battle,
and so on). The expected level of total expenditure in both models is equal to the value of the prize,
yielding players zero expected payoffs in equilibrium. However, the difference in the temporal
sequencing of battles yields marked difference in the predicted bid behavior in individual battles.
In case of simultaneous contest, players are predicted to make positive and symmetric bids in all
three battles, with bids restricted by certain theoretical boundaries. In case of sequential contest,
players are predicted to make sizable bids only in the first battle and (almost) no bids in the
subsequent battles. Contrary to these theoretical predictions, we find that subjects in simultaneous
best-of-three contests often make positive bids in only two, instead of all three, battles and they
significantly overuse moderately high bids. In sequential contests, subjects significantly underbid
in the first battle and overbid in subsequent battles. Consequently, instead of always ending in the
second battle, contests often proceeds to the third battle. Finally, although the aggregate bid in
4
simultaneous contests is similar to that in sequential contests, in both settings, subjects make higher
aggregate bids than predicted.
The observed behavior of subjects can be rationalized by a combination of a
multi-dimensional iterative reasoning (Arad and Rubinstein, 2012) and a non-monetary utility of winning
(Sheremeta, 2010a, 2010b). The multi-dimensional iterative reasoning suggests that, instead of
using the “best response,” subjects evaluate the “proper response” to the various features of
strategies. This suggests that subjects first decide on their total expenditure across all three battles,
and then the number of battles and the level of bids in each battle. This explains the
non-equilibrium behavior across battles. At the same time, subjects derive a non-monetary utility from
the act of winning itself, which explains aggregate overbidding.
The results of our experiment might be of particular interest for public policy on patents
and innovation. Beginning with the seminal papers by Loury (1979) and Lee and Wilde (1980),
patent races have been often stylized as a contest between firms investing in R&D efforts with the
aim of securing the ultimate prize, a patent. However, the literature is mostly theoretical (e.g.,
Harris and Vickers, 1985, 1987; Baye and Hoppe, 2003) and the predictions rely heavily on a set
of stringent assumptions making it difficult to establish its relevance to the real world patent races.
For instance, our sequential multi-battle contest is predicted to be behaviorally similar to a
single-battle all-pay contest since winning the first single-battle (or ε-preemption) is all that is needed to win the
entire contest. Our experimental results, on the other hand, can reflect on the strategic interaction
between competitors as the race unfolds – the loss in the first battle does not deter the competitor
from engaging in subsequent battles, and therefore mimic the real world patent races more closely.
Similar parallels can be made for the simultaneous multi-battle contests. Our experimental results
5
processes as opposed to the traditional 'spray and pray' or ‘one size fits all’ approach that emerges
from the theoretical analysis (Bayus and Mehta, 1995). Since in practice it is often hard to identify
patent races because firms may file for patents for reasons other than outperforming their rivals,
there is severe scarcity of field studies. Our experiment provides both direct, even if minimal, test
of the theory as well as the next best explanation for the observed counterfactual results. Our
findings underscore the importance of continued empirical investigation of the theoretical models
of multi-battle contests if they are to be applied to explain patent races and innovation.
The rest of the paper is organized as follows: In Section 2 we review the literature – both
theoretical and experimental – on simultaneous and sequential contests. In Section 3 we briefly
describe the theoretical framework and the implied predictions for the experiment. Section 4
details the experimental design and procedures. Section 5 reports the results of the experiment and
Section 6 concludes.
2. Literature Review
The theoretical literature on simultaneous multi-battle contests goes back to the original
formulation of a Colonel Blotto game by Borel (1921). Colonel Blotto game is an archetype of the
strategic multi-dimensional resource allocation problem – players must simultaneously allocate
their resource endowment across n-battles, with the objective of maximizing the expected number
of battles won. In each battle, the player who allocates the highest level of resources wins, and the
payoff from the whole contest is contingent on the number of wins across all individual battles.
The optimal strategy is a randomized allocation such that all battles are treated symmetrically and
the marginal distribution of resources is essentially uniform in each battle (Roberson, 2006; Hart,
6
redistributive politics (Laslier, 2002; Roberson, 2008), military and systems defense (Kovenok
and Roberson, 2015), vote buying (Myerson, 1993), package auctions (Milgrom, 2007) and
political campaigns (Snyder, 1989; Klumpp and Polborn, 2006). The original constant-sum
formulation of the game featured “use it or lose it” so that resources which are not allocated to one
of the battles are forfeited and lose all value to the player. However, there are a number of
applications where the unused resources retain their positive value and the resulting game is a
non-constant-sum game. For example, resources not allocated to R&D may be used for advertising by
the firms. Our simultaneous multi-battle contest is a non-constant-sum game of Szentes and
Rosenthal (2003) in which the objective of each player is to win a majority (two out of three) of
the battles.4 Szentes and Rosenthal refer to this as a simultaneous “pure chopstick” auction, where
chopsticks are suggestive of identical objects that useless except in pairs. Although the focus of
Szentes and Rosenthal (2003) is on a winner-pay first-price auction, they also state the results for
an all-pay auction without the formal proof.5
Experimental studies on simultaneous multi-battle contests are fairly recent, and mostly
feature the constant-sum formulation. Avrahami and Kareev (2009) study a discrete version of
Colonel Blotto game where players have asymmetric resources, while Chowdhury et al. (2013)
test the continuous version under partners and strangers matching protocols. Arad (2012) examines
a modified Colonel Blotto game where players have to choose from a small set of allocation
decisions. A few studies have studied multi-battle contest games with asymmetric battles.
Horta-Vallve and Llorente-Saguer (2010) and Avrahami et al. (2014) examine contests with additive
objective function and differing valuation for battles. Both Duffy and Matros (2015) and Montero
7
et al. (2016) examine contests with majoritarian objective function but differ in the way in which
winner in each battle is determined (auction versus lottery contest success function). Despite the
numerous differences in these studies a common result emerges: consistent with the theoretical
predictions, most of the time players use a ‘complete coverage’ strategy when they have equal or
more resources than the opponent, and use a ‘guerilla warfare’ strategy when they have fewer
resources.Unlike these above-mentioned studies, we examine a simultaneous multi-battle contests
with majoritarian objective function where both players and individual battles are symmetric, and
players need not allocate all their resources to the contest (i.e., a non-constant-sum formulation).6
The theoretical literature on sequential multi-battle contests originated with seminal work
by Fudenberg et al. (1983). In their model, two identical firms simultaneously decide how much
effort to put in R&D. After observing the result of the first battle, firms move on to the next battle.
Fudenberg et al. find that firm which leads by two or more battles becomes a monopoly and the
firm which lags behind drops out of the competition. That is, in equilibrium the expenditure across
battles is “frontloaded.” Subsequent papers have investigated the sequence of the decisions
(Klumpp and Polborn, 2006), asymmetry between players (Budd et al., 1993), impact of discount
factors (Harris and Vickers, 1985, 1987), budget constraints (Leininger, 1991), and intermediate
prizes (Gelder, 2014). Our sequential multi-battle contest is a dynamic game of Konrad and
Kovenock (2009) with complete information where each battle is an all-pay auction.
Experimental studies on sequential multi-battle contests mostly feature elimination
contests wherein players compete within their own groups by expending efforts, and the winner of
8
each group proceeds to the second round (Parco et al., 2005; Amegashie et al., 2007; Sheremeta,
2010a, 2010b; Altmann et al., 2012). To the best of our knowledge, there are only three studies
that examine the best-of-n sequential framework similar to ours. Zizzo (2002) studies a patent race
similar to Harris and Vickers (1987) and finds that contestants compete more aggressively than
predicted. Mago et al. (2013) examine the impact of intermediate prizes and luck on bidding
behavior in a best-of-three contest. Irfanoglu et al. (2015) compare behavior in sequential versus
simultaneous best-of-three contests. The main difference is that all these studies feature lottery
contests as opposed to an all-pay auction. If the probability of winning a battle is contingent on
player’s own bid divided by the sum of total bid expenditure as in the Tullock lottery contest, there
is a unique pure strategy Nash equilibrium. However, if the selection of battle winner is
deterministic as in the all-pay auction, the Nash equilibrium is in mixed strategies. Our study is
the first to examine bidding behavior in a sequential multi-battle contest with deterministic all-pay
contest success function.7
3. Theoretical Model and Predictions
3.1. General Model
Assume that there are two risk-neutral players, 𝑋 and 𝑌, competing in a series of battles for
a commonly known prize value 𝑣.The number of battles is 𝑛 = 3. Let 𝑥𝑖 and 𝑦𝑖 be the amount of
resources (bid) spent by players 𝑋 and 𝑌 in battle 𝑖. The contest success function is deterministic
in the sense that player making the highest bid wins the battle with certainty. To win the overall
contest and receive the prize, a player has to win a majority of the battles, i.e. at least 𝑘 = (𝑛 +
9
1)/2 = 2 battles. The net payoff of 𝑋 (similarly to 𝑌) is equal to the value of the prize (if he wins)
minus the total bid he has spent during the contest:
𝜋𝑋 = {𝑣 − ∑ 𝑥𝑖 𝑛
𝑖=1 if 𝑋 wins the contest
− ∑𝑛𝑖=1𝑥𝑖 otherwise (1)
The battles in the contest proceed either simultaneously or sequentially. In the simultaneous
multi-battle contest, players simultaneously choose bids 𝑥𝑖 and 𝑦𝑖 for all battles 𝑖 =1, 2, 3. Then,
the winner of each battle is determined and the player who wins at least 𝑘 = 2 battles wins the
overall contest and obtains the prize. In the sequential multi-battle contest, players simultaneously
choose bids 𝑥1 and 𝑦1 in battle 1. After determining the winner of battle 1, they move on to battle
2 where they choose 𝑥2 and 𝑦2. Players compete until one player has accumulated the required
𝑘 = 2 victories.
3.2. Simultaneous Multi-Battle Contest
The solution to the simultaneous non-constant-sum multi-battle contest exists only for
three battles and can be found in Szentes and Rosenthal (2003) and Kovenock and Roberson
(2012). When 𝑘 = 2 and 𝑛 = 3, there is a unique, symmetric mixed strategy Nash equilibrium.8
In the equilibrium, player 𝑋 makes a draw (𝑥1, 𝑥2, 𝑥3) from a uniform probability measure on the
three-dimensional surface defined by four points (𝑣2,𝑣2, 0), (𝑣2, 0,𝑣2), (0,𝑣2,𝑣2), and (0,0,0); and
then allocates ((𝑥1)2, (𝑥2)2, (𝑥3)2) to the three battles according to the joint cumulative
distribution function 𝐹(𝑥12, 𝑥22, 𝑥32) =𝑥1𝑥2
𝑣 +
𝑥1𝑥3
𝑣 +
𝑥2𝑥3
𝑣 −
(𝑥1)2+(𝑥2)2+(𝑥3)2
2𝑣 . The marginal
distribution in each battle is given by 𝐹(𝑥) = √2𝑥
𝑣 with 𝑥 ∈ [0, 𝑣
2]. The expected total bid
10
expenditure by both players is equal to the value of the prize; and therefore, in equilibrium, the
expected payoff to each player is 𝐸(𝜋𝑋) = 𝐸(𝜋𝑌) = 0.
3.3. Sequential Multi-Battle Contest
The solution to the sequential multi-battle contest can be found in Konrad and Kovenock
(2009). In contrast to the simultaneous contest, battles proceeds sequentially, and both players
simultaneously choose their bids in each battle. Players learn the outcome of the preceding battle
before moving to the next battle. Note that the contest can end in two battles if the winner of battle
1 also wins battle 2. In the subgame perfect Nash equilibrium, in battle 1 player 𝑋 (similarly 𝑌)
uniformly randomizes according to the distribution function 𝐹(𝑥) =𝑥
𝑣 with 𝑥 ∈ [0, 𝑣]. The winner
of battle 1 then proceeds to win the overall contest with probability one by incurring minimal bid
expenditure in battle 2.9 Note that since only battle 1 is pivotal for determining the contest winner,
sequential multi-battle contest of Konrad and Kovenock is behaviorally similar to a single battle
all-pay auction. The expected total bid expenditure by both players is equal to the value of the
prize; and therefore, in equilibrium, the expected payoff to each player is 𝐸(𝜋𝑋) = 𝐸(𝜋𝑌) = 0.
11
4. Experimental Design and Procedures
Within the multi-battle contest framework, we employ two treatments: sequential and
simultaneous. In the simultaneous treatment, two players simultaneously decide on their bidding
strategy across three battles, and the player who wins two battles wins the contest. In the sequential
treatment, two players compete in a sequence of battles, and the first player to win two battles wins
the contest. For our chosen parameters, the theoretical prediction for both treatments is shown in
Table 1.
We ran a total of six experimental sessions (three for each treatment). Each session had 12
subjects, all of whom were recruited from undergraduate student population at Chapman
University. No subject participated in more than one session, although some had participated in
other economics experiments that were unrelated to this research. The computerized experimental
sessions were programmed using z-Tree (Fischbacher, 2007). Throughout the session no
communication between subjects was permitted and all choices and information were transmitted
via computer terminals. Thus, all decisions were anonymous. Subjects were given the instructions,
available in the Appendix, and the experimenter read the instructions aloud as subjects followed
along on paper. Before the start of the experiment, subjects completed an online questionnaire that
tested their comprehension of the instructions. The experiment started only after all subjects had
answered the quiz questions, and explanations were provided for any incorrect answers.10
Each experimental session corresponded to 20 periods of play in one of the two treatments.
In every period, the 12 subjects were randomly and anonymously placed into 6 groups with 2
players in each group. It was common knowledge that the valuation of prize was identical across
all bidders and equal to 100 francs. Subjects were not allowed to bid more than 100 francs in any
12
battle and were informed that regardless of who wins the contest, all subjects would have to pay
their bids. Subjects were also instructed that in each battle the bidder with the higher bid wins, and
in case of a tie, winner is determined by a random coin flip. In the simultaneous treatment subjects
were asked to make bids in each of the 3 battles simultaneously.11 After subjects submitted their
bids, the computer displayed own bid, the opponent’s bid, the winner of each battle, the overall
contest winner and the individual earnings that period. In the sequential treatment subjects
participated either in two or three battles. At the end of each battle, the computer displayed own
bid, the opponent’s bid, the winner of that battle. The period ended when one of the subjects in the
group won two battles. At the end of each period subjects were randomly re-grouped to form a
new 2-player group. The instructions explained the structure of the game in detail using a number
of illustrative examples.
At the end of the experiment, 2 out of 20 periods were randomly selected for payment. The
sum of the earnings for these 2 periods was exchanged at rate of 25 francs = $1. Additionally, all
subjects received an initial endowment of $20 to cover potential losses. On average, subjects
earned $21 each, which was paid anonymously and in cash, and earnings varied between $14 and
$29. The experimental sessions lasted for about 60 minutes.
5. Results
5.1. Aggregate Results
Table 1 summarizes the equilibrium predictions and the aggregate results of the
experiment. First notable feature of the data is that there is strong aggregate overbidding in both
treatments. The average total bid in the simultaneous treatment is 69.2 and in the sequential
13
treatment it is 59.6, as compared to the theoretically predicted bid of 50. A standard Wald test,
conducted on estimates of mixed-effects models, rejects the hypothesis that the average total bids
in the simultaneous or sequential treatments are equal to the predicted bid (both p-values < 0.01).12
Such significant overbidding relative to the Nash prediction emerges with regularity in
experimental literature on contests and all-pay auctions (see the review by Dechenaux et al.,
2015).13
Result 1: Average total bid in the simultaneous and sequential contests is significantly
higher than predicted.
Figures 1, 2 and 3 show that overbidding is not reduced with experience. The coefficient
on the time trend variable indicates that the bids increase in both the sequential and simultaneous
treatment (both p-values < 0.01). To further elaborate on the overbidding behavior, following Baye
et al. (1999), we employ two concepts of overdissipation. Baye et al. define aggregate
overdissipation as the sum of bids by both players being greater than the value of the prize, and
individual overdissipation as sum of bids by a single player being greater than the value of the
prize. In both treatments, mixed strategy Nash equilibrium precludes the possibility of
overdissipation in expectation: equilibrium aggregate dissipation is equal to the value of the prize
(100), and there is no individual overdissipation since any bid greater than 100 would guarantee a
negative payoff. However, since equilibrium involves nondegenerate mixed strategies, for
12 To support these conclusions we estimated a mixed-effects model for each treatment. We have 720 observations for each treatment (3 sessions × 12 subjects × 20 periods). The dependent variable in the regression is the total bid and the independent variables are a constant and a period trend. The model included a mixed-effects error structure, with subject and session as the random effects, to account for the multiple decisions made by each subject and random re-matching within a session. The standard Wald test conducted on estimates of a model, shows that the average bid in both treatments is significantly higher than predicted.
14
particular realizations of the players’ mixed strategies, aggregate bids may exceed the value of the
prize. That is, the game exhibits probabilistic aggregate overdissipation. Baye et al. show that for
a single-battle all-pay auction, the probability of aggregate overdissipation is 0.5 when there are 2
players. In contrast to these predictions, Gneezy and Smorodinsky (2005) and Lugovskyy et al.
(2010) find aggregate overdissipation at 0.84 and 0.88, respectively. In our experiment, the
incidence of aggregate overdissipation is 0.83 in simultaneous treatment and 0.62 in sequential
treatment. Finally, the average level of overbidding (relative to the expected prize) is 38.3% in the
simultaneous treatment and 19.2% in the sequential treatment (can also be roughly inferred from
Figures 1 and 2). Finally, note that probabilistic individual overdissipation is a dominated strategy
since a player can guarantee a payoff of at least zero by bidding zero. In both treatments we find
very few sporadic incidences where individual players bid more than the prize value of 100 (0.02
in simultaneous treatment and 0.07 in sequential treatment).14
To make a direct comparison between simultaneous and sequential multi-battle contests,
recall that according to the theoretical predictions of Szentes and Rosenthal (2003) and Konrad
and Kovenock (2009) the expected level of total expenditure in both contests should be equal to
the value of the prize. Therefore, both simultaneous and sequential multi-battle contests should
result in the same aggregate bids. Figure 3 shows that the aggregate bids in both treatments over
all 20 periods. A mixed-effects regression of total bid on the treatment dummy variables and a
time trend indicates that the average bid in the simultaneous contest is higher than in the sequential
contest (p-value = 0.03). However, the difference between the two contests becomes only
15
marginally significant if we focus on the last 10 periods of the experiment (p-value = 0.06) and
not significant when we restrict to only the last 5 periods of the experiment (p-value = 0.21).
Result 2: The aggregate bid in simultaneous contests initially is higher than in sequential
contests, although there is convergence over time.
Next, we take a closer look at the individual battle behavior in both sequential and
simultaneous contests.
5.2. Simultaneous Contest
Theoretical prediction for simultaneous contest is that in each battle players should
randomize between 0 and 50 according to the cumulative distribution function 𝐹(𝑥) = √𝑥
50, with
an average bid of 16.7 in each battle. Figure 4 displays the empirical distribution of bids aggregated
over all subjects and across all periods. In all three battles, the interval over which subjects
randomize is between 0 and 50, with less than 5% of bids above 50. Thus, the aggregate behavior
largely conforms to the equilibrium predictions. The overall distribution of bids is also remarkably
similar in the three battles.
Result 3: In the simultaneous contest, bids fall within the predicted boundaries.
Although the main qualitative predictions of Szentes and Rosenthal (2003) model are
supported, there are several interesting behavioral deviations from the theory. First, as stated in
Result 1, there is significant overbidding, with bid in each battle averaging at 23.1 compared to
the predicted level of 16.7. Figure 4 shows that instead of a concave distribution, bids are
distributed according to a convex/linear cumulative distribution function. Second, there is evidence
of positional order effects, i.e. the effect arising of the ordering of battles in the onscreen
16
the average bid in battle 3 (21.9).15 Third, and most importantly, contrary to the theory, players do
not employ ‘stochastic complete coverage.’ Figure 4 indicates that there is a mass point at 0 in
each of the three battles, suggesting that subjects do not make any bids in a given battle around
20% of the time. In fact, there is pronounced bi-modality in subject choices, with subjects making
either very small bids (bids less than or equal to 1 amount to 24.6% of the bids) or very large bids
(bids greater than or equal to 30 amount to 42.6% of the bids). A closer look at the individual data
shows that subjects make positive bids in all three battles only 62% of the time (instead of 100%),
and they make positive bids in two out of three battles 35% of the time (instead of 0%).
Furthermore, the choice of the number of battles is individual specific. We find that 61% of the
subjects can be characterized as ‘equilibrium bidders’ (defined as subjects who allocate their
resources across all three battles more than 60% of the time) and 28% as ‘guerilla bidders’ (defined
as subjects who are more likely to focus their attention on two battles).
Result 4: In the simultaneous contest, subjects significantly overuse moderately high bids
and 35% of the time they make positive bids in only two out of three battles (instead of all three).
It is important to emphasize, that such non-optimal behavior is costly. Given that others
bid 0 in some battles, one can increase the chance of winning substantially by simply making a
very cheap bid of 0.1.16 Therefore, error-based behavioral models, such as quantal response
equilibrium (McKelvey and Palfrey, 1995), would not be a good explanation for Result 4.
However, Result 4 can be rationalized by a multi-dimensional iterative reasoning proposed by
Arad and Rubinstein (2012). They argue that in some games, including multi-battle contests, the
feasible strategy space is so complex in structure that it is very difficult (if not impossible) for
15 This echoes findings by Chowdhury et al. (2013) and Montero et al. (2016).
17
human players to compute the “best response.” This forces players to evaluate the “proper
response” to the various features (or “dimensions”) of strategies rather than focus on the “best
response” strategies per se. The decision process entails that the player decides on each of the
various dimensions of her strategy separately and then integrates her choices across these
dimensions to formulate her overall strategy. The dimensions of strategy in the simultaneous
multi-battle contest can, for instance, include total expenditure, the number of chosen multi-battles, and the
level of bids across chosen battles.17
In our data, we observe patterns that are consistent with a multi-dimensional iterative
reasoning whereby subjects choose to focus on certain dimensions of strategy. For example, the
total dissipation rate is very similar whether subjects bid in all three or in the chosen two battles.
The average total bid across three battles is 69.2 and across two battles is 75.2. This suggests that
even though the budget constraint is not binding, players decide on their total expenditure (a
dimension of strategy) and it is fairly similar whether they bid on two or three battles. The fact that
the aggregate bid is higher than predicted can be explained by another well-documented finding
that in addition to monetary prize, subjects have a non-monetary utility of winning (Sheremeta,
2010a, 2010b; Price and Sheremeta, 2011, 2015; Cason et al., 2012, 2016).
Besides the total expenditure, another aspect of strategy dimension is allocation across
individual battles. According to an iterative process described by Arad and Rubinstein (2012),
“proper response” to bidding in all three battles is to “reinforce” two battles because more
resources in each reinforced battle increases the likelihood of winning those battles and (given the
majoritarian objective function) the overall contest. Consistent with this, we find that 35% of the
18
time subjects make bids in only two battles. The next iterative step is that if other players are
focusing on a minimal winning set of battles, a player may be strictly better off by allocating some
resources to the third battle. Accordingly, we find that when subjects make positive bids in all 3
battles, about 40% of the time the minimal bid is less than or equal to 1.18 Finally, we find
homogenous allocation strategy to be a dominant method of bidding across battles: 58.9% of the
time when subjects make positive bids in only two battles they choose the same bid across the two
battles, and 59.3% of the time when subjects make positive bids in all three battles they choose the
same bid across any two battles. Only 10.4% of the time subjects choose the strategy of spreading
their resources equally across all three battles.
To summarize, in the simultaneous multi-battle contest there is no one “best response”
strategy that would guarantee a win in all situations. Given the complexity and the size of the
strategy space, it is plausible to assume that players bounded by their reasoning capabilities often
use heuristics. We do not claim that multi-dimensional iterative reasoning explains behavior of all
subjects; or in fact, there exists one single procedure that explains the decision process for all.
However, multi-dimensional reasoning can explain why some subjects choose to use ‘guerilla
warfare’ strategy by making positive bids in only two out of three battles or even a minimal bid in
the third battle.19 In addition, a non-monetary utility of winning can explain why the aggregate
18 Interestingly, the probability of winning the contest when subjects make positive bids in only two battles is 0.58 and when they make positive bids in all three battles is 0.48. This difference in the likelihood of winning is significant (p-value < 0.01). To support this conclusion we estimated a probit model, where the dependent variable is the probability of winning the overall contest and the independent variables are a constant, a period trend and a dummy variable of whether the subject made positive bids in only two battles or in all three battles.
19
level of expenditure is significantly higher than predicted. Taken together, behavior of subjects in
the simultaneous multi-battle contest can be rationalized by a combination of a multi-dimensional
iterative reasoning and a non-monetary utility of winning.
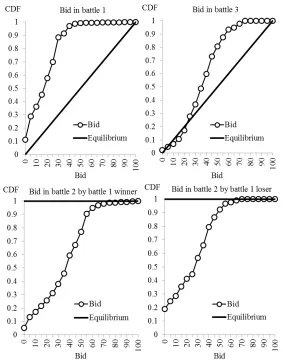
5.3. Sequential Contest
Next we analyze individual battle bidding behavior in the sequential multi-battle contest.
The theoretical prediction of Konrad and Kovenock (2009) is clearly rejected by the data, for all
three battles. In battle 1, theory predicts that each player should uniformly randomize between 0
and 100, with an expected average bid of 50. Instead, subjects on average bid 16.7 in battle 1
(Table 1). Moreover, from Figure 5, it is clear that instead of a uniform distribution between 0 and
100, there are virtually no bids above 50 (less than 1% of bids are above 50). In battle 2, theory
predicts that the loser of battle 1 should bid 0 and the winner should bid 0.1 (an “epsilon”). This
theoretical prediction is also rejected by the data. Instead of bidding zero, loser of battle 1 bids
24.7, while winner of battle 1 bids 34.0. Finally, the subgame perfect equilibrium for battle 3 is
equivalent to a simple all-pay auction with two symmetric players (since both players have won
one battle each). Therefore, the equilibrium strategy in battle 3 is to randomize uniformly between
0 and 100, with the expected average bid of 50. Figure 5 shows that, instead, subjects randomize
between 0 and 70, with the average bid of 35.7. Overall, contrary to prediction, bids in battles 2
and 3 are significantly higher than the bid in battle 1 (p-value < 0.01).20
20
Result 5: In the sequential contest, subjects significantly underbid in the first battle and
make significantly higher bids in the subsequent battles.
Note that in equilibrium, the sequential contest should never proceed to battle 3. This is
because the loser of battle 1 should give up in battle 2, and thus the winner of battle 1 should win
battle 2 with probability one. However, as indicated by Result 4, major competition happens not
in battle 1 but in the subsequent battles. As a result, the contest proceeds to the third battle 38% of
the time, instead of predicted 0%. Figure 2 displays the average bid in each battle over 20 periods
of the experiment. It appears that the aggregate pattern of behavior does not change with
experience. Moreover, in all periods, the bidding expenditure profile features a “hold-up”:
successful participation in later battles requires substantial bids, and this makes it less attractive to
allocate higher bids in the preliminary battles.
Result 6: In the sequential contest, instead of ending the contest in the second battle,
contest proceeds to the third battle 38% of the time.
Theory also predicts that the winner of battle 1 wins the overall contest with absolute
certainty. We find that the probability of battle 1 winner winning the overall contest is 0.8, which
is significantly lower than the theoretical prediction of 1 (p-value < 0.01). This can be explained
by the fact that the loss in battle 1 does not discourage the loser and he continues to bid positive
amount in battle 2. Consequently, battle 1 winner continues his winning streak in battle 2 only
62% of time. In battle 3, theory predicts that both players are equally likely to win, and indeed, we
find that winner of battle 1 wins the third battle 48% of the time.
Result 7: In the sequential contest, the likelihood of the winner of the first battle winning
21
Results 5 to 7 indicate that the behavior of subjects in the sequential contest poses a
challenge to the theoretical predictions of Konrad and Kovenock (2009). Since it cannot be
explained using the best response framework, we provide behavioral explanations for the observed
datathat encompass both iterative reasoning and utility of winning.21
We begin by analysing behavior in battle 1. The data show that instead of a predicted
average bid of 50, the average bid in battle 1 is 16.7. This significantly lower expenditure can be
interpreted as a “proper response” (Arad and Rubinstein, 2012) to the observation that most of the
competition occurs in later battles, as opposed to the predicted “frontloaded” expenditure pattern.
Since successful participation in later battles requires substantial bids, it seems prudent to conserve
resources in the preliminary battle. For instance, an expenditure of 50 (when other players are
bidding smaller amounts) may win the player battle 1 with certainty, but it would restrict her
strategy space in later battles and/or reduce her overall profit margin.
In battle 2, we find significant overbidding by both the loser and the winner of battle 1 –
the loser of battle 1 bids 24.7 while the winner of battle 1 bids 34. Based on the assumption that
subjects care only about their monetary prize, standard theory predicts that the loser of battle 1 will
suffer from a dramatic decrease in his continuation value for the next battle, and accordingly will
not bid a positive amount. However, if we incorporate winning as a component in the subject’s
utility function (Sheremeta, 2010a, 2010b), the decline in continuation value for battle 2 is not so
22
dramatic. In fact, the loser of battle 1 may not only have a non-monetary utility of winning battle
2, but may also expect to receive an additional utility from a possible win in battle 3. Such utility
inherently transforms the game into a multi-battle sequential contest with intermediate prizes; and
one of the fundamental theoretical results in the sequential contest with intermediate prizes is that
“the player who is lagging behind may catch up, and does catch up with a considerable probability
in the equilibrium” (Konrad and Kovenock, 2009, page 267).22 This explanation is consistent with
our finding that the loser of battle 1 makes positive bid in battle 2, and thus wins 38% of the time
in battle 2 and 20% of the time in the overall contest.23
In battle 3, there is no overbidding – the average observed bid is 35.7 and the expected bid
is 50. However, this underbidding in battle 3 is less surprising if we account for the extent of
overbidding in battle 2. Subjects who get to battle 3 have already made positive bids in the previous
two battles, and may choose to use a restricted strategy space if they are to make a positive profit
(or if they have a specific budget constraint in mind). A mixed-effects regression shows that there
is a negative relationship between bid in battle 3 and total bid expenditure in the previous two
battles (p-value = 0.06). This reduced expenditure in battle 3 can be interpreted as a “proper
response” in a multi-dimensional iterative reasoning framework. To account for the impact of
previous battle expenditures, we also compute the empirical “proper bid” in battle 3 using
individual subject data. Specifically, this proper bid is the difference between the expected prize
value of 50 and the bids already incurred in battles 1 and 2. Under the premise of no individual
overdissipation, subjects should not bid greater than the proper bid in battle 3. However, if the
22 In an experimental test of multi-battle contests with lottery contest success function, Mago et al. (2013) also find that intermediate prizes lead to significantly higher dissipation by both players, and reduced probability of the contest ending in 2 rounds.
23
perceived value of the prize is greater than 50 (i.e., subjects have a non-monetary value of winning
the contest) we may observe bids that are higher than the proper bid. Indeed, we find that 87.6%
of the time subjects’ bids in battle 3 are greater than their proper bid, suggesting that both a
multi-dimensional iterative reasoning and a non-monetary utility of winning are necessary to explain
non-equilibrium behavior in sequential contests.
6. Conclusion
This paper examines behavior of subjects in simultaneous and sequential multi-battle
contests where each component battle is an all-pay auction with complete information. Our
experiment provides some support for the qualitative predictions of Szentes and Rosenthal (2003),
i.e. bids in the simultaneous multi-battle contest fall within the predicted boundaries. However,
instead of the ‘complete stochastic coverage’ strategy, subjects employ the ‘guerilla warfare’
strategy by having a significant mass point at zero in each battle. Specifically, 35% of the time
subjects make positive bids in only two out of three battles (instead of all three) and also
significantly overuse moderately high bids. In case of sequential contest, data are clearly
inconsistent with the predictions of Konrad and Kovenock (2009). Theory predicts sizable bids in
the first battle and no bids in the subsequent battles. Contrary to this prediction, subjects
significantly underbid in the first battle and make substantially higher bids in the subsequent
battles. As the result, instead of always ending in the second battle, contest proceeds to the third
battle 38% of the time. Finally, in both simultaneous and sequential settings, subjects make higher
aggregate bids than predicted. We identify possible behavioral explanations for the lack of support
for the equilibrium predictions of each model that incorporate both multi-dimensional iterative
24
Multi-battle contests are prevalent in many real life situations and are readily applicable to
a number of important strategic environments (e.g., multi-unit auctions, R&D and patent races,
network security, conflicts, sports championship series, elections, redistributive politics).
Therefore, it is hardly surprising that there has been an increased interest in the literature on
multi-battle contests and many significant theoretical advancements have been made over the past decade
byprominent scholars across a range of disciplines. The predictive power of most of these models,
however, has not been tested because of paucity of suitable field data. Our experimental findings
emphasize the importance of empirical investigation of the theoretical models of multi-battle
contests. We find that although neither model of the multi-battle contest predicts individual
behavior accurately, qualitatively speaking, the static model of Szentes and Rosenthal (2003) is a
better predictor than the dynamic model of Konrad and Kovenock (2009). We believe that this
discrepancy in predictive power might be of interest to contest designers – both theorists and
practitioners in the field. The result that early loss in the sequential multi-battle contest does not
prompt the player to leave the field to its competitor can also be utilized to study how patent races
spur innovation wars (Scotchmer, 2006). Similarly, the guerilla warfare strategy adopted by
contestants in the simultaneous multi-battle contest may be harnessed in policy recommendations
to avoid wasteful duplication of effort. Our aim is not to formulate a precise theory of choice in
these situations, and instead we propose a reasoning of strategy dimensions that can shed light on
various decision considerations that arises in a contest framework. Future theoretical research
should focus on how to incorporate these behavioral considerations into formal models of
multi-battle contests.
Our findings also contribute to the recent studies investigating behavior in Colonel Blotto
25
find strong support for theory, we find that individual behavior significantly diverges from the
theoretical predictions, both quantitatively (in terms of the magnitude of overbidding) and
qualitatively (in terms of the strategies used). A possible explanation for these differences is that
we examine non-constant-sum multi-battle contests which allow for overdissipation, while
Colonel Blotto game studies examine constant-sum multi-battle contests where resource allocation
is restricted. Another explanation is that we examine a majoritarian objective function (i.e., the
player winning the best of three battles wins the overall contest), while Colonel Blotto game studies
examine proportional objective function (i.e., each battle has its separate reward). Whether it is the
non-constant-sum nature or the majoritarian objective function that drives the difference between
our findings and the findings of previous Colonel Blotto game studies is also an interesting
question for future research.
Our experiment points out several fruitful avenues for future theoretical research. Perhaps
one of the most interesting ones pertains to the excessive use of the ‘guerilla warfare’ strategy in
simultaneous multi-battle contests. What kind of behavioral considerations would produce the
‘guerilla warfare’ strategy, instead of the ‘complete stochastic coverage’ strategy, as an
equilibrium strategy? Similarly, in case of sequential multi-battle contests, it would be important
26
References
Altmann, S., Falk, A., & Wibral, M. (2012). Promotions and incentives: The case of multi-stage elimination tournaments. Journal of Labor Economics, 30, 149-174.
Amegashie, J.A., Cadsby, C.B., & Song, Y. (2007). Competitive burnout: Theory and experimental evidence. Games and Economic Behavior, 59, 213-239.
Arad, A. (2012). The tennis coach problem: A game-theoretic and experimental study. The B.E. Journal of Theoretical Economics, 12, 10.
Arad, A., & Rubinstein, A. (2012). Multi-dimensional iterative reasoning in action: The case of the Colonel Blotto game. Journal of Economic Behavior and Organization, 84, 571-585. Avrahami, J., & Kareev, Y. (2009). Do the weak stand a chance? Distribution of resources in a
competitive environment. Cognitive Science, 33, 940-950.
Avrahami, J., Kareev, Y., Todd, P.M., & Silverman, B. (2014). Allocation of resources in asymmetric competitions: How do the weak maintain a chance of winning? Journal of Economic Psychology, 42, 161-174.
Baye, M., & Hoppe, H. (2003). The strategic equivalence of rent-seeking, innovation and patent race games. Games and Economic Behavior, 44, 217-226.
Baye, M., Kovenock, D., & de-Vries, C.G. (1996). The all-pay auction with complete information. Economic Theory, 8, 291-305.
Baye, M., Kovenock, D., & de-Vries, C.G. (1999). The incidence of overdissipation in rent-seeking contests. Public Choice, 99, 439-454.
Bayus, B., & Mehta, R. (1995). A segmentation model for the targeted marketing of consumer durables. Journal of Marketing Research, 32, 463-469.
Borel, E. (1921). La theorie du jeu les equations integrales a noyau symetrique. Comptes Rendus del Academie. 173, 1304–1308; English translation by Savage, L. (1953). The theory of play and integral equations with skew symmetric kernels. Econometrica, 21, 97-100.
Budd, C., Harris, C., & Vickers, J. (1993). A model of the evolution of duopoly: does the asymmetry between firms tend to increase or decrease? Review of Economic Studies, 60, 543-573.
Cason, T.N., Sheremeta, R.M., & Zhang, J. (2012). Communication and efficiency in competitive coordination games. Games and Economic Behavior, 76, 26-43.
Cason, T.N., Sheremeta, R.M., & Zhang, J. (2016). Asymmetric and endogenous within-group communication in competitive coordination games. Working Paper.
Chen, C., Ong, D., & Sheremeta, R.M. (2015). The gender difference in the value of winning. Economics Letters, 137, 226-229.
Chowdhury, S.M., Kovenock, D., & Sheremeta, R.M. (2013). An experimental investigation of Colonel Blotto games. Economic Theory, 52, 833-861.
Chowdhury, S.M., Sheremeta, R.M., Turocy, T.L. (2014). Overbidding and overspreading in rent-seeking experiments: Cost structure and prize allocation rules. Games and Economic Behavior, 87, 224-238.
Dasgupta, P. (1986). The theory of technological competition. In: Stiglitz, J.E., Mathewson, G.F. (Eds.), New Developments in the Analysis of Market Structure. MIT Press, Cambridge, pp. 519–547.
27
Dechenaux, E., Kovenock, D., & Sheremeta, R.M. (2015). A Survey of experimental research on contests, All-pay auctions and tournaments. Experimental Economics, 18, 609-669.
Deck, C., & Sheremeta, R.M. (2012). Fight or flight? Defending against sequential attacks in the game of siege. Journal of Conflict Resolution, 56, 1069-1088.
Deck, C., Sarangi, S., & Wiser, M. (2016). An experimental investigation of simultaneous multi-battle contests with strategic complementarities. Journal of Economic Psychology, forthcoming.
Deck, C., & Sheremeta, R.M. (2016). Tug-of-war in the laboratory. Working Paper.
Duffy, J., & Matros, A. (2015). Stochastic asymmetric Blotto games: Some new results. Economics Letters, 134, 4-8.
Fischbacher, U. (2007). z-Tree: Zurich toolbox for ready-made economic experiments. Experimental Economics, 10, 171-178.
Fudenberg, D., Gilbert, R., Stiglitz, J., & Tirole, J. (1983). Preemption, leapfrogging and competition in patent races. European Economic Review, 22, 3-31.
Gelder, A. (2014). From custer to thermopylae: Last stand behavior in multi-stage contests. Games and Economic Behavior, 87, 442-466.
Gelder, A., & Kovenock, D. (2015). Dynamic behavior and player types in majoritarian multi-battle contests. ESI Working Paper.
Gelder, A., Kovenock, D., & Sheremeta, R.M. (2016). Behavior in all-pay auctions with ties. Working Paper.
Gneezy, U., & Smorodinsky, R. (2006). All-pay auctions – an experimental study. Journal of Economic Behavior and Organization, 61, 255-275.
Harris, C., & Vickers, J. (1985). Perfect equilibrium in a model of a race. Review of Economic Studies, 52, 193-209.
Harris, C., & Vickers, J. (1987). Racing with uncertainty. Review of Economic Studies, 54, 1-21. Hart, S. (2008). Discrete Colonel Blotto and general Lotto games. International Journal of Game
Theory, 36, 441-460.
Hausken, K. (2008). Whether to attack a terrorist’s resource stock today or tomorrow. Games and
Economic Behavior, 64, 548-564.
Hillman, A., & Riley, J.G. (1989). Politically contestable rents and transfers. Economics and Politics, 1, 17-40.
Holt, C., Kydd, A., Razzolini, L., & Sheremeta, R.M. (2016). The paradox of misaligned profiling: Theory and experimental evidence. Journal of Conflict Resolution, 60, 482-500.
Holt, C.A., & Laury, S.K. (2002). Risk aversion and incentive effects. American Economic Review, 92, 1644-1655.
Hortala-Vallve, R. & Llorente-Saguer, A. (2010). A simple mechanism for resolving conflict. Games and Economic Behavior, 70, 375-391.
Irfanoglu, Z.B., Mago, S.D., & Sheremeta, R.M. (2015). The New Hampshire effect: Behavior in sequential and simultaneous election contests. Working Paper.
Klumpp, T., & Polborn, M.K. (2006). Primaries and the New Hampshire effect. Journal of Public Economics, 90, 1073-1114.
Konrad, K.A., & Kovenock, D. (2009). Multi-battle contests. Games and Economic Behavior, 66, 256-274.
28
Kovenock, D., & Roberson, B. (2015). The optimal defense of network connectivity. Working Paper.
Kovenock, D., Roberson, B., & Sheremeta, R.M. (2016). The attack and defense of weakest-link networks. Working Paper.
Kvasov, D. (2007). Contests with limited resources. Journal of Economic Theory, 136, 738-748. Laslier, J.F. (2002). How two-party competition treats minorities. Review of Economic Design, 7,
297-307.
Lee, T. and Wilde, L. (1980). Market structure and innovation: A reformulation. Quarterly Journal of Economics, 94, 429-436.
Leininger, W. (1991). Patent competition, rent dissipation, and the persistence of monopoly: the role of research budgets. Journal of Economic Theory, 53, 146-172.
Levitin, G., & Hausken, K. (2010). Resource distribution in multiple attacks against a single target. Risk Analysis, 30, 1231-1239.
Llorente-Saguer, A., Sheremeta, R.M., & Szech, N. (2016). Designing contests between heterogeneous contestants: An experimental study of tie-breaks and bid-caps in all-pay auctions. Working Paper.
Loury, G. (1979). Market structure and innovation. Quarterly Journal of Economics, 93, 395-410. Lugovskyy, V., Puzzello, D., & Tucker, S. (2010). An experimental investigation of
overdissipation in the all pay auction. European Economic Review, 54, 974-997.
Mago, S.D., Samek, A., & Sheremeta, R.M. (2016). Facing your opponents: Social Identification and Information Feedback in Contests. Journal of Conflict Resolution, 60, 459-481.
Mago, S.D., Sheremeta, R.M., & Yates, A. (2013). Best-of-three contest experiments: Strategic versus psychological momentum. International Journal of Industrial Organization, 31, 287-296.
McKelvey, R., & Palfrey, T. (1995), Quantal response equilibria for normal form games. Games and Economic Behavior, 10, 6-38.
Milgrom, P. (2007). Package auctions and exchanges. Econometrica, 75, 935-965.
Montero, M., Possajennikov, A., Sefton, M., & Turocy, T.L. (2016). Majoritarian Blotto contests with asymmetric battlefields: An experiment on Apex games. Economic Theory, 61, 55-89. Myerson, R.B. (1993). Effectiveness of electoral systems for reducing government corruption: A
game-theoretic analysis. Games and Economic Behavior, 5, 118-132.
Parco J., Rapoport A., & Amaldoss W. (2005). Two-stage contests with budget constraints: An experimental study. Journal of Mathematical Psychology, 49, 320-338.
Potters, J., de Vries, C.G., & Van Winder, F. (1998). An experimental examination of rational rent-seeking. European Journal of Political Economy, 14, 783-800.
Price, C.R., & Sheremeta, R.M. (2011). Endowment effects in contests. Economics Letters, 111, 217–219.
Price, C.R., & Sheremeta, R.M. (2015). Endowment origin, demographic effects and individual preferences in contests. Journal of Economics and Management Strategy, 24, 597-619.
Roberson, B. (2006). The Colonel Blotto game. Economic Theory, 29, 1-24.
Roberson, B. (2008). Pork-barrel politics, targetable policies, and fiscal federalism. Journal of the European Economic Association, 6, 819-844.
Roberson, B., & Kvasov, D. (2012). The non-constant-sum Colonel Blotto game. Economic Theory, 51, 397-433.
29
Sheremeta, R.M. (2010a). Expenditures and information disclosure in two-stage political contests. Journal of Conflict Resolution, 54, 771-798.
Sheremeta, R.M. (2010b). Experimental comparison of multi-stage and one-stage contests. Games and Economic Behavior, 68, 731-747.
Sheremeta, R.M. (2011). Contest design: An experimental investigation. Economic Inquiry, 49, 573-590.
Sheremeta, R.M. (2013). Overbidding and heterogeneous behavior in contest experiments. Journal of Economic Surveys, 27, 491-514.
Sheremeta, R.M. (2015). Behavioral dimensions of contests. In Congleton, R.D., Hillman, A.L., (Eds.), Companion to the Political Economy of Rent Seeking, London: Edward Elgar, pp. 150-164.
Sheremeta, R.M. (2016). Impulsive behavior in competition: Testing theories of overbidding in rent-seeking contests. Working Paper.
Shupp, R., Sheremeta, R.M., Schmidt, D., & Walker, J. (2013). Resource allocation contests: Experimental evidence. Journal of Economic Psychology, 39, 257-267.
Snyder, J.M. (1989). Election goals and the allocation of campaign resources. Econometrica, 57, 637-660.
Szentes, B., & Rosenthal, R.W. (2003). Beyond chopsticks: Symmetric equilibria in majority auction games. Games and Economic Behavior, 45, 278-295.
Szymanski, S. (2003). The economic design of sporting contests. Journal of Economic Literature, 41, 1137-1187.
Tullock, G. (1980). Efficient rent seeking. In James M. Buchanan, Robert D. Tollison, Gordon Tullock, (Eds.), Toward a theory of the rent-seeking society. College Station, TX: Texas A&M University Press, 97-112.
30
Table 1: Equilibrium predictions and actual behavior
Treatments Sequential Simultaneous
Prize, v 100 100
Number of battles, n 3 3
Equilibrium Actual Equilibrium Actual
Expected bid in battle 1 50.0 16.7 (0.5) 16.7 24.4 (0.6)
Expected bid in battle 2 by battle 1 winner 0.1 34.0 (1.0) 16.7 22.8 (0.6) Expected bid in battle 2 by battle 1 loser 0.0 24.7 (1.0) - -
Expected bid in battle 3 50.0 35.7 (1.0) 16.7 21.9 (0.6)
The probability of ending in battle 2 1.0 0.62 (0.02) - -
Expected average total bid 50.0 59.6 (1.3) 50.0 69.2 (0.9)
Expected payoff 0.0 -9.6 (1.8) 0.0 -19.15 (1.7)
31
[image:32.612.184.430.311.486.2]Figure 1: Bids in each battle across all periods in the simultaneous treatment
Figure 2: Bids in each battle across all periods in the sequential treatment
[image:32.612.191.430.544.698.2]32
Figure 4: Distribution of bids in the simultaneous treatment
[image:33.612.166.449.317.679.2]33
Appendix (For Online Publication) – Instructions for Sequential Treatment
GENERAL INSTRUCTIONS
This is an experiment in the economics of strategic decision making. Various research agencies have provided funds for this research. The instructions are simple. If you follow them closely and make appropriate decisions, you can earn an appreciable amount of money.
The experiment will proceed in two parts. Each part contains decision problems that require you to make a series of economic choices which determine your total earnings. The currency used in Part 1 of the experiment is U.S. Dollars. The currency used in Part 2 of the experiment is francs. These francs will be converted to U.S. Dollars at a rate of _25_ francs to _1_ dollar. You have already received a $20.00 participation fee (this includes your show-up fee of $7.00). Your earnings from both Part 1 and Part 2 of the experiment will be incorporated into your participation fee. At the end of today’s experiment, you will be paid in private and in cash. There are 12participants in today’s
experiment.
It is very important that you remain silent and do not look at other people’s work. If you have any questions, or need assistance of any kind, please raise your hand and an experimenter will come to you. If you talk, laugh, exclaim out loud, etc., you will be asked to leave and you will not be paid. We expect and appreciate your cooperation.
INSTRUCTIONS FOR PART 1
In this part of the experiment you will be asked to make a series of choices in decision problems. How much you receive will depend partly on chance and partly on the choices you make. The decision problems are not designed to test you. What we want to know is what choices you would make in them. The only right answer is what you really would choose.
For each line in the table in the next page, please state whether you prefer option A or option B. Notice that there are a total of 15 lines in the table but only one line will be randomly selected for payment. Each line is equally likely to be selected, and you do not know which line will be selected when you make your choices. Hence you should pay attention to the choice you make in every line. After you have completed all your choices a token will be randomly drawn out of a bingo cage containing tokens numbered from 1 to 15. The token number determines which line is going to be selected for payment.
Your earnings for the selected line depend on which option you chose: If you chose option A in that line, you will receive $1. If you chose option B in that line, you will receive either $3 or $0. To determine your earnings in the case you chose option B there will be second random draw. A token will be randomly drawn out of the bingo cage now containing twenty tokens numbered from 1 to 20. The token number is then compared with the numbers in the line selected (see the table). If the token number shows up in the left column you earn $3. If the token number shows up in the right column you earn $0.
While you have all the information in the table, we ask you that you input all your 15 decisions into the computer. The actual earnings for this part will be determined at the end of part 2, and will be independent of part 2 earnings. Decis ion no. Opt ion A Option B Please choose A or B 1 $1 $3 never $0 if 1,2,3,4,5,6,7,8,9,10,11,12,13,14,15,16,17,18,19,20
2 $1 $3 if 1 comes out of the bingo cage $0 if 2,3,4,5,6,7,8,9,10,11,12,13,14,15,16,17,18,19,20 3 $1 $3 if 1 or 2 $0 if 3,4,5,6,7,8,9,10,11,12,13,14,15,16,17,18,19,20 4 $1 $3 if 1,2,3 $0 if 4,5,6,7,8,9,10,11,12,13,14,15,16,17,18,19,20 5 $1 $3 if 1,2,3,4, $0 if 5,6,7,8,9,10,11,12,13,14,15,16,17,18,19,20 6 $1 $3 if 1,2,3,4,5 $0 if 6,7,8,9,10,11,12,13,14,15,16,17,18,19,20 7 $1 $3 if 1,2,3,4,5,6 $0 if 7,8,9,10,11,12,13,14,15,16,17,18,19,20 8 $1 $3 if 1,2,3,4,5,6,7 $0 if 8,9,10,11,12,13,14,15,16,17,18,19,20 9 $1 $3 if 1,2,3,4,5,6,7,8 $0 if 9,10,11,12,13,14,15,16,17,18,19,20 10 $1 $3 if 1,2,3,4,5,6,7,8,9 $0 if 10,11,12,13,14,15,16,17,18,19,20 11 $1 $3 if 1,2, 3,4,5,6,7,8,9,10 $0 if 11,12,13,14,15,16,17,18,19,20 12 $1 $3 if 1,2, 3,4,5,6,7,8,9,10,11 $0 if 12,13,14,15,16,17,18,19,20 13 $1 $3 if 1,2, 3,4,5,6,7,8,9,10,11,12 $0 if 13,14,15,16,17,18,19,20 14 $1 $3 if 1,2, 3,4,5,6,7,8,9,10,11,12,13 $0 if 14,15,16,17,18,19,20 15 $1 $3 if 1,2, 3,4,5,6,7,8,9,10,11,12,13,14 $0 if 15,16,17,18,19,20
34
YOUR DECISION
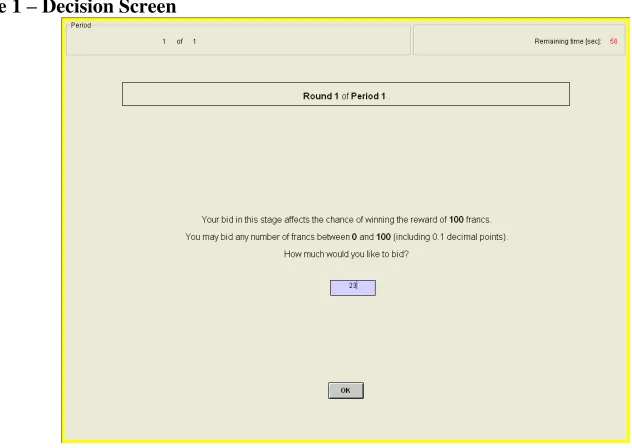
The second part of the experiment consists of 20 decision-making periods. The 12 participants in today’s experiment will be randomly re-matched every period into 6 groups with 2 participants in each group. Therefore, the specific person who is the other participant in your group will change randomly after each period. The group assignment is anonymous, so you will not be told which of the participants in this room are assigned to your group
[image:35.612.133.449.213.437.2]Each period consists of a maximum of three rounds. The period ends when one of the participants wins two of the three rounds ("best of three"). Thus, each period will consist of either two or three rounds. In each round, you and the other participant in your group will simultaneously make a bid (any number, including 0.1 decimal points). Your bid in each round cannot exceed 100 francs. The more you bid, the more likely you are to win a particular round. This will be explained in more detail later. The participant who is first to win two rounds receives the reward of 100 francs. Your total earnings depend on whether you receive the reward or not and how many francs you spent on bidding. An example of your decision screen is shown below in Figure 1:
Figure 1 – Decision Screen
CHANCE OF WINNING A ROUND
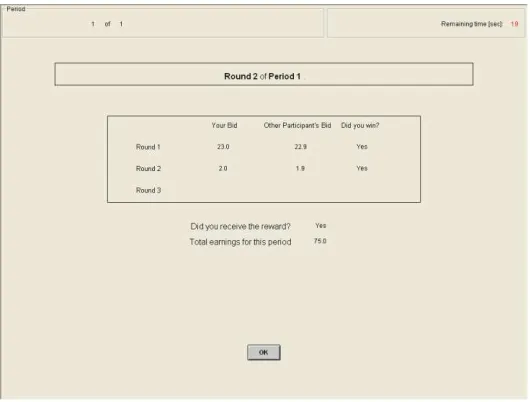
If you bid more than the other participant in a particular round you win that round with certainty. So, if you bid 30 francs in a particular round while the other participant bids 29.9 francs in the same round then the computer will chose you as the winner of that round. In case both participants bid the same amount in the same round, the computer determines randomly who wins that round. In case both participants bid zero, the computer determines randomly who wins the round.
YOUR EARNINGS
Your earnings depend on whether you receive the reward or not and how many francs you spent on bidding. The participant who is first to win two rounds receives the reward of 100 francs. Regardless of who receives the reward, both participants will have to pay their bids in each round. Thus, the period earnings will be calculated in the following way:
(1) If the period lasted for only two rounds
Earnings of the participant who won both rounds are = = 100 - (bid in round 1) - (bid in round 2) Earnings of the participant who won neither rounds are =
= 0 - (bid in round 1) - (bid in round 2) (2) If the period lasted for three rounds
Earnings of the participant who won two rounds are =
= 100 - (bid in round 1) - (bid in round 2) - (bid in round 3) Earnings of the participant who won one round are =
= 0 - (bid in round 1) - (bid in round 2) - (bid in round 3)