High-Cycle Fatigue Behavior of Type 316L Stainless Steel
Jiunn-Yuan Huang
*, Ji-Jung Yeh, Sheng-Long Jeng,
Charn-Ying Chen and Roang-Ching Kuo
Institute of Nuclear Energy Research (INER), P. O. Box 3-14, 1000 Wenhua Road, Chiaan Village, Lungtan, Taiwan 325, R. O. China.
High-cycle fatigue tests were conducted to investigate the effects of temperature, stress ratio (R), specimen orientation, welding and specimen size on the fatigue behavior of type 316L stainless steel. The high-cycle fatigue test results indicated that the fatigue limits significantly decreased when the stress ratio (R) decreased. The corresponding fatigue limits were reduced to lower values when tests were conducted at 300C, compared to those obtained at room temperature. The fatigue behavior and fatigue limits of standard and subsize specimens were
observed to be consistent at both room temperature and 300C. The constant life diagram was established from the S–N curves acquired. The
fatigue limit strongly depended on the materials strength, which was a function of specimen orientation, test temperature, and welding processes. The dimension of the fatigue damaged area on a fracture surface increased as the stress ratio decreased. In the case ofR¼ 1:0, the fatigue damaged region extended over the whole fracture surface. The subgrain boundaries after high-cycle fatigue tests were clearly demonstrated by their diffraction patterns, which were related to the dynamic recovery of multiple dislocations.
(Received September 27, 2005; Accepted December 9, 2005; Published February 15, 2006)
Keywords: high-cycle fatigue, stress ratio, subsize, constant life diagram, subgrain boundary
1. Introduction
Type 316L stainless steel is one of the important structural materials used for the in-core components and pressure boundaries of light water reactors (LWR). Ensuring structure integrity of these components is crucial to the operational safety of nuclear power plants. Welds are made in reactor internal systems to provide the advantages of a continuous metal joint. It has been reported that failures usually occur at the degradation of a component or components to which the weld is affixed.1) The largest number of weld failures is
attributed to either the high-cycle fatigue caused by flow-induced vibration or due to fatigue in general. In addition to stress corrosion cracking and radiation damage, fatigue is one of the dominant mechanisms responsible for the degradation of pressure boundaries and many in-core components.2–5)The
fatigue damage is induced by cyclic variations of pressure (stress), temperature and flow induced vibration, thereby reducing the lifetime of structures and components.6–8) In order to understand the effects of stress ratio and environment temperature on the high-cycle fatigue behavior of type 316L stainless steel and its weld, the fatigue limits and the fracture modes were investigated at room temperature and 300C. The subsize specimen9–11) was also studied in this work.
Comparisons were made between the data generated from subsize and standard specimens to examine the effect of specimen size on the fatigue behavior.
Scanning electron microscopy (SEM) and transmission electron microscopy (TEM) were used to study the micro-structural evolution of SS316L steel and to characterize their fatigue resistant behavior.
2. Experimental Procedures
2.1 Materials
The chemical compositions and mechanical properties of
type 316L stainless steel were given in Tables 1 and 2. A solution of 10 vol% oxalic acid was used as the electrolytic etching solution.
2.2 Welding procedures
The weld specimen design, comprising two beveled test plates with a V groove of 75, a root opening gap of 2.0 mm and root face of 1.6 mm, is shown in Fig. 1. Welding was performed by a manual GTAW (Gas Tungsten Arc Welding) butt weld using filler metal ER316L with a diameter 1.6 mm for the first two passes and 3.2 mm for the subsequent ones. Twelve weld passes were performed in four layers. The weld current was set at 60 amperes for the first two passes and then raised up to 80–90 amperes for the rest passes.
2.3 High-cycle fatigue test
Standard and subsize fatigue specimens of plate type were designed to the specifications of ASTM E 466,12)as shown in
Fig. 2. The dimensions of a subsize specimen, thickness of 2.6 mm and gage length of 10.4 mm, were in the lower limit of the specifications. The overall length of a standard specimen was 190 mm and that of the subsize 67 mm. Before fatigue testing, all specimens were polished as per the recommendations of ASTM E 466. High-cycle fatigue tests, at room temperature and 300C, were performed on a 100 KN
MTS 810 close-loop servohydraulic machine under a sinus-oidal load control, at stress ratios (R¼min=max) of 0.8, 0.2,
0:2and1:0, and at a frequency of 20 Hz. For the tests at 300C, specimens were heated to 300C and then maintained
for 2 h to homogenize the temperature distribution. The standard specimens were loaded in the rolling direction, and the subsize specimens either in a direction parallel or transverse to the rolling direction. Fatigue tests were stopped when specimens broke or the fatigue cycles reached 107
cycles.
2.4 Scanning electron microscopic (SEM) examination
The fracture surfaces were examined by scanning electron
*Corresponding author, E-mail: jyhuang@iner.gov.tw
microscopy to characterize the fracture mode, crack initiation site and the evolution of the fatigue striation structure.
2.5 Transmission electron microscopic (TEM)
exami-nation
To examine the fatigue effects on the evolution of the dislocation structure on the surface and bulk of fatigue-tested
specimens, TEM samples were cut from different locations along the as-received and fatigued specimens with their sample surfaces normal and parallel to the loading axis, respectively. In order to prevent the final plastic deformation from complicating the fatigue structure, the sampling position should be kept away from the necking region, but as close to the final fracture site as possible. TEM samples were polished with fine emery paper to a thickness of 0.1 mm, then chemically thinned with a double-jet polishing machine in 10 vol% perchloric acid (HClO4) and 90 vol% methanol
(CH3OH) at 30C. The current was approximately
con-trolled at 0.1 A and voltage at 10 V. The transmission electron microscope used in this study is a JOEL 2000FX.
3. Results and Discussion
3.1 Metallographic features of the as-received and
welded specimens
[image:2.595.49.555.85.128.2]There was no clear disparity in microstructural features
Table 1 Chemical compositions of type 316L stainless steel.
Designation Composition (mass%)
C Si Mn P S Ni Mo Cr Fe
[image:2.595.57.354.140.665.2]wt% 0.02 0.3 1.46 <0:03 <0:02 12.3 2.28 17.10 Bal.
Table 2 Tensile properties of type 316L stainless steel.
Designation Temperature (C)
Ultimate tensile strength,
UTS(MPa)
Yield strength 0.2% offset
YS(MPa)
Total elongation (%)
Uniform elongation
(%)
As-received 25 526 245 65 50
(Rolling) 300 405 150 53 32
As-received 25 544 245 63 48
(Transverse) 300 432 145 39 33
Weld 25 538 306 30 23
300 441 288 25 15.7
Fig. 1 A sketch of weld specimen design.
Designations T (mm)
W1
(mm) L1
(mm) W2
(mm) L2
(mm) L3
(mm) R (mm)T
W1
1 1
W L
1 W
R Reduced
cross section area (T×W1)
Large (Standard specimen)
5 10 30 30 40 190 85 2 3 3 8.5 50 mm2
Subsize
specimen 2.6 5.2 10.4 10.4 14 67 41.6 2 2 2 8 13.52 mm
2
ASTM E466 specifications
2.54 (as possible
as)
2 6
2 3 1.5 8
19.4 mm2
645 mm2
(preferable) L1
W1 W2
L2
R
L3 T
Rolling Direction
1 2
W W
Fig. 2 Dimensions of standard and subsize high-cycle fatigue specimens as per ASTM E 466 specifications.
Rolling direction
[image:2.595.52.288.169.465.2] [image:2.595.327.526.216.513.2]observed along the rolling, transverse and short transverse direction, as demonstrated in the optical micrographs of Fig. 3. Flow lines induced by hot rolling were observed to be along the rolling direction. Given in Fig. 4 is an example of the optical micrograph of a weld specimen. Dendritic structures were observed and prevalent in the weld. In general, dendrites grew in the direction parallel to the heat transfer direction. So dendrites were observed to lie in a direction vertical to the interface between the weld and base metal, as shown in Fig. 4. The heat-affected zone is not distinguishable. Based on the Vickers micro-hardness meas-urements, the melted zone is harder than the base metal, as illustrated in Fig. 5. And further the hardness values of the weld root are relatively higher than those for the weld cap.
3.2 High-cycle fatigue test
The fatigue limits for type 316L stainless steel subjected to high-cycle fatigue tests were summarized in Table 3. The
fatigue limits were mainly a function of stress ratio and test temperature. The fatigue limits were observed to increase with increasing the stress ratio. When the stress ratio was set at1:0, the fatigue limit decreased to a minimum value. On the other hand, the corresponding fatigue limits at 300C
[image:3.595.61.278.73.164.2]were lower than those tested at room temperature. An important finding was that the fatigue limits for the subsize specimens were consistent with those for the standard specimens at both room temperature and 300C.
Figure 6 shows the S–N curves for standard specimens tested under different stress ratios at room temperature and 300C. In this figure, there were 4 sets of S–N curves generated for each test temperature. The corresponding stress ratios were at 0.8, 0.2,0:2, and1:0, respectively. Each S– N curve is comprised of a slanting line and a horizontal line, which depicts the relationship between the fatigue life,
log(N), and maximum stress, Smax, as also given in Fig. 6.
The horizontal line is the level of the fatigue limit. From the figure, it can be seen the fatigue limit for R¼0:8 was the largest, and the one for R¼ 1:0 was the smallest irrespective of the test temperature. The results indicated the cyclic actions of tension and compression inflicted the severest fatigue damage. On the other hand, the cyclic actions of tension and tension exerted a smaller stress amplitude, so the fatigue damage was moderate. At 300C, the fatigue life
was relatively shorter and the fatigue limit lower. From the figure, it can be seen that the fatigue limit at a specific temperature was completely determined by theRvalue, but that the fatigue life was determined by bothRandSmax. The
high test temperature (300C) was detrimental to the
high-cycle fatigue properties of type 316L stainless steel. Comparing the S–N results for the subsize specimens with those for the standard specimens indicates that both
speci-Weld
Base metal
Base metal
Fig. 4 Optical micrograph of the type 316L stainless steel weld specimen.
-12.00 -8.00 -4.00 0.00 4.00 8.00 12.00
Distance along the center of weld, d/ mm 100.00
150.00 200.00 250.00 300.00
Hardness (Hv, 300g)
Weld
Weld Weld root
Weld cap
316HV
cap
root
[image:3.595.313.543.74.223.2]Fig. 5 Micro-hardness measurement along the weld root and weld cap.
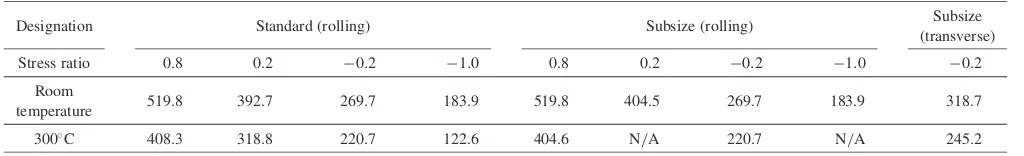
Table 3 The fatigue limits for type 316L stainless steel subjected to high-cycle fatigue tests.
Designation Standard (rolling) Subsize (rolling) Subsize
(transverse)
Stress ratio 0.8 0.2 0:2 1:0 0.8 0.2 0:2 1:0 0:2
Room
temperature 519.8 392.7 269.7 183.9 519.8 404.5 269.7 183.9 318.7
300C 408.3 318.8 220.7 122.6 404.6 N/A 220.7 N/A 245.2
The unit for fatigue limit (the maximum stress for N=107cycles): MPa
1.0E+0 1.0E+1 1.0E+2 1.0E+3 1.0E+4 1.0E+5 1.0E+6 1.0E+7 1.0E+8
Fatigue Life, N /Cycles
100 200 300 400 500 600
Maximum Stress, S
max
/MPa
SN316OT.grf
R=0.8
R= 0.2
R= -0.2
R= -1.0
Standard Specimen
Soild symbol at room Temperature Open symbol at 300°C
run-out run-out run-out
run-out
run-out
run-out
run-out run-out
run-out
run-out run-out
run-out run-out
run-out
R=0.8
R= 0.2
R= -1.0 R= -0.2
run-out
run-out
[image:3.595.62.276.214.407.2] [image:3.595.45.557.699.777.2]mens have similar S–N curves and the same fatigue limits. An example is given in Figs. 7(a) and (b) to compare the S–N curves for standard and subsize specimens tested at room temperature and 300C, respectively. It can be concluded that
the high-cycle fatigue properties of standard and subsize specimens were equivalent at either test temperature. There-fore, the subsize specimen could be employed as a substitute to the standard specimen. The S–N curves obtained and their corresponding fatigue life equations provide a database for evaluating the high-cycle fatigue properties of type 316L stainless steel components.
The constant life diagrams for high-cycle fatigue tests at room temperature and 300C, as shown in Figs. 8(a) and (b), were derived from Figs. 6 and 7. There are 2 sets of
(a)
R=+1 (Tensile Test)
R=-1 (Complete Reve
rsal) R=+0.8 R=+0.2 R=-0.2 N=10 5cycles N=5x10 5cycles N=10
7cycles (Fatigue Lim it)
0 50 100 150 200 250 300 350 400 450 500 550 600 -50 -100 -150 -200 -250 -300 -350 -400 50 100 150 200 250 300 350 400 450 500 550 600 0 (-183.9,183.9) (-202.1,202.1) (-219.0,219.0) (-58.8,294.1) (-72.8,364.0) (-53.9,269.7) (83.1,415.7) (78.5,392.7) (99.5,497.3) (415.8,519.8) (421.7,527.1) (424.4,530.6) 50 100 150 200 250 300 350 400 450 500 550 50 100 150 200 250 300 350 S
a , MPa
Sm , MPa
Minimum Stress, Smin /MPa
Maximum Stress, S
m
ax
/MPa
R=0
Yield Point
316L stainless steel, ASTM E-466 standard, axial load tests, test performed in air at room temperature, frequency = 20 Hz SU =526MPa, SY =245MPa, (with fan cooling in the case of R = -1.0, N=105 cycles)
45°
(b)
R=+1 (Tensile Test)
R=-1 (Complete Re
versal)
R=+0.8 R=+0.2
R=-0.2
N=10
7cycles (Fatigue Lim
it)
N=5X10
5cycles
0 50 100 150 200 250 300 350 400 450 500 550 600 -50 -100 -150 -200 -250 -300 -350 -400 0 50 100 150 200 250 300 350 400 450 550 500 600 (-138.8,138.8) (-122.6,122.6) (-46.7,233.7) (-44.1,220.7) (71.5,357.4) (63.8,318.8) (326.6,408.3) (327.2,409.0) 50 100 150 200 250 300 350 400 450 500 550 50 100 150 200 250 300 350
Sm , MPa
Sa , MPa
Minimum Stress , Smin /MPa
Maximum Stress , S
m
ax
/MPa
R=0
316L stainless steel, ASTM E-466 standard, axial load tests, test performed in air at 300°C, frequency = 20 Hz
45° (-150.4,150.4) (-57.7,288.5) (78.2,391.2) (327.5,409.3) N=10 5cycles
Fig. 8 Constant life diagrams for subsize specimens of type 316L stainless steel subjected to high-cycle fatigue tests at (a) room temperature, and (b) 300C.
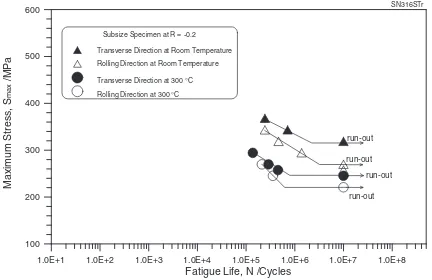
1.0E+1 1.0E+2 1.0E+3 1.0E+4 1.0E+5 1.0E+6 1.0E+7 1.0E+8 Fatigue Life, N /Cycles
100 200 300 400 500 600
Maximum Stress, S
max /MPa SN316STr run-out run-out run-out run-out
Subsize Specimen at R = -0.2 Transverse Direction at Room Temperature Rolling Direction at Room Temperature Transverse Direction at 300 °C Rolling Direction at 300 °C
Fig. 9 S–N curves for SS316L subsize specimens with different orienta-tions at room temperature and 300C.
(a)
1.0E+1 1.0E+2 1.0E+3 1.0E+4 1.0E+5 1.0E+6 1.0E+7 1.0E+8 Fatigue Life, N/Cycles
100 200 300 400 500 600
Maximum Stress, S
max /MPa SN316SS.grf R=0.8 R=0.2 R=-0.2 R=-1 run-out run-out run-out run-out run-out run-out run-out run-out run-out run-out run-out run-out
log(N)=110.644177-0.199111 (Smax)
log(N)=9.25577876-0.008557 (Smax)
log(N)=8.641271-0.010003 (Smax)
log(N)=14.092104-0.041524 (Smax)
At room temperature Solid symbol : standard specimen Open symbol : subsize specimen
(b)
1.0E+0 1.0E+1 1.0E+2 1.0E+3 1.0E+4 1.0E+5 1.0E+6 1.0E+7 1.0E+8 Fatigue Life, N/Cycles
100 200 300 400 500
Maximum Stress, S
max /MPa SN316OST R= 0.8 R= 0.2 R= -0.2 R= -1.0
At 300°C
Soild symbol: standard specimen Open symbol: subsize specimen
run-out
run-out
run-out
log(N)=800.916667-1.944444 (Smax)
log(N)=13.084738-0.020667 (Smax)
log(N)=8.678040-0.012747 (Smax)
log(N)=14.055435-0.060210 (Smax)
run-out
run-out
Fig. 7 S–N curves for standard and subsize SS316L specimens with different stress ratios at (a) room temperature and (b) 300C.
(a)
1.0E+1 1.0E+2 1.0E+3 1.0E+4 1.0E+5 1.0E+6 1.0E+7 1.0E+8 Fatigue Life, N/Cycles
100 200 300 400 500 600
Maximum Stress, S
max
/MPa
SN316w1
R=0.2
run-out
log(N)=8.096182-0.05717 (Smax)
log(N)=15.231225-0.029238 (Smax) R= 0.2
run-out run-out
run-out
Weld at R = 0.2 Weld at R = -0.2 Base Metal at R = 0.2 Base Metal at R = -0.2
run-out
run-out
(b)
1.0E+1 1.0E+2 1.0E+3 1.0E+4 1.0E+5 1.0E+6 1.0E+7 1.0E+8 Fatigue Life, N/Cycles
100 200 300 400 500 600
Maximum Stress, S
max
/MPa
SN316wt1
run-out
log(N)=13.868428-0.022320 (Smax)
log(N)=10.818176-0.018989 (Smax)
run-out run-out
run-out
log(N)=8.678040-0.012747 (Smax) log(N)=13.084738-0.020667 (Smax) Base Metal R= 0.2
Welded R= 0.2 Base Metal R=0.2 Welded R=0.2 Weld at R = 0.2
[image:4.595.61.278.68.365.2]Weld at R = -0.2 Base Meatl at R = 0.2 Base Metal at R= -0.2
[image:4.595.319.535.73.213.2] [image:4.595.318.534.272.567.2] [image:4.595.56.283.436.749.2]coordinates in each constant life diagram. The basic coordinates are the maximum applied stress (Smax) and
minimum applied stress (Smin). The coordinates inclined at an
angle of 45 are the stress amplitude (Sa) and mean stress
(Sm). Mean stress effect could be obtained from the constant
life diagram. The stress amplitude drops sharply when mean stress is greater than 200 MPa. Any points with a combination ofSmax,Smin,SaandSmbelow a certain constant fatigue life
curve, no high-cycle fatigue failure is expected to occur before the predicted life. Thus the established constant life diagrams can serve as a guide for safe operation and design of relevant in-core components, so as to prevent the unexpected failure due to the high-cycle fatigue.
Transverse subsize specimens, with the loading axis perpendicular to the rolling direction, were also tested. A comparison of the results, as illustrated in Fig. 9, shows the transverse specimens exhibit slightly higher fatigue limits than those specimens loaded in a direction parallel to the rolling direction.
The welded specimens using the ER316L as filler were tested under high-cycle fatigue loading conditions at room
temperature and 300C. As shown in Figs. 10(a) and (b), the
welded specimens exhibit slightly higher fatigue limits than those of base metal specimens. It can be concluded that the fatigue limit strongly depends on the materials strength, as shown in Figs. 6, 9, 10 and Table 2. The higher the materials strength, the higher the fatigue limit was observed.
3.3 Fractographic features of high-cycle fatigued
speci-mens
The fatigue damaged region gradually expanded when the maximum applied stress (Smax) was successively decreased
under theRvalue of 0.2, as illustrated in Fig. 11. It could be that the ligament area could sustain the lower maximum applied stress during the fatigue crack propagation. Thus a fatigue specimen under a lower applied maximum stress led to a larger fatigue damage region and smaller final rupture plastic region. The effect of stress ratio on the fracture features is exemplified in Fig. 12. The more negative stress ratio could yield a larger fatigue damaged region. In the case ofR¼ 1:0, the fatigue damaged region extended over the whole fracture surface. The specimen was fractured mainly
Smax= 490 MPa
(a)
Smax= 441 MPa
(b)
Smax= 404 MPa
(c)
Fatigue damaged region Fatigue
damaged region
[image:5.595.128.470.72.250.2]Fatigue damaged region
Fig. 11 SEM micrographs showing the fatigue damaged region gradually expanded when the maximum applied stress (Smax) was successively decreased at theRvalue of 0.2.
(a) R= - 0.2 (b) R= - 1.0
Ductile rupture region
Fatigue damage region
Crack initiation
[image:5.595.127.470.304.478.2]by a fatigue rupture mode. The fatigue striations were the prevalent features. In the case of R¼ 0:2, part of the fracture surface was featured by ductile rupture. The speci-mens appeared to have a smaller plastic region when tested at
R¼ 0:2, relative to those at R¼0:2, Figs. 12(a) and 11. This finding is in good agreement with the above-mentioned conclusion that the lower applied maximum stress leads to a larger fatigue damage region and smaller plastic region.
The fatigue crack initiated from the specimen surface. As is often the case with the high-cycle fatigued specimens, a main initiation site was observed to be responsible for fatigue rupture. But in some cases, as demonstrated in Fig. 13, there were more than one initiation sites observed. The multiple initiation sites were observed with the severe fatigue condition ofR 0:2. The reason could be that the lower applied maximum stress yield a larger fatigue damage region, which could induce more crack initiation sites. In other words, the higher applied maximum stress would result in final rupture as soon as the fatigue initiation is formed.
The spacing between fatigue striations was strongly dependent on the value of R, as demonstrated in Fig. 14. The more negative the stress ratio, the wider the spacing between the fatigue striations. That could be accounted for by the observation that the larger stress range led to the higher crack growth rate. So the striation spacing at the equivalent crack length was observed to be larger for the more negative stress ratios.
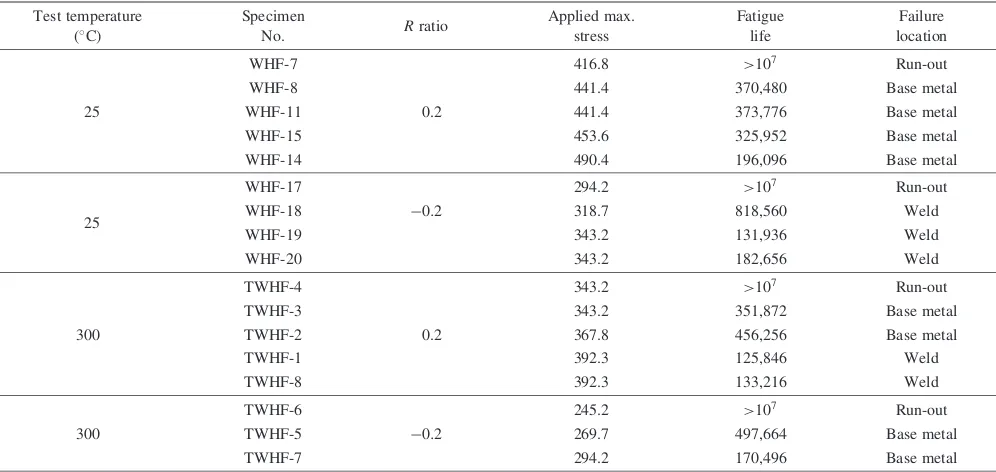
Most of the type 316L stainless steel specimens subjected to high-cycle fatigue failed at the base metal, some at the weld, illustrated in Table 4. That could be attributed to the material strength of the weld greater than that of base metal. But some failure occurred at the weld, which could be due to the micro-defect in the weld. These micro-defects were beyond the detection limit of X-ray inspection. Figure 15(a) shows the micro-defect observed at the fatigue initiation site. The striations were the prevalent features for the weld fracture surface, as shown in Fig. 15(b). No dendritic structures were observed at the weld because the dendrite orientation was roughly perpendicular to the fracture surface. Itow reported that interdendritic cracking morphology could be observed on the fracture surface of compact tension
[image:6.595.126.467.76.257.2]5
Fig. 13 Multiple initiation sites observed atR¼ 0:2.
(a)
(b)
[image:6.595.347.505.304.757.2]specimen when the crack propagates parallel to the alloy 182 weld dendrite direction.13)
3.4 Dislocation structure of high-cycle fatigued
speci-mens
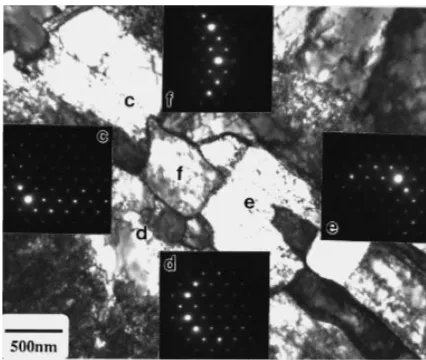
A number of researchers14–20) have observed a strong dependence of dislocation structures on fatigue behavior. Figure 16 shows the typical TEM images of surface and cross sectional layers from the as-received and fatigued specimens. As a consequence of work-hardening by plate rolling, the dislocation density of the surface is much higher than that of the bulk, as shown in Figs. 16(a) and (b). In the cross sectional layer, planar defects [see Fig. 16(b)] exhibiting fringe contrast are generally described as stacking faults or microtwins due to their similar contrast. Microtwins, which are closely structurally related to stacking faults, has been fully discussed by Chen and Stobbs.21)Such thin twins were
observed to be distorted and associated with dislocations after fatigue tests, as shown in Figs. 16(d) (f). It was also noted that in the surface layers of the fatigue-tested speci-mens at room temperature, dislocations were observed to arrange themselves on {111} slip planes, as illustrated in Fig. 16(c). At 300C the dynamic recovery occurred, as
illustrated in Fig. 16(e). The dislocations migrated from their slip planes into subgrain boundaries (or cell walls). That would lower the average strain energy associated with the dislocations22) and thus tends to lower the work-hardening
[image:7.595.50.548.84.320.2]produced by the fatigue test. These subgrain boundaries were clearly demonstrated by their diffraction patterns, as the insets in Fig. 17 showing low-angle boundaries. The sub-grain for each sub-grain is near to [011] zone under the same imaging condition. The dynamic recovery in type 316L stainless steel is believed to be related to the test temperature and dislocation density. So the failure mechanism for the type 316L stainless steel at 300C might be influenced by the dynamic recovery.
Table 4 Failure locations of weld specimens for type 316L stainless steel subjected to high-cycle fatigue tests.
Test temperature (C)
Specimen
No. Rratio
Applied max. stress
Fatigue life
Failure location
WHF-7 416.8 >107 Run-out
WHF-8 441.4 370,480 Base metal
25 WHF-11 0.2 441.4 373,776 Base metal
WHF-15 453.6 325,952 Base metal
WHF-14 490.4 196,096 Base metal
WHF-17 294.2 >107 Run-out
25 WHF-18 0:2 318.7 818,560 Weld
WHF-19 343.2 131,936 Weld
WHF-20 343.2 182,656 Weld
TWHF-4 343.2 >107 Run-out
TWHF-3 343.2 351,872 Base metal
300 TWHF-2 0.2 367.8 456,256 Base metal
TWHF-1 392.3 125,846 Weld
TWHF-8 392.3 133,216 Weld
TWHF-6 245.2 >107 Run-out
300 TWHF-5 0:2 269.7 497,664 Base metal
TWHF-7 294.2 170,496 Base metal
(a)
(b)
Micro-defect
[image:7.595.59.279.368.736.2]Initiation site
4. Conclusions
(1) The fatigue limit of type 316L stainless steel strongly depended on the materials strength, which was a function of specimen orientation, test temperature, and welding processes.
(2) The high-cycle fatigue properties of subsize specimens as defined in this report were the same as those for standard specimens at both room temperature and 300C. Therefore, it could be employed as a substitute
to the standard specimen.
(3) The dimension of the fatigue damaged region of a fracture surface increased as the stress ratio decreased. In the case of R¼ 1:0, the fatigue damaged region extended over the whole fracture surface. The fatigue striations were the prevalent features.
(4) The subgrain boundaries in the fatigue specimens were clearly demonstrated by their diffraction patterns,
Surface layers
Cross section
[image:8.595.148.447.72.509.2]R= -1
Fig. 16 TEM images of Type 316L showing significant changes of microstructures between surface layers (a, c, e) and cross sectional layers (b, d, f). (a, b) as-received specimens, (c, d) fatigued specimens tested witht¼392MPa at room temperature, and (e, f) fatigued specimens tested witht¼319MPa atT¼300C. Micrographs were taken with the beam direction near to [011]. Scale bar in (c) applied to all images as well.
[image:8.595.319.532.566.746.2]which were related to the dynamic recovery of multiple dislocations caused.
Acknowledgments
The authors would like to acknowledge the technical support provided by Mr. Jiunn-Shyoung Huang and Ken-Feng Chien.
REFERENCES
1) D. R. Forsyth, B. L. Silverblatt, T. R. Mager, W. A. Bamford, J. A. Tortorice, J. T. Crane and I. L. W. Wilson: Aging management evaluation for reactor internals, (WCAP-14573, 1997), chap. 2, p. 30. 2) D. J. Wulpi: Understanding How Components Fail, (ASM, 1985),
pp. 117–162.
3) A. J. Allen, D. J. Buttle, C. F. Coleman, F. A. Smith and R. L. Smith: Microstructural examination of fatigue accumulation in critical LWR components, EPRI NP-5590, Jan. 1988. chap. 2, pp. 1–14.
4) V. N. Shah and P. E. MacDonald:Residual life assessment of major light water reactor components-overview, (NUREG/CR-4731, EGG-242469, Vol. 1, June 1987), pp. 19–41.
5) V. N. Shah and P. E. MacDonald:Aging and life extension of major light water reactor components, (Elsevier Science Publisher, 1993), Chap. 2, pp. 19–21 and chap. 16, pp. 565–567.
6) K. H. Luk:Boiling-water reactor internals aging degradation study, (ORNL NUREG/CR-5754, 1993), pp. 22–24.
7) K. H. Luk: Pressurized-water reactor internals aging degradation
study, (ORNL NUREG/CR-6048, 1993), pp. 31–32. 8) K. Iida: Nucl. Eng. Des.138(1992) 297–312.
9) S. Jeelani, R. Natarajan and G. R. Reddy: Int. J. Fatigue3(1986) 159– 164.
10) K. C. Liu and M. L. Grossbeck:Use of subsize fatigue specimens for reactor irradiation testing, (ASTM STP 888, 1986), pp. 276–289. 11) J. J. Yeh, J. Y. Huang and R. C. Kuo: High-cycle fatigue behavior of
type 316L Stainless Steel, International symposium on experimental mechanics (ISEM), Taipei Grand Hotel, Taiwan, Dec. 28–30, 2002. 12) Standard Practice for Conducting Force Controlled Constant
Ampli-tude Axial Fatigue Tests of Metallic Materials, (ASTM E 466-96, 1997), pp. 466–470.
13) M. Itow, Y. Abe, A. Sudo and T. Kaneko: Seventh international symposium on environmental degradation of materials in nuclear power systems-water reactors, ed. by G. Aireyet al., (Breckenridge, Colorado, August 7–10, 1995), pp. 541–550.
14) C. Fukuoka, H. Yoshizawa, Y. G. Nakagawa and M. E. Lapides: Metall. Trans. A24A(1993) 2209–2216.
15) C. Laird: Metall. Trans. A8(1977) 851–860.
16) C. Fukuoka and Y. G. Nakagawa: Scr. Mater.34(1996) 1497–1502. 17) K. Katagiri, A. Omura, K. Koyanagi, J. Awatani, T. Shiraishi and
H. Kaneshiro: Metall. Trans. A8(1977) 1769–1773.
18) D. Kuhlmann-Wilsdorf and C. Laird: J. Mater. Sci. Eng.27(1977) 137–156.
19) J. Awatani, K. Katagiri and H. Nakai: Metall. Trans. A9(1978) 111– 116.
20) M. Klesnil and P. Luka´sˇ:Fatigue of Metallic Materials, (Elservier Scientific Publishing Company, 1980) p. 30.
21) C. Y. Chen and W. M. Stobbs: Ultramicroscopy58(1995) 289–305. 22) Robert E. Reed-Hill:Physical Metallurgy Principles, (Van Nostrand