Effect of Crystallization on the Bonding Strength and Failures
of Plasma-Sprayed Hydroxyapatite
Chung-Wei Yang and Truan-Sheng Lui
*Department of Materials Science and Engineering, National Cheng Kung University, No. 1, University Road, Tainan 701, Taiwan, R. O. China
Hydroxyapatite coatings were synthesized on Ti-6Al-4V substrates using the plasma spraying process followed by vacuum and atmospheric post-heat treatments at various elevated temperatures. This study provides an evaluation of the bonding strength and crystallization rate of HACs resulting from the variations in crystallinity and thermal induced cracking. Experimental results provide evidence that the atmospheric heat-treated HACs possessed higher crystallization rate than the vacuum-heated specimens. It implies that the presence of an atmosphere with moisture plays an important role in improving the crystallization of HACs. The bonding strength of all samples was improved with increasing HA crystallization, and the optimal heating condition was found to be about 600C. However, the crystallization-induced defects result in a serious microstructure and bonding strength degradation when the heating temperatures were higher than 600C for both post-heat methods. On the basis of the fracture morphologies observation and the bonding strength data fluctuation of both heating conditions, the Weibull distribution function provides a powerful statistical analysis for assessing the failure mechanism and the reliability of plasma-sprayed and post heat-treated HACs. [doi:10.2320/matertrans.48.211]
(Received August 30, 2006; Accepted November 28, 2006; Published January 25, 2007)
Keywords: hydroxyapatite, heat treatment, crystallization, Young’s modulus, bonding strength, Weibull distribution function
1. Introduction
Hydroxyapatite (HA, Ca10(PO4)6(OH)2) is a bioactive calcium phosphate ceramic with high potential as an implant material for clinical applications owing to its excellent biocompatibility with human bone.1,2) Plasma-sprayed HA coatings (HACs) on bioinert titanium implants is a widely used process due to its good biological fixation and less stress shielding effect with the surrounding bone. But the drawback of plasma spraying is that the crystalline HA is easily-decomposed into Ca3(PO4)2 (TCP), Ca4P2O9 (TP), CaO phases and amorphous calcium phosphate, and it will induce the HA coating dissolution and mechanical degradation after undergoing a period of immersion in vitro and in vivo.3,4)
Previous studies pointed out that an appropriate post-heat treatment is an available method to improve the phase purity and promote HA crystallization.5–8) Furthermore, a better
bonding strength should also be required with a higher HA crystallinity level and fewer coating defects as a result of post-heat treatments.
Reports in recent years have mainly focused on the changes of phase composition and microstructural feature of HACs,8–11)as well as the mechanism of crystallization of the
coating layer.12)The effect of HA crystallization on bonding
strength still needs further investigation. Since microstruc-tural variations pertaining to crystallization during post-heat treatment can be evaluated using thermal dilatometry analy-sis, this study aims to investigate the evolution of bonding strength correlated with the crystallization, the thermal dilatation induced cracking during heating and the data fluctuation of tensile tests. The effect of an ambient heating atmosphere on the bonding strength and failure behavior was also examined through the evaluation of the crystallization rate and the Weibull statistical analysis.
2. Experiments
2.1 Plasma spraying and post-heat treatments
High purity HA powder (XPT-D-701, Sulzer Metco) with particle size ranging from 15 to 40mmwas used in the coating process, and Ti-6Al-4V alloy (ASTM F-136 ELI) was selected as a substrate. Prior to spraying, substrates were grit-blasted with SiC grit, and the surface roughness (Ra) of all specimens was controlled at about6:00:5mm(n¼10). The HA powder was carried by high purity argon gas to the plasma torch with a power of 40.2 kW following the spraying parameters in our previous study,6)and HA coatings (HACs)
with a thickness of12010mmwere prepared. Then post-heat treatments were performed in a vacuum post-heating chamber (Vacuum industries, System VII) with1:33103Pa and in an air furnace, at elevated temperatures of 400, 500, 600, 700 and 800C with a heating rate of 10C/min and held for 3 h.
2.2 Microstructure observation
The as-sprayed and heat-treated HACs were identified by x-ray diffractometry (Rigaku D/MAX III. V), using CuK radiation at 30 kV, 20 mA with a scan speed of 1(2)/min. To evaluate the crystallinity, we adopted a commonly used index of crystallinity (IOC) defined from the ratio of three strongest HA peaks ((211), (112), and (300)) intensity of the HACs (Ic) and the as-received HA powder (I p) according to the relationship IOC¼ ðIc=I pÞ 100%.5,13) This method
assumes that the IOC of as-received powder is 100%. For observation of the cross-sectional microstructure, samples were carefully ground and polished to avoid inducing extra pores and cracks. The polished specimens were coated with carbon, and then examined by a backscattering electron image (BEI) taken with a SEM (Philips XL-40 FEG). Furthermore, SEM/EDS semi-quantitative analysis was performed to evaluate the Ca/P ratio of the HACs, and each value was an average of five EDS spot-checks.
*Corresponding author,
2.3 Thermal dilatometry
Plasma-sprayed HAC test pieces of dimensions 20ðlÞ
3ðwÞ 3ðtÞmm3 without Ti substrate were used for thermal dilatometry by a dilatometer (Netzsch DIL 402 C). The heating condition were the same as the above-mentioned temperatures with a heating rate of 10C/min, followed by
furnace cooling after holding for 3 h.
2.4 Young’s modulus and bonding strength measure-ments
To measure the Young’s modulus of plasma-sprayed coatings, the 1 mm-thick HA coating was coated on the Ti substrate. The HAC test pieces with dimensions of 50ðlÞ 5ðwÞ 1ðtÞmm3for the Young’s modulus measure-ment were carefully cut from Ti substrates by a low-speed diamond saw (Isomet) along the coating/substrate interface, and then they were post-heated at the above-mentioned temperatures. Each as-sprayed and post heat-treated HAC test piece with a surface roughness (Ra) of 2:60:5mm (n¼10) was given a three-point bending test at a crosshead speed 0.01 mm/s to measure the Young’s modulus of the coating layer. The loading direction was perpendicular to the deposition surface, and each value was an average of five tests.
The bonding strength of the HACs was tested using a standard tensile test (ASTM C633-01). The Ti-6Al-4V loading fixtures were grit-blasted and attached to the surface of the HACs using adhesive glue (Metco EP-15) with an adhesive strength of about 60 MPa. After curing in an oven at 180C for 2 h, the assemblies were subjected to tensile tests at
a crosshead speed of 1 mm/min until failure. For the statistical significance of following Weibull analysis, twenty specimens (n¼20) were used for bonding strength measure-ments. Moreover, the failure morphologies of HACs after bonding strength measurement were scanned as image files in a computer to assess the failure mechanism.
3. Results
3.1 Phases composition of the HACs
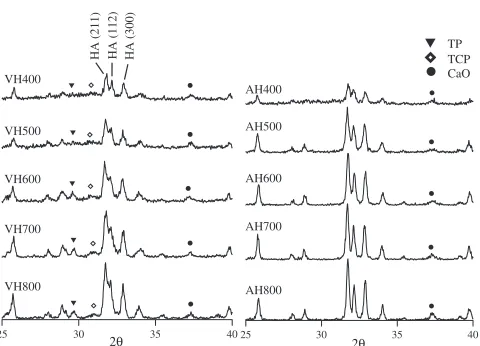
Figure 1 shows the XRD patterns of vacuum and
atmo-spheric heat-treated HACs. The three strongest HA main peaks tend to become sharper with increasing heating temperatures reveals that the HA coating layers possessed different degrees of crystallization after post-heat treatment. In the air, the hydroxyl groups (OH) of atmospheric
moisture recovered and promoted the reconstitution of amorphous calcium phosphate into crystalline hydroxyapa-tite after heating. However, the vacuum heat-treated speci-mens possess more Ca3(PO4)2(TCP), and Ca4P2O9(TP) than the atmospheric heat-treated specimens. From the phase diagram of CaO-P2O5,14)since there was a lack of ambient partial water vapor pressure during vacuum heating, impurity phases could not be eliminated without the replenishment of hydroxyl groups and the increased impurity phase content in the temperature range of 600–800C resulted from the
decomposition of HA.6,15)The CaO remained within both of
the heat-treated HACs because it can not easily be converted into HA if the ambient heating atmosphere without abundant water molecules.6,16)
3.2 Dilatation and Young’s modulus of crystallized HACs
Figure 2(a) illustrates the thermal dilatometry curves for the HACs without Ti-6Al-4V, heating at 400, 500, 600, 700
25 30 35 40
2θ
AH400
AH500
AH600
AH700
AH800
TP TCP CaO VH400
VH500
VH700 VH600
VH800
HA (211) HA (112) HA (300)
25 30 2θ 35 40
Fig. 1 The diffractograms of the HACs with vacuum heat treatment (VH), and atmospheric heat treatment (AH).
200 400 600 800 -0.70
-0.35 0.00 0.35 0.70
Dilatation,
δ
L/Lo (%)
Temperature, T / °C
400°C 500°C 600°C 700°C 800°C
heating
cooling
holding
(a)
20 400 500 600 700 800 23
24 25 26 27
Young's modulus,
E
/ GPa
Temperature, T / °C
(b)
[image:2.595.50.290.68.241.2] [image:2.595.312.541.73.437.2]and 800C, respectively. They all show an approximately linear thermal expansion when the heating temperature is in the range from 100 to 400C. The coefficient of thermal
expansion (CTE,) of a HAC within this temperature range can be evaluated (about15:6106C1) by measuring the slope of the dilatation curves at above-mentioned temper-ature range.
In Fig. 2(a), however, the nonlinear region of the dilatation curves represents a consequence of greater crystallization of plasma-sprayed HACs at 500–800C heating temperature
regions. Table 1 lists the extent of crystallization-induced contraction values, which calculated from the dilatation curves cooling to about 100C, and a significant
crystalliza-tion-induced contraction after heat treatments can be further demonstrated for our previous study.17) The CTE data of crystallized HACs can be calculated from the slope of cooling curves, and the change in the CTE value also means that the effective crystallization temperature of the HA coating layer by post-heat treatment should be over 600C.
A three-point bending test was used to determine the dependence of Young’s modulus on the post heating temper-atures of the HACs. As shown in Fig. 2(b), it is to be noted that the Young’s modulus of the plasma-sprayed HA coating layer was significantly improved with increasing heating temperatures.
3.3 Bonding strength evolution
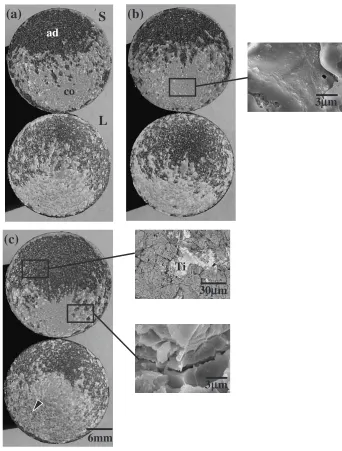
The bonding strength of the as-sprayed and different heat-treated HACs measured by the tensile adhesion test is shown in Fig 3(a). For both the vacuum and atmospheric heat treatments, the bonding strength tends to increase with increasing the heating temperature up to 600C, whereas the
bonding strength markedly decreases with further increasing the heating temperature up to 800C. Considering the
cross-sectional features of the HACs also shown in Fig. 3(a), both the 600C vacuum and atmospheric heat-treated specimens
represent dense microstructure similar to the as-sprayed HACs. However, it is to be noted that an obvious cracking feature (indicated by arrows) and an interfacial TiO2layer (a Rutile phase, Fig. 3(b)) can be recognized under a high temperature heating. The deterioration of the bonding strength should depend on the above-mentioned detrimental defects, especially in the temperature range of 600–800C.
The bonding strength evolution can be recognized as a result of the HA crystallization, and the reason will be discussed later.
3.4 Statistical evaluation on bonding strength with the Weibull model
Owing to the significant data fluctuation of the bonding strength, a statistical distribution function, which is widely used and is known as the Weibull distribution function,18)
was applied to evaluate the HACs underwent different heat treatments. Equation (1) shows the general form of the Weibull distribution function.
FðiÞ ¼
Z¼i
¼0
fðÞd¼1exp io
m
ð1Þ
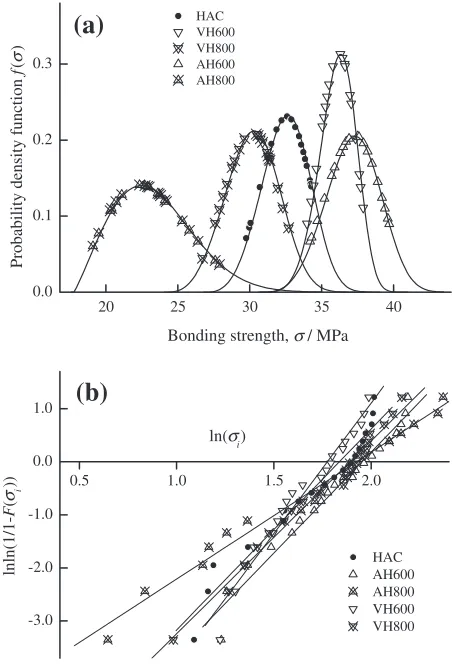
Fitting the bonding strength data into the Weibull distribution function, the failure probability density function fðÞcurves of the as-sprayed HACs, 600C and 800C
heat-treated specimens are plotted in Fig. 4(a). The cumulative failure probability FðiÞ is estimated using the Benard’s
median rank of Eq. (2),19)which is a very close approximated solution of a statistical function.19,20) In addition, the reliability function RðiÞ with a relation of RðiÞ ¼1
FðiÞis defined as the survival probability21)of the specimens
for the purpose of following discussion. Figure 4(b) shows the natural logarithmic (ln) graphs for the cumulative failure probability at each corresponding bonding strength i
(i¼1{20) of the specimens, so as to graphically evaluate the Weibull modulus (m) from the slope of a least-squares fitting method of eq. (3), and the results of Weibull statistical analysis are listed in Table 2.
FðiÞ ¼
i0:3
[image:3.595.309.548.74.349.2]nþ0:4 ð2Þ
Table 1 The coefficient of thermal expansion (CTE,) and the contraction of the crystallized HACs.
Heating
temperatures (10
6C1)1 Contraction (%)2
400C 15.1 0.05
500C 14.8 0.20
600C 13.6 0.28
700C 13.9 0.43
800C 14.3 0.65
1Values were measured from the slope of cooling curves.
2Data obtained from total dilatation of the sample dimension after cooling.
20.0 30.0 40.0 50.0 60.0
2θ
TiO
2
(110)
TiO
2
(101)
TiO
2
(200)
TiO
2
(111)
TiO
2
(210) TiO
2
(211)
TiO
2
(220)
(b)
20 400 500 600 700 800
20 25 30 35 40
Bonding strength,
Temperature, T / °C
as-sprayed HAC Air heating Vacuum heating
TiO2
(a)
50µm
50µm
σ
/ MPa
[image:3.595.47.292.94.181.2]ln ln 1
1FðiÞ
¼mlnðioÞ mln ð3Þ
4. Discussion
4.1 Crystallization effect of post-heat treatments Considering the formation of amorphous calcium phos-phate during plasma spraying, performing a post-heating can actually promote crystallization.5–7,22) Besides the heating
temperature, the effect of the ambient heating atmosphere is another factor that was investigated and found to affect the HA crystallization rate. The purpose of this study is to clarify
the effect of the ambient atmosphere on the crystallization and the bonding strength of HACs.
It is recognized that HA crystallization should follow the second order reaction kinetics of Arrhenius equation,23–25)as
below:
d
dt ¼kð1Þ
2¼Aexp Ea
RT
ð1Þ2 ð4Þ
is the conversion ratio of HA from amorphous calcium phosphate to crystalline HA, and it represents the IOC value herein. Therefore, the reaction rate and the activation energy of HA crystallization within different ambient heating atmospheres can be quantitatively evaluated by the IOC and the results are shown in Table 3. The experimental results prove that there is a faster crystallization rate (k) and lower activation energy of crystallization for post-heat treatment in an ambient atmosphere with a partial water vapor pressure than in a vacuum. Except for considering the oxidation problem of Ti-6Al-4V during heating, atmospheric heat treatment can be recognized as a better way to improve the HA phase purity and crystallization rate of plasma-sprayed HACs than vacuum heat treatment under the same heating conditions.
Since the Young’s modulus is a measure of the inter-atomic binding forces, the Young’s modulus of the HACs depends on the crystallization, and Fig. 5 shows a linear relationship between the Young’s modulus and the crystal-linity (IOC) of the HACs. Although the porosity is also an influencing factor on the Young’s modulus of a coating,
0.5 1.0 1.5 2.0
-3.0 -2.0 -1.0 0.0 1.0
HAC AH600 AH800 VH600 VH800
lnln(1/1-F
(
i
))
σ
ln(σi)
(b)
(a)
20 25 30 35 40
0.0 0.1 0.2 0.3
HAC VH600 VH800 AH600 AH800
Probability density function
f
(
Bonding strength,σ/ MPa
σ
)
[image:4.595.56.282.73.408.2]Fig. 4 (a) The failure probability density functionfðÞcurves, and (b) the Weibull distribution plots of the HACs.FðiÞis the cumulative failure probability at the corresponding bonding strength (i) and the slope represents the Weibull modulus (m), which calculated by the least-squares fitting method of Eq. (3) at a maximum coefficient of determination (R2).
Table 2 Weibull parameters of as-sprayed and heat-treated HACs.
Weibull modulus,m1
Scaling parameter,1
Minimum strength,
o1(MPa)
R22
as-sprayed HAC 3.8 6.3 26.8 0.95
VH600 4.9 5.9 30.6 0.98
VH800 3.6 6.6 24.1 0.99
AH600 3.8 7.0 30.8 0.99
AH800 2.1 6.3 17.7 0.99
1Data were calculated fromln lnð1=1Fð
[image:4.595.305.551.95.150.2]iÞÞvs.lnðioÞgraphs. 2The coefficient of determination, which is a maximum value of the least-squares fitting method of eq. (3).
Table 3 Results of crystallization kinetics of the HACs with post-heat treatments.
Rate constant,k¼AeEa=RT
Activation energy,
k500 k600 k800 Ea(kJ/mol)
Vacuum heating 0.197 0.365 0.586 24.6
Atmospheric heating 0.272 0.379 0.612 19.1
Data were calculated from the slope oflnk vs. heating temperatures graph.
23 24 25 26 27
0 20 40 60 80 100
Index of crystallinity, IOC (%)
Young's modulus,
E
/ GPa
R2= 0.99 50µm
[image:4.595.311.541.190.367.2] [image:4.595.46.292.499.584.2]SEM/BEI images in Fig. 5 indicate that there is no obvious difference between various heat-treated HAC test pieces. It is reasonable to suggest that the crystallinity of HACs is a main controlling factor in increasing the Young’s modulus. There-fore, the bonding strength of the heat-treated HACs is further enhanced owing to the improvement of Young’s modulus and fracture toughness resulting from crystallization of the HA coating layer.5,26) On the other hand, the mismatch of the thermal expansion coefficient between the HA coating layer and Ti-6Al-4V will generate thermal stress. From thermal dilatometry data, as shown in Table 1, a significant variation in the CTE value of the crystallized HAC and a decrease in the thermal expansion mismatch at 400–600C heating
temperatures can be recognized as improving the bonding strength. (the CTE value of Ti-6Al-4V at 400–600C varies
from9:4106C1to9:7106C1).27)
A significant crystallization-induced contraction has been demonstrated from thermal dilatometry, Figure 6 shows a typical SEM/SEI observation nearby the contraction-in-duced cracks of the heat-treated HACs in the range of 600– 800C, and there is an obvious contrast within this area.
Through the semi-quantitative analysis of SEM/EDS results, the light gray contrast denoted by ‘‘C’’ with a Ca/P ratio of 1.61 represents the occurrence of HA crystallization close to the enlarged cracks after heat treatment, and the dark gray region ‘‘N’’ with a low Ca/P atomic ratio of 1.35 represents a non-stoichiometric calcium phosphate region away from the ‘‘C’’ region. By incorporating of the IOC and the thermal dilatometry results, therefore, it can be recognized that the formation and the propagation of enlarged cracks was due to the coating contraction during crystallization. Raising the heating temperature will induce significant changes in the microstructural feature and bonding strength.
4.2 Bonding strength and failure mechanism of the HACs
As shown in Fig. 3(a), the bonding strength is strongly dependent on the post heating temperatures, and an optimum condition of 600C was identified. In addition, plasma-sprayed coating layers possess inevitable spraying defects
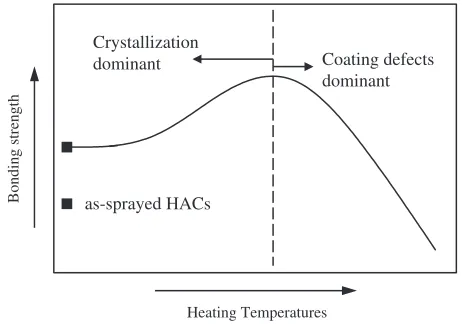
which are susceptible to failure. Early failures are often attributed to interfacial failures between the Ti-6Al-4V and coating layer. For the present study, the failure mechanism was observed within all the post heating specimens and further clarified for the past studies.6,28)Figure 7 depicts the
overall dependence of bonding strength on heating temper-ature that can be generalized into two characteristic regions. According to the previous discussion, bonding strength at temperatures lower than 600C was strongly affected by
crystallization, which acted as a main controlling factor. Additionally, considering the dilatation data of thermal dilatometry (Table 1) at 600–800C, the enlarged cracks
induced from the crystallized-contraction of HAC may have changed the fracture behavior pertaining to plasma-spraying defects (Fig. 8), which causing deterioration in bonding strength. The relationship between the heating temperature and the bonding strength was found to be related to the crystallization behavior.
The formation of titanium oxide often causes serious interfacial fractures at elevated heating temperatures,29)
and Fig. 3(a) reveals that the lowest bonding strength for atmospheric heating specimens at 700–800C not only
resulted from the above-mentioned HA crystallization-induced cracks, but also the formation of detrimental interfacial TiO2. Since the Weibull distribution function is used to model the reliability and the failure behavior of materials in our previous study,17) an examination of the
Weibull modulus shown in Table 2 indicated that plasma-sprayed HACs with post-heat treatments are reliable materi-als with a wear-out failure model (m>1) of increasing failure rate (IFR). Moreover, a failure rate function ðiÞ
shown in eq. (5) at each corresponding bonding strength is defined for evaluating the failure mechanism of HACs.
ðiÞ ¼
fðiÞ
RðiÞ
¼ m
mðioÞ
m1 ð5Þ
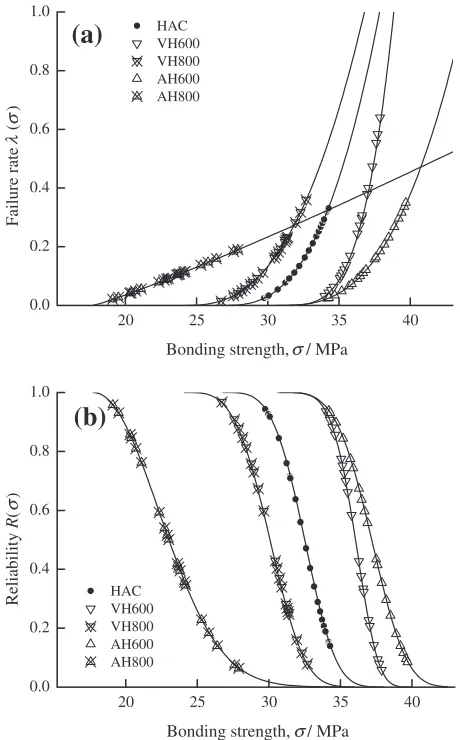
Figure 9 shows the failure rate function (ðÞ) and reliability function (RðÞ) of the as-sprayed HACs, 600C,
and 800C heat-treated specimens. These curves start from the minimum strength (o), which implies the failure
probability of HACs less than this strength is zero and the
5
µ
m
N
C
Fig. 6 Enlarged cracks of the heat-treated HACs, which showing the presence of the crystallized (denoted by ‘‘C’’) and the non-stoichiometric calcium phosphate (denoted by ‘‘N’’) regions that can be recognized by different contrast.
Bonding strength
Heating Temperatures
Crystallization
dominant Coating defects
dominant
as-sprayed HACs
[image:5.595.47.288.71.236.2] [image:5.595.311.542.72.235.2]reliability of HACs is 1.0. Therefore, the minimum strength can be recognized as a safety value for the HACs. Mean-while, considered with Table 2, knowledge of the Weibull modulus (m) can provide further explanation for the above-mentioned effects on the bonding strength of the HACs. The Weibull modulus is a measure of the variability of the data, which being larger as the degree of bonding strength scattering decreases (Fig. 9(a)). A material with a larger Weibull modulus shows less reliability decrease (Fig. 9(b)). The representative failure morphologies of these condi-tions are shown in Fig. 10. Failures resulted from the crystallization-induced cracks and the interfacial TiO2 can be clarified through the high magnitude SEM observation. It is recognized that the cohesive failure is dominated by the microstructural feature and more commonly found in high strength coatings.5,22)Therefore, the HAC with an increased
Weibull modulus means that a strengthened, reliable coating can be acquired with the crystallization after heat treatment. Its failure morphology represents homogeneity and displays a larger cohesive failure area as shown in Fig. 10(b). However, the HAC with a decreased Weibull modulus resulted from detrimental crystallization-induced cracks within the coating. In addition, considering the atmospheric heating specimen AH800, the serious interfacial TiO2induced the debonding of the coating layer from the substrate, as shown in Fig. 10(c). These phenomenons caused a larger data fluctuation and a lower coating reliability as well as the decreased Weibull modulus.
To conclude, the bonding strength is further enhanced by HA crystallization. The atmospheric heat treatment produces a higher crystallization rate and crystallinity than the vacuum heating within the temperature ranges of 400–600C.
How-ever, heating temperatures over 600C do not further improve the bonding strength, which is attributable to the formation of crystallization-induced cracks and serious substrate oxidation for both high-temperature heat treat-ments. Therefore, it is indispensable to develop a lower-temperature treating process, for example: a hydrothermal treatment, with an abundant water vapor atmosphere that can simultaneously acquire higher crystallinity and bonding strength without microstructural deterioration.
5. Conclusions
The effect of crystallization on the evolution of micro-structural features and bonding strength at different heating temperatures has been characterized. The results can be summarized as follows:
(1) Young’s modulus tends to increase with increasing the crystallinity of heat-treated HACs. On the other hand,
Ti-6Al-4V
substrate
(a)
HAC
(b)
HAC
Ti-6Al-4V
TiO
2
Fig. 8 The illustration of (a) the contraction of crystallized HAC at excessive elevated heating temperatures causes (b) the formation of contraction-induced cracks after cooling to room temperature. The solid line indicates the crystallization-contracted HAC and the broken line indicates the extended HAC restricted by the substrate.
20 25 30 35 40
0.0 0.2 0.4 0.6 0.8 1.0
HAC VH600 VH800 AH600 AH800
Reliability
R
()
σ
Bonding strength, / MPaσ
(b)
20 25 30 35 40
0.0 0.2 0.4 0.6 0.8 1.0
HAC VH600 VH800 AH600 AH800
Failure rate
)
σ
Bonding strength, / MPaσ
(a)
λ
(
[image:6.595.312.542.72.442.2] [image:6.595.53.286.73.366.2]HA crystallization induces a certain degree of coating contraction that results in the formation of enlarged cracks.
(2) Better bonding strength can be acquired at a heating temperature of 600C with or without an atmosphere.
Crystallinity can be increased with post heating, resulting in an improvement of the bonding strength of the HACs.
(3) Detrimental contraction-induced cracks tend to occur at temperatures beyond 600C, causing the degradation of
bonding strength.
(4) The ambient heating atmosphere plays an important role in the HA crystallization kinetics during heating. The atmospheric heat treatment shows a faster HA crystallization rate and lower activation energy of crystallization than the vacuum heat treatment. (5) According to the analysis results of Weibull distribution
function, an increased Weibull modulus (m) represents that the bonding strength and the reliability of the HACs are further improved by HA crystallization. However, a decreased Weibull modulus indicates that the crystal-lization-induced cracks and the interfacial oxidation layer are harmful to the plasma-sprayed HACs.
Acknowledgments
This study was financially supported by the National Science Council of Taiwan for which we are grateful (Contract No. NSC 95-2221-E-006-118).
REFERENCES
1) E. Munting, M. Verhelpen, F. Li and A. Vincent, in: T. Yamamuro, L. L. Hench and J. Wilson (Eds.): CRC handbook of bioactive
co
ad
S
L
(a)
(b)
3
6mm
(c)
3 m
30
Ti
µ
m
µ
[image:7.595.125.467.69.520.2]µ
m
ceramics, II., Boca Raton, (CRC Press Inc., Florida, 1990) pp. 143– 148.
2) L. L. Hench: J. Am. Ceram. Soc.74(1991) 1487–1510.
3) C. Y. Yang, B. C. Wang, E. Chang and B. C. Wu: J. Mater. Sci: Mater. Med.6(1995) 258–265.
4) C. Y. Yang, R. M. Lin, B. C. Wang, T. M. Lee, E. Chang, Y. S. Hang and P. Q. Chen: J. Biomed. Mater. Res.37(1997) 335–345. 5) S. W. K. Kweh, K. A. Khor and P. Cheang: Biomaterials21(2000)
1223–1234.
6) C. W. Yang, T. M. Lee, T. S. Lui and E. Chang: Mater. Trans.46(2005) 709–715.
7) K. A. Khor, Y. W. Gu, D. Pan and P. Cheang: Biomaterials25(2004) 4009–4017.
8) Y. P. Lee, C. K. Wang, T. H. Huang, C. C. Chen, C. T. Kao and S. J. Ding: Surf. Coat. Technol.197(2005) 367–374.
9) Y. P. Lu, S. T. Li, R. F. Zhu, M. S. Li and T. Q. Lei: Surf. Coat. Technol.165(2003) 65–70.
10) Y. P. Lu, Y. Z. Song, R. F. Zhu, M. S. Li and T. Q. Lei: Appl. Surf. Sci. 206(2003) 345–354.
11) Y. Yang, K. H. Kim, C. M. Agrawal and J. L. Ong: Biomaterials25 (2004) 2927–2932.
12) K. A. Gross, V. Gross and C. C. Berndt: J. Am. Ceram. Soc.81(1998) 106–112.
13) Y. C. Yang and E. Chang: Thin Solid Films444(2003) 260–275. 14) R. S. Roth, T. Negas and L. P. Cook:Phase Diagrams for Ceramists, 5.,
(American Ceramic Society, Washington DC, 1983) pp. 321–322.
15) J. Weng, X. Liu, X. Zhang and K. de Groot: J. Biomed. Mater. Res.30 (1996) 5–11.
16) J. Chen, W. Tong, Y. Cao, J. Feng and X. Zhang: J. Biomed. Mater. Res.34(1997) 15–20.
17) C. W. Yang, T. M. Lee, T. S. Lui and E. Chang: Mater. Sci. Eng. C26 (2006) 1395–1400.
18) W. Weibull: J. Appl. Mecha.18(1951) 293–297.
19) R. B. Abernethy, ‘‘The New Weibull Handbook: Reliability and Statistical Analysis for Predicting Life, Safety, Survivability, Risk, Cost and Warranty Claims’’, 4th Ed. (North Palm Beach, FL, 2000). 20) B. Faucher and W. R. Tyson: J. Mater. Sci. Lett.7(1988) 1199–1203. 21) M. F. Burrow, D. Thomas, M. V. Swain and M. J. Tyas: Biomaterials
25(2004) 5031–5035.
22) C. W. Yang, T. S. Lui, T. M. Lee and E. Chang E: Mater. Trans.45 (2004) 2922–2929.
23) C. Chang, J. Huang, J. Xia J. and C. Ding: Ceram. Inter.25(1999) 479– 483.
24) L. Y. Huang, K. W. Xu and J. Lu: J. Mater. Sci.: Mater. Med.11(2000) 667–673.
25) C. Liu, Y. Huang, W. Shen and J. Cui: Biomaterials22(2001) 301–306. 26) G. K. Beshish, C. W. Florey, F. J. Worzala and W. J. Lenling: J. Therm.
Spray. Technol.2(1993) 35–38.
27) M. J. Conachie, Jr.:Titanium: A technical guide, (ASM International, Metals Park, OH, USA, 1989) pp. 451–452.