Statistical Significance Tests for Machine Translation Evaluation
Philipp KoehnComputer Science and Artificial Intelligence Laboratory Massachusetts Institute of Technology
The Stata Center, 32 Vassar Street, Cambridge, MA 02139 [email protected]
Abstract
If two translation systems differ differ in perfor-mance on a test set, can we trust that this indicates a difference in true system quality? To answer this question, we describe bootstrap resampling meth-ods to compute statistical significance of test results, and validate them on the concrete example of the BLEU score. Even for small test sizes of only 300 sentences, our methods may give us assurances that test result differences are real.
1 Introduction
Recently, the field of machine translation has been changed by the emergence both of effective statisti-cal methods to automatistatisti-cally train machine transla-tion systems from translated text sources (so-called parallel corpora) and of reliable automatic evalua-tion methods.
Machine translation systems can now be built and evaluated from black box tools and parallel corpora, with no human involvement at all.
The evaluation of machine translation systems has changed dramatically in the last few years. In-stead of reporting human judgment of translation quality, researchers now rely on automatic mea-sures, most notably the BLEU score, which mea-sures n-gram overlap with reference translations. Since it has been shown that the BLEU score cor-relates with human judgment, an improvement in BLEUis taken as evidence for improvement in trans-lation quality.
Building the tools for any translation system in-volves many iterations of changes and performance testing. It is important to have a method at hand that gives us assurances that the observed increase in the test score on a test set reflects true improvement in system quality.
In other words, we need to be able to gauge, if the increase in score is statistically significant. Since complex metrics such as BLEU do not lend them-selves to an analytical technique for assessing statis-tical significance, we propose bootstrap resampling
methods.
We also provide empirical evidence that the esti-mated significance levels are accurate by comparing different systems on a large number of test sets of various sizes.
In this paper, after providing some background, we will examine some properties of the widely used BLEU metric, discuss experimental design, intro-duce bootstrap resampling methods for statistical significance estimation and report on experimental results that demonstrate the accuracy of the meth-ods.
2 Background
2.1 Statistical Machine Translation
Statistical machine translation was introduced by work at IBM [Brown et al., 1990, 1993]. Currently, the most successful such systems employ so-called phrase-based methods that translate input text by translating sequences of words at a time [Och, 2002; Zens et al., 2002; Koehn et al., 2003; Vogel et al., 2003; Tillmann, 2003]
Phrase-based machine translation systems make use of a language model trained for the target lan-guage and a translation model trained from a paral-lel corpus. The translation model is typically bro-ken down into several components, e.g., reordering model, phrase translation model, and word transla-tion model.
2.2 Automatic Evaluation
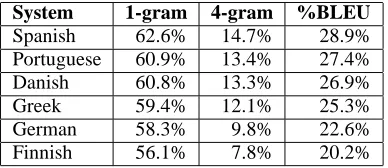
System 1-gram 4-gram %BLEU
Spanish 62.6% 14.7% 28.9% Portuguese 60.9% 13.4% 27.4%
Danish 60.8% 13.3% 26.9%
Greek 59.4% 12.1% 25.3%
German 58.3% 9.8% 22.6%
[image:2.595.86.280.71.155.2]Finnish 56.1% 7.8% 20.2%
Table 1: Translation quality of three systems, mea-sured by theBLEUscore and n-gram precision
Human judges may be asked to evaluate the ad-equacy and fluency of translation output, but this is a laborious and expensive task. Papineni et al. [2002] addressed the evaluation problem by intro-ducing an automatic scoring metric, called BLEU, which allowed the automatic calculation of transla-tion quality. The system output is compared against a reference translation of the same source text.
2.3 BLEU: A Closer Look
Formally, the BLEUmetric is computed as follows. Given the precision
of n-grams of size up to
(usually
), the length of the test set in words ( ) and the length of the reference translation
in words ( ),
BLEU
BP exp
log
(1)
BP
min
(2)
The effectiveness of the BLEU metric has been demonstrated by showing that it correlates with hu-man judgment.
Let us highlight two properties of the BLEU met-ric: the reliance on higher n-grams and the brevity penalty BP. First, look at Table 1. Six different sys-tems are compared here (we will get later into the nature of these systems). While the unigram pre-cision of the three systems hovers around 60%, the difference in 4-gram precision is much larger. The Finnish system has only roughly half (7.8%) of the 4-gram precision of the Spanish system (14.7%). This is the cause for the relative large distance in overallBLEU(28.9% vs. 20.2%)1. Higher n-grams (and we could go beyond 4), measure not only syn-tactic cohesion and semantic adequacy of the out-put, but also give discriminatory power to the met-ric.
The other property worth noting is the strong in-fluence of the brevity penalty. SinceBLEUis a preci-sion based method, the brevity penalty assures that a
1We use in this paper the %
BLEUnotation: aBLEUscore of 0.289 is reported as 28.9%BLEU
23 24 25 26 27 28 29 30 31 32
0.85 0.9 0.95 1 1.05 1.1 1.15 1.2
BLEU / GTM score
length ration (output/reference) BLEU Spanish BLEU Portuguese GTM Spanish GTM Portuguese
Figure 1: Effect of output length onBLEUandGTM score: brevity penalty inBLEUcauses score to drop dramatically with shorter output
system does not only translate fragments of the test set of which it is confident, resulting in high preci-sion.
Is has become common practice to include a word penalty component in statistical machine translation system that gives bias to either longer or shorter out-put. This is especially relevant for theBLEU score that harshly penalizes translation output that is too short.
To illustrate this point, see Figure 1. BLEUscores for both Spanish and Portuguese system drop off when a large word penalty is introduced into the translation model, forcing shorter output. This is not the case for a similar metric, GTM, an n-gram precision/recall metric proposed by Melamed et al. [2003] that does not have an explicit brevity penalty. TheBLEUmetric also works with multiple refer-ence translations. However, we often do not have the luxury of having multiple translations of the same source material. Fortunately, it has not been shown so far that having only a single reference translation causes serious problems.
While BLEU has become the most popular met-ric for machine translation evaluation, some of its short-comings have become apparent: It does not work on single sentences, since 4-gram precision is often 0. It is also hard to interpret. What a BLEU score of 28.9% means is not intuitive and depends, e.g., on the number of reference translation used. Some researchers have recently used relative human BLEU scores, by comparing machine BLEU scores with high quality human translation scores. How-ever, the resulting numbers are unrealistically high.
3 Experimental Design
[image:2.595.318.524.75.221.2]20 25 30 35 40
10 20 30 40 50 60 70 80 90 100
%BLEU
[image:3.595.318.523.73.222.2]sample
Figure 2:BLEUscore of the Spanish-English system on 100 blocks of 300 sentences each
preliminary experiments that give us some intuition on variance of test scores on different test sets.
3.1 System and Corpus
We carry out experiments using a phrase-based sta-tistical machine translation system [Koehn et al., 2003; Koehn, 2004]. We train this system on the Europarl corpus, a parallel corpus in 11 European languages of 20-30 million words per language [Koehn, 2002].
Since the focus of this paper is the comparison of the performance of different systems, we need a set of translation systems. Here, we resort to a trick: Instead of comparing different machine translation methods trained on the same training data, we train the same machine translation method on different parallel copora: language pairs with English as the target language and any of the 10 other languages as the source language.
Then, we assemble a test set that is sentence aligned across all 11 languages. During evalua-tion, the, say, Spanish-English and Danish-English system each translate a sentence that correspond to the same English reference translation. Hence, we can compare how well the English output of the Spanish-English translation system matches the ref-erence sentence vs. how well the English output of the Portuguese-English matches the reference sen-tence.
We would like to stress that comparing perfor-mance of a method that translates text from differ-ent languages instead of using differdiffer-ent translation methods on the same input text is irrelevant for the purpose of this paper. We are comparing output of different systems in either case. As an alternative, we may also use a single language pair and different systems, say, by using different parameter settings. But we feel that this would leave us with many ar-bitrary choices that we would like to avoid for the
20 25 30 35 40
10 20 30 40 50 60 70 80 90 100
%BLEU
[image:3.595.75.280.74.221.2]sample
Figure 3:BLEU score on 100 broad samples of 300 sentences: smaller variance in test results
sake of clarity of our argument.
3.2 Selecting a Test Set
We already reported some BLEU scores earlier. These were computed on a 30,000 sentence test set (about 900,000 words). Such a huge test set is very uncommon2, since translating such a large amount of text is computationally very expensive. It may take hours or even days, which does not contribute to a fast turn-around system development process. Therefore, we would like to be able to work with smaller test sets.
The trade-off between fast testing and having meaningful results is at the very heart of this paper: The statistical significance tests we propose give us the means to assess the significance of test results.
Let us start with the following experiment: We break up the test set into 100 blocks of 300 con-secutive sentences each, translate each block, and compute theBLEUscore for each block. We plot in Figure 2 theBLEUscores for each of the 100 blocks for the Spanish system.
The BLEU scores for the 100 blocks vary from 21% to 37%. Many factors influence why some sen-tences are easier to translate than others: unknown words, sentence length, degree of syntactic and se-mantic divergence, and how the input and reference translation were generated — in case of Europarl they may be both translations from a third language.
3.3 Broad Sampling
Factors that influence translation difficulty may be clustered. For instance, the original language, or the topic and style (and hence vocabulary) usually stays the same over many sentences in sequence. When we collect only 300 sentences in sequence, certain
2The annual DARPA/NIST evaluations use test sets of size
-1 0 1 2 3 4 5
10 20 30 40 50 60 70 80 90 100
difference in %BLEU
[image:4.595.75.280.74.221.2]sample
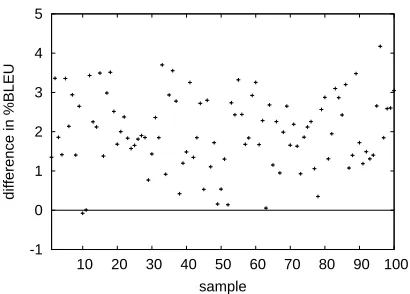
Figure 4: Difference inBLEUbetween Spanish and Danish system on 100 broad samples
factors may very strongly affect some samples, but not others.
Therefore, better test sets of 300 sentences may be constructed by sampling these sentences from different parts of the corpus. In an effort to collect better test sets, we now place into test set the sen-tences
. Let us
call this a broad sample.
Again, we measure translation quality on each of these 100 broad samples. Figure 3 shows that theBLEUscores are now closer together — ranging from 27% to 31%.
3.4 Comparison of Translation Performance Obtaining aBLEUscore for a translation system on a given test set is not very meaningful by itself. We want to use the metric to compare different transla-tion systems.
In a third preliminary experiment, we compared for each of the 300 broad samples, theBLEU score for the Spanish system against the BLEU score for the Danish system.
Results are in Figure 4. The Spanish system is better by up to 4%. In only one sample, sample no. 10, the Danish system outperforms the Spanish sys-tem by 0.07%.
Let us stress in conclusion at this point that – when working with small test sets – it is impor-tant to obtain a representative sample, as much as this is possible. Translation quality of neighboring sentences correlates positively, therefore we want to chose test sentences from different parts of a larger set.
4 Statistical Significance
The purpose of experimental testing is to assess the true translation quality of a system on text from a certain domain. However, even with the qualifier “from a certain domain”, this is an abstract concept,
since it has to be computed on all possible sentences in that domain. In practice, we will always just be able to measure the performance of the system on a specific sample. From this test result, we would like to conclude what the true translation performance is.
Statistical significance is an estimate of the de-gree, to which the true translation quality lies within a confidence interval around the measurement on the test sets. A commonly used level of reliability of the result is 95%, also written as
, called
p-level.
Let us explore this notion on a simpler metric of translation quality thanBLEU. A common metric in older machine translation papers is a score from 1 to 5 for each sentence, or even simpler: a human judge deemed a translation either as correct or wrong.
If, say, 100 sentence translations are evaluated, and 30 are found correct, what can we say about the true translation quality of the system? Our best guess is 30%, but that may be a few percent off. How much off, is the question to be answered by statistical significance tests.
Given a set of sentences, we can compute the sample mean and variance of the individual sen-tence scores :
(3)
(4)
What we are really interested in, however is the true mean . Let us assume that the sentence scores
are distributed according to the normal distribution. This implies that a sentence score is independent from other sentence scores.
Since we do not know the true mean and
vari-ance
, we can not model the distribution of sen-tence scores with the normal distribution. However, we can use Student’s t-distribution, which approxi-mates the normal distribution for large .
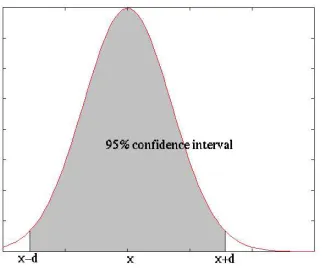
See Figure 5 for an illustration: Given the sam-ple mean
and sample variance
, we estimate the probability distribution for true translation qual-ity. We are now interested in a confidence inter-val
around the mean sentence score. The true translation quality (or the true mean lies
within in the confidence interval with a probability
!
.
Figure 5: With probability !
(shaded area),
the number of correct translations lies in an interval
around the mean sentence score
The confidence interval is indicated by the bound-aries on the x-axis.
The functional mapping between a confidence in-terval
and the probability !
can be obtained by integrating over the distribution. How-ever, in case of Student’s t-distribution, the solution to this does not exist in closed form, but we can use numerical methods.
The size of the confidence interval can be com-puted by
(5)
The factor
depends on the desired p-level of sta-tistical significance and the sample size. See Table 2 for typical values.
We described the standard method to compute statistical significance for some machine translation evaluation metrics. Unfortunately, this method to compute confidence intervals does not work for the BLEUmetric, since theBLEUmetric is not the mean of single sentence scores.
5 Bootstrap Resampling
Recall that we want to answer the following ques-tion: Given a test result of BLEU, we want to
compute with a confidence!
(or p-level
!
) that the true BLEU score lies in an interval
.
Instead of using an analytical method to compute confidence intervals for theBLEUscore, we resort to a randomized method, called bootstrap resampling. Bootstrap resampling has a long tradition in the field of statistics, refer to Efron and Tibshirani [1994] for a general introduction and Press et al. [2002] for a typical implementation.
Some recent papers on statistical machine trans-lation hint on the use of bootstrap resampling for
Significance Test Sample Size
Level 100 300 600
[image:5.595.318.537.70.131.2]99% 2.6259 2.5923 2.5841 2.5759 95% 1.9849 1.9679 1.9639 1.9600 90% 1.6602 1.6499 1.6474 1.6449
Table 2: Values for
for different sizes and signifi-cance levels (Formula 5)
assessing statistical significance of test results [Ger-mann, 2003; Och, 2003; Kumar and Byrne, 2004], but do not lay out their methodology.
The intuition behind bootstrap resampling goes as follows: Assume that we can only test transla-tion performance on a test set of
sen-tences. These 300 sentences are randomly drawn from the world. Given a test set, we can compute a BLEUscore. Then, we draw a second test set of 300 sentences, and compute its BLEU score. If we do this repeatedly, we get a number of different BLEU scores, not unlike theBLEUscores displayed in Fig-ure 3.
If we do this for a large number
of test sets (say 1000 times), we can sort the corresponding BLEU scores. If we drop the top 2.5% and bottom 2.5% of BLEU scores, we have the remaining 95% ofBLEU scores in an interval . The law of large numbers
dictates, that with an increasingly large number
of BLEUscores, the interval approaches the 95%
confidence interval for scores of test sets of size 300. Of course, having to translate and score sets of 300 sentences repeatedly, does not save anything in terms of computational translation cost and the need for a large set of potential sentences. We therefore, take the following leap: Instead of the selected the 300 sentences in each test set from an infinite set of test sentences, we draw them from the same set of 300 sentences with replacement.
Let us clearly state this assumption:
Assumption: Estimating the confi-dence interval from a large number of test sets with test sentences drawn from a set of test sentences with replacement is as good as estimating the confidence interval for test sets size from a large number of test sets with test sentences drawn from an infinite set of test sentences.
The benefit of this assumption is clear: We only have to translate (say, 300) sentences. We will now provide empirical evidence that we can make this assumption.
[image:5.595.110.274.72.208.2]24 25 26 27 28 29 30 31 32 33 34
0 10 20 30 40 50 60 70 80 90 100
95% range for %BLEU
sample
Figure 6: Bootstrapped 95% confidence intervals of true BLEUon 100 broad samples of 300 sentences: Assuming the 30,000 sentenceBLEU as true score, three mistakes (3%) are made: on test set no. 10, 81, and 88
fidence intervals computed for 100 test sets of 300 sentences. For each of the 100 test sets, we compute the confidence interval as described before: We re-peatedly (1000 times) generateBLEUscores on test sets of 300 sentences drawn from this one test set of 300 sentences.
We use the 1000BLEUscores to estimate the con-fidence interval. We drop the top 25 and bottom 25 BLEU scores, so that the displayed interval ranges from the 26th best BLEU score to the 975th best. For the first test set, we obtain a confidence interval of [26.5,30.7], for the second test set a confidence interval of [27.5,33.0], and so on.
We do not know the trueBLEUscore for this sys-tem, which has to be computed on a near-infinite number of test sentences. But theBLEU score com-puted on 30,000 test sentences is as good as any (assuming 30,000 is close to infinite). It is, as you recall from Table 1, 28.9%. For all but three test set, this near-true test score lies within the esti-mated confidence interval. Loosely speaking, the 95% confidence level is actually 97% correct.
6 Paired Bootstrap Resampling
As stated earlier, the value of scoring metrics comes from being able to compare the quality of different translation systems.
Typically, we want to compare two systems. We translate the same test set with the two systems, and measure the translation quality using an evaluation metric. One system will fare better than the other, with some difference in score.
Can we conclude that the better scoring system is truly better? If the differences in score are small, we intuitively have some doubt.
40 50 60 70 80 90 100
10 20 30 40 50 60 70 80 90 100
statistical significance
[image:6.595.317.523.75.222.2]sample
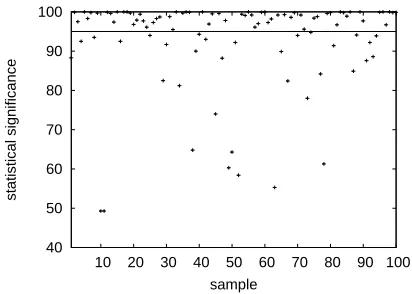
Figure 7: Paired bootstrap resampling results on 100 broad samples of 300 sentences: For 65 sam-ples we make a 95% statistically significant conclu-sion that the Spanish system is better than the Dan-ish (dots above the 95% line
We would like measure the reliability of the con-clusion that one system is better than the other, or in other words, that the difference in test scores is statistical significant.
As in the previous section, we use a bootstrap re-sampling method for this: Given a small collection of translated sentences, we repeatedly (say, 1000 times) create new virtual test sets by drawing sen-tences with replacement from the collection. For each set, we compute the evaluation metric score for both systems. We note, which system performs better. If, say, one system outperforms the other sys-tem 95% of the time, we draw the conclusion that it is better with 95% statistical significance. We call this method paired bootstrap resampling, since we compare a pair of systems.
We carry out experiments using this method us-ing theBLEUscore to compare the Spanish-English system with the Danish-English system. Results are displayed in Figure 7. We estimate statistical signif-icance for 100 different test sets with 300 sentences each (the same broad samples used in previous ex-periments). For 65 samples we draw the conclusion the Spanish system is better than the Danish with at least 95% statistical significance.
Recall that theBLEUscore difference on the huge 30,000 sentence test set is 2.0% (refer to Table 1). In this particular case, a small 300 sentence test set is often sufficient to detect the superiority of one of the systems with statistical significance.
0 20 40 60 80 100
10 20 30 40 50 60 70 80 90 100
statistical significance
[image:7.595.323.525.70.191.2]sample
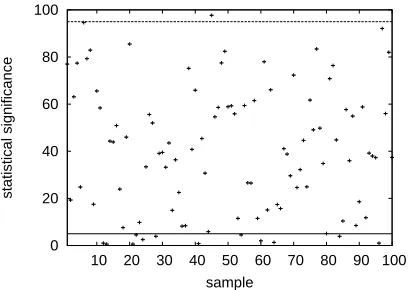
Figure 8: Paired bootstrap resampling results on 100 broad samples of 300 sentences: For 12 sam-ples we make a 95% statistically significant conclu-sion that the Portuguese system is better than the Danish, and 1 conclusion to the opposite
is only 0.5%. Using paired bootstrap resampling, we drawn 13 conclusions: 12 correct conclusions that the Portuguese system is better, and one wrong conclusion that the Danish system is better.
That we draw one wrong conclusion, is unfortu-nate, but should not come as a surprise, when we talk about 95% statistical singificance levels. At this level, 1 conclusion in 20 is expected to be wrong.
7 Validation Experiments
We introduced two methods using bootstrap resam-pling. One method estimates bounds for the true performance level of a system. The other method, paired bootstrap resampling, estimates how confi-dently we can draw the conclusion from a test result that one system outperforms another.
We would now like to provide experimental evi-dence that these estimates are indeed correct at the specified level of statistical significance.
7.1 95% Statistical Significance
We carried out a large number of experiments to estimate statistical significance for system compar-isons. We compared 9 different pairs of systems, with different test set sizes. Detailed results can be found in Table 3.
The test set sizes vary from 100 sentences to 3000 sentences. As described earlier, the systems trans-late aligned test sentences from different source lan-guages into English. First, we want to answer the questions: How often can we draw conclusions with 95% statistical significance? How often are we cor-rect?
Even for small test sets of size 300 sentences (about 9000 words), we can reliably draw the right conclusion, if the true BLEU score difference is at
Significance Level Conclusions Correct
100% 1042 100%
99%-99.9% 738 100%
98%-98.9% 245 99%
95%-97.9% 394 98%
90%-94.9% 363 95%
80%-89.9% 520 88%
70%-79.9% 324 77%
60%-69.9% 253 72%
[image:7.595.76.281.76.221.2]50%-59.9% 261 52%
Table 4: Validation of the statistical significance es-timations: Number of conclusions drawn at a certain level and accuracy of the conclusions.
least 2-3%. Note that we make no general state-ments about relation of test set size and statistical significance BLEU score differences, this particular finding is specific to our test scenario and depends highly on how similar the systems are.
Only one conclusion is wrong for test sets of size 300 – the already mentioned conclusion that the Danish system outperforms the Portuguese sys-tem. For test sets with only 100 sentences, we ob-server more false conclusions, which suggests that this might be too small for a test set.
7.2 Other Significance Levels
While the 95% statistical significance level is the most commonly used for historical reasons, we want to validate as well the accuracy of the boot-strap resampling method at different statistical sig-nificance levels.
Table 4 displays our findings. For each con-clusion, we check into what statistical significance range it falls, e.g., 90-94.9%). Then, we check for all conclusions with an interval, how many are cor-rect, i.e., consistent with the conclusion drawn from the much larger 30,000 sentence test set.
The numbers suggest, that the method is fairly ac-curate and errs on the side of caution. For instance, when we conclude a statistical significance level of 90%-94.9%, we are actually drawing the right con-clusion 95% of the time.
8 Summary and Outlook
Having a trusted experimental framework is essen-tial for drawing conclusions on the effects of system changes. For instance: do not test on train, do not use the same test set repeatedly, etc. We stressed the importance of assembling test sets from differ-ent parts of a larger pool of sdiffer-entences (Figure 2 vs. Figure 3).
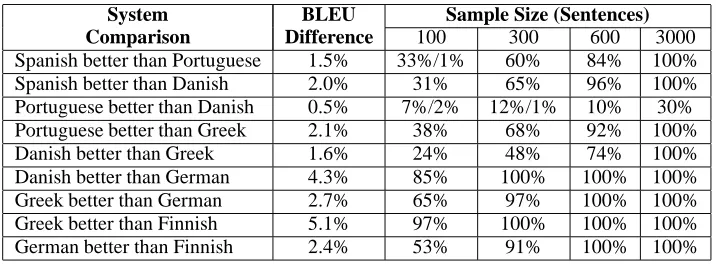
System BLEU Sample Size (Sentences)
Comparison Difference 100 300 600 3000
Spanish better than Portuguese 1.5% 33%/1% 60% 84% 100% Spanish better than Danish 2.0% 31% 65% 96% 100% Portuguese better than Danish 0.5% 7%/2% 12%/1% 10% 30% Portuguese better than Greek 2.1% 38% 68% 92% 100%
Danish better than Greek 1.6% 24% 48% 74% 100%
[image:8.595.125.483.70.202.2]Danish better than German 4.3% 85% 100% 100% 100% Greek better than German 2.7% 65% 97% 100% 100% Greek better than Finnish 5.1% 97% 100% 100% 100% German better than Finnish 2.4% 53% 91% 100% 100%
Table 3: The table displays how often a conclusion with 95% statistical significance is made for different system comparisons and different sample sizes. 12%/1% means 12% correct and 1% wrong conclusions. 30,000 test sentences are divided into 300, 100, 50, and 10 samples, each the size of 100, 300, 600, and 3000 sentences respectively.
penalty and the role of larger n-grams.
One important element of a solid experimental framework is a statistical significance test that al-lows us to judge, if a change in score that comes from a change in the system, truly reflects a change in overall translation quality.
We applied bootstrap resampling to machine translation evaluation and described methods to compute statistical significance intervals and levels for machine translation evaluation metrics. We de-scribed how to compute statistical significance in-tervals for metrics such asBLEU for small test sets, using bootstrap resampling methods. We provided empirical evidence that the computed intervals are accurate.
Aided by the proposed methods, we hope that it becomes common practice in published machine translation research to report on the statistical sig-nificance of test results.
References
Brown, P., Cocke, J., Pietra, S. A. D., Pietra, V. J. D., Je-linek, F., Lafferty, J. D., Mercer, R. L., and Rossin, P. (1990). A statistical approach to machine translation.
Computational Linguistics, 16(2):76–85.
Brown, P. F., Pietra, S. A. D., Pietra, V. J. D., and Mercer, R. L. (1993). The mathematics of statistical machine translation. Computational Linguistics, 19(2):263–
313.
Efron, B. and Tibshirani, R. J. (1994). An Introduction
to the Bootstrap. CRC Press.
Germann, U. (2003). Greedy decoding for statistical ma-chine translation in almost linear time. In Proceedings
of HLT-NAACL.
Koehn, P. (2002). Europarl: A multilingual corpus for evaluation of machine translation. Unpublished,
http://www.isi.edu/ koehn/europarl/.
Koehn, P. (2004). Pharaoh: a beam search decoder for phrase-based statistical machine translation models. In Proceedings of AMTA.
Koehn, P., Och, F. J., and Marcu, D. (2003). Statisti-cal phrase based translation. In Proceedings of
HLT-NAACL.
Kumar, S. and Byrne, W. (2004). Minimum bayes-risk decoding for statistical machine translation. In
Pro-ceedings of HLT-NAACL.
Melamed, I. D., Green, R., and Turian, J. P. (2003). Pre-cision and recall of machine translation. In
Proceed-ings of HLT-NAACL.
Och, F. J. (2002). Statistical Machine Translation: From
Single-Word Models to Alignment Templates. PhD
thesis, RWTH Aachen, Germany.
Och, F. J. (2003). Minimum error rate training for statis-tical machine translation. In Proceedings of ACL.
Papineni, K., Roukos, S., Ward, T., and Zhu, W.-J. (2002). BLEU: a method for automatic evaluation of machine translation. In Proceedings of ACL.
Press, W. H., Teukolsky, S. A., Vetterling, W. T., and Flannery, B. P. (2002). Numerical Recipes in C++. Cambridge University Press.
Tillmann, C. (2003). A projection extension algorithm for statistical machine translation. In Collins, M. and Steedman, M., editors, Proceedings of EMNLP, pages 1–8.
Vogel, S., Zhang, Y., Huang, F., Tribble, A., Venugopal, A., Zhao, B., and Waibel, A. (2003). The CMU sta-tistical machine translation system. In Proceedings of
MT Summit IX.
Zens, R., Och, F. J., and Ney, H. (2002). Phrase-based statistical machine translation. In Proceedings