The Long Term Health Effects of
Education
Vincent O Sullivan
*Abstract: Using data from The Irish Longitudinal Study on Ageing, I find that exogenous changes in the schooling of men born into lower social class families in Ireland during the late 1940s and 1950s had a statistically significant positive effect on their self-reported health in later life. I also find that the increased level of schooling had a statistically significant positive effect on physical exercise in later life as well as reducing the probability of an individual experiencing certain non-cardiovascular chronic conditions. However no statistically significant effect was found in relation to cardiovascular disease, self-rated mental health, smoking behaviour or self-reported and objectively measured memory although there is a high degree of imprecision in these estimates.
Corresponding Author: Vincent.o-sullivan@tcd.ie
Keywords: Causal Effects of Education, Self-Reported Health, Older People
* The Irish Longitudinal Study on Ageing, Trinity College Dublin,
With thanks to Jim Cooke, Professor John Coolahan and Sister Eileeen Randles for sharing their knowledge of the Irish education system. With thanks to participants at the TILDA Internal Seminar, TCD Economics Seminar, Richard Layte, Irene Mosca, George Savva and Alan Barrett for their helpful suggestions and comments.
ESRI working papers represent un-refereed work-in-progress by researchers who are solely responsible for the content and any views expressed therein. Any comments on these papers will be welcome and should be sent to the author(s) by email. Papers may be downloaded for personal use only.
The Long Term Health Effects of Education
1. Introduction
In this paper, I investigate the causal relationship between education and different aspects of health capital and health behaviours. The positive relationship between educational attainment and various different outcomes in later life across the health, economic and social domains has been well documented. However it is more difficult to ascertain whether or not there is a causal effect of education or if some other variable or mechanism is at work. My strategy to identify any causal effects of education on outcomes in later life is to exploit the sudden increase in the educational opportunities available to those born into poorer families in Ireland.
There has been much debate on whether there is a causal effect between education and health capital. If such an effect exists, it may be through productive efficiency (Grossman, 1972) i.e. more educated people could be more efficient producers of health – or allocative efficiency where education increases the ability to process and use medical information (Michael, 1972). Education thus leads to a better input-mix as it increases the willingness and ability of individuals to change their preventive health behaviour (Kenkel, 1991), seek out advice and information, and awareness of health technology improvement (Lleras-Muney & Lichtenberg, 2010).
However the relationship between education and health may be spurious. First, more educated people face a more favourable budget constraint either directly through increased earnings or indirectly through assortative mating. Hence, education may simply proxy for an income effect. Furthermore the opportunity costs of bad health are higher for more educated individuals. Fuchs (1982) argues that since both education and health can be seen as component of the individual’s capital, they both depend on the individual’s characteristics. For example an individual with a high discount rate will invest less in his education and his own health. However, one could argue that education has a positive feedback on one’s discount rate, so that the relationship between education and health may, to some degree, still be causal (Becker & Mulligan, 1997).
An extensive review of the literature on education and health is available in Grossman (2006) and supports the view that the effect of education on health is causal. Contrary to the omitted variable hypothesis, IV estimates are in general larger than estimates which assume the exogeneity of education. However, as in the literature on the financial returns to education, the IV estimates can be seen as local average treatment effects for the marginal individuals affected by the instrument. A series of papers have used changes in minimum school leaving age laws a source of exogenous variation in schooling to estimate causal effects of education. Glymour, Kawachi, Jencks & Berkman (2006) exploited variation in state level school leaving age laws and found that education had some effects on memory in later life. Lleras-Muney (2005) used variation in school leaving age laws and child labour laws and found that education reduced mortality. Using American, Canadian and British data, Oreopolous (2007) found positive effects of education on self-rated health and reduced disability. Kempter, Juerges and Reinhold (2011) using variation in German school leaving age laws found that education reduced reports of long term illness amongst men.
British data. Albouy and Lequien (2009) also find no effect of education on mortality when using changes in French school leaving age laws as a source of variation.
The rest of the paper proceeds as follows: section two is a description of the data that was used in the analysis, section three is a description of how educational policy changes in Ireland in the 1960s had effects on attainment of certain groups; section four contains the results and the robustness checks and section five discusses the results.
2. Description of Data
In this paper, I use data from The Irish Longitudinal Study on Ageing (TILDA). TILDA is a new, large, nationally representative sample of people aged fifty and above (and their spouses or partners of any age) resident in Ireland. The TILDA dataset contains detailed information on all aspects of the respondents’ lives such as economic circumstances (e.g. pensions, employment and living standards), health (e.g. physical, cognitive function, mental, service needs and usage) and social engagement (e.g. contact with friends and kin, formal and informal care and participation in society).
Measure of Educational Attainment:
In this paper the level of education attained is measured using a binary variable indicating whether the person had obtained at least an Intermediate/Group Certificate indicating that they had at least attended some post-primary schooling1. The Group/Intermediate Certificate was a post-primary school qualification taken at age fifteen or sixteen in Irish schools and equivalent to the UK’s GCSE. The overall trends in educational attainment in Ireland are discussed in the next section.
For comparability with the rest of the literature, it would have been useful to have had a measure of years of schooling. Unfortunately this was not directly asked of the respondents. The entire analysis was repeated using age left education as imputed from the qualifications variable. However there is likely to be noise in this age left education variable as it does not take into account whether people have returned to education in later life and sat further qualifications. Even for those whose education was continuous, there was likely to be heterogeneity in the age that qualifications were sat as there was not a great degree of uniformity in age to enter and leave primary school (e.g. many primary schools offered an additional year or in some cases two years of schooling). Furthermore people who dropped out of education before having completed a qualification that they had studied for will be miscoded under this imputation scheme. The results where an imputed age left education was used, are available on request. The F-statistic of the instruments in the years of education equation is 4.73, which falls into the category of a weak instrument. However the overall pattern of results when using this imputed age left education are similar but much less precisely estimated.
Outcome Variables
The first outcome of interest is self-rated health. Respondents are asked to rate their health on a scale 1 to 5 (5 being excellent, 4 is good, 3 is average, 2 is fair and 1 is poor). A binary outcome of poor/fair versus other categories was created. This is a commonly used outcome in the literature (e.g. Jurges (2009), etc.). However it is not without its problems, Bound (1991) pointed out that self-rated health
1 People who began post-primary schooling but dropped out before sitting these exams will be incorrectly
amongst older people in particular is endogenous to economic status, the so-called “justification hypotheses”, while Jurges (2008) pointed out that variables such as age and socio-economic group can affect subsequent mortality even when controlling for self-rated health. Kapteyn, van Soest and Smith (2007) advocated “anchoring vignettes” to control for different levels of subjective “toughness” with respect to self-rated health. Also included in the analyses carried out in this paper is a binary outcome indicating fair/poor self-rated health relative to people of a similar age. This produced very similar results to the previous poor/fair self-rated health variable.
In order to be more specific as to which areas of health are affected by education, a series of binary variables relating to certain areas of health were also analysed. Firstly, a variable was created which indicated that the respondent believes that they have poor/fair emotional or mental health. Also included as an outcome is a variable indicating the presence of cardiovascular disease – this is where a doctor has told the respondent they have or have had angina, a heart attack, heart failure, transient ischaemic attacks, diabetes or a stroke. Additionally, a variable indicating a history of non-cardiovascular chronic conditions was created. The conditions covered by this are: cancer, arthritis, osteoporosis, hip fracture and/or wrist fracture, and lung disease. To measure sensory impairment a variable indicating poor/fair self-rated hearing and/or vision problems was also created.
The level of physical activity carried out by the respondent is measured using the International Physical Activity Questionnaire (Craig et al 2004) which is a standardised measure of habitual practice of physical activity from walking to moderate and vigorous exercise. Our outcome variable is binary denoting moderate/high exercise levels versus low exercise levels. Smoking behaviour is measured by a binary variable indicating whether the person currently smokes.
Fair/poor self-rated memory was also analysed. Furthermore an objective test of immediate recall was also analysed. The score is the number of words from a ten word list that respondents recall immediately after hearing them read out by the interviewer.
Other Controls
I control for social class (SC) during childhood. Throughout this paper the definition of social class is based on the respondent’s description of their father’s main occupation when the respondent was fourteen years old. High social class is defined in this paper as being where the father worked in a professional, managerial, technical or non-manual occupation. Low social class is defined as being where the person’s father never worked outside the home, was a manual worker (skilled, semi-skilled and unskilled), was a farmer or was an agricultural worker. I also control for self-reported poor health during childhood and whether the individual grew up in the countryside because these variables may directly affect current self-reported health and other outcomes. Year of birth was included in the model linearly.
Sample Selection
There were over 8500 observations in the dataset however this analysis was carried out on those born from 1945 and after. Firstly, I wished to avoid picking up differential trends in mortality. By restricting my sample to those aged 50-65, I should hopefully reduce this risk as much as possible – life expectancy was 76.8 years for males in the 2006 Irish Census. Secondly, although Ireland was neutral during the Second World War, I did not want to include people whose early childhood may have been affected by the war in some way.
difference in trends between females from rich and poor families is not as stark as it is for males. Girls from lower social class families had higher levels of educational attainment than boys from similar families. This perhaps reflects the lack of opportunity for young girls to find work in their early teens. In addition to this restriction I do not include those aged less than fifty as an appropriate survey weight for them could not be constructed. Furthermore a small number of observations were dropped where the individual had come to Ireland in their teenage years and whose decisions about schooling may have taken place in another country (most usually the United Kingdom).
The sample that I have used in the analysis is further reduced due to missing data on a small number of observations. This missing data problem is mostly due to the outcome of interest not being available although another common cause of missing-ness was not having enough information to classify individuals by social class background when growing up due to lack of information about their parents’ occupation.
Table 1 shows the characteristics of the all of the respondents in the study (i.e. representative of all those aged fifty and over in Ireland) and the sample used in the analysis (i.e. representative of those born 1950-1960) and those where information is missing. As the entire TILDA sample includes a group of much older people, we see that educational attainment was lower and that levels of exercise are lower. We also see that reports of cardiovascular disease, non-cardiovascular disease are higher but that all other variables have similar values.
In Table 1, there is also a breakdown of characteristics by social class of the observations in the final sample. Higher social class people are much less likely to have come from a rural background as lower social class groups include significant numbers of farmers and agricultural labourers (over a third of the total number in lower social classes). Educational attainment is significantly higher in the high social class group than for lower social classes. This will be discussed below in some detail. Self-rated health and level of exercise are better for those from higher social class backgrounds. There are significantly fewer smokers amongst those from higher social class backgrounds. Those from higher social classes had better subjective and objectively measured memory. However there are no significant differences in levels of self-rated mental health, cardiovascular disease and non-cardiovascular chronic conditions.
3. Educational Changes in Ireland as a Natural Experiment
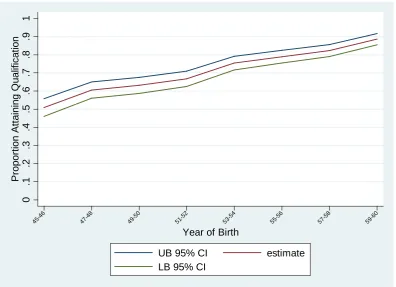
There was a rapid improvement of the educational attainment of young people from low social class groups relative to those from high social class groups during the 1960s in Ireland. The empirical strategy of this paper to use this striking differential in trends between high and low social class people to identify the causal effects of education. A detailed history of this period in Irish history can be found in Randles (1975), Collahan (1981) & Cooke (2009). Figure 1a and Figure 1b shows the proportion of the TILDA sample attaining at least an Intermediate/Group Certificate (mid-secondary school qualification taken at 15/16 and equivalent to UK’s GCSE) by year of birth. Amongst those whose father was in lower social class groups, there is an upward change in the trend of educational attainment for those born in the late 1940s and after. For those born in 1945/1946 about half attained a Group/Inter Cert. This rose to just under 90% amongst those born in 1959/1960. Figure 1b shows that amongst those from high social class groups that nearly all people born from 1945-1960 attained at least a Group/Intermediate Certificate.
government policy in general was failing and had been for many years. The 1950s had been a difficult decade for Ireland. The population fell by 7% from the 1946 census to the 1961 census due to emigration. Economic growth averaged just 2% during the 1950s compared to a western European average of around 4-5%.
In terms of social policy, governments prior to the 1960s had been hesitant in interfering in the provision of public services such as health and education. An attempt to introduce free healthcare to those under the age of sixteen years and free maternity care in 1951, the “Mother and Child Scheme”, had met with opposition from the Catholic Hierarchy and the medical profession and resulted in the resignation of the then Minister for Health.
Similarly in the sphere of education, government was reluctant to get involved directly and did not take a lead in policy. In a speech made in 1956 the then Minister for Education, General Richard Mulcahy, described how he saw his role:
“you have your teachers, your managers [of schools] and your churches, and I regard the position of Minister in the Department as that of a kind of dungaree man, the plumber who will make satisfactory communications and streamline the forces and potentialities of the educational workers and educational management in this country. He will knock out the pipes and will link up everything. I would be blind to my responsibility if I insisted on pontificating.2”
Before the 1960s, many students left the education system at a very young age with few qualifications. The 1966 Investment in Education report (OECD, 1966) outlined (approximately) the subsequent educational attainment of the c. 52,000 primary school leavers in 1958. About 35% of these left full-time education completely at the age of around 13/14. Just under 30% would enter the vocational schools, which were free (or charged nominal fees) where the emphasis was on practical subjects (although academic subjects were also covered but to a lesser extent). Around half of those students entering vocational schools would complete the Group Certificate Examination two years later. The Group Certificate was a terminal exam and certificate holders could not sit the academic-track Leaving Certificate needed for entry to many civil service jobs and to university.
The remaining 35% of the 1958 primary school leavers (c.20,000 students) would enter the academic-track Secondary Schools, which were fee-paying. Of these 20,000 students, 4000 of these would drop out before age 15/16 without completing a qualification, 6000 would leave having completed the academic-track Intermediate Certificate at around age 15/16 and 8000 would leave education on completion of the Leaving Certificate (equivalent to A Levels or High School Diploma) at age 17/18. Just 2000 would enter university.
A turning point in the country’s fortunes came in 1958 with the publication of The First Programme for Economic Expansion (Department of Finance, 1958). This influential policy paper, written by one of the country’s most senior civil servants, TK Whitaker, advocated a move from protectionism and self-sufficiency to one of actively seeking international investment and opening up the country to international trade. In relation to education, Whitaker’s paper advocated the expansion of and investment in the education system, particularly the vocational education system as a means of driving the development of the country.
2 Dail Reports. Vol. 159, Col. 1494. July, 1956. Available at:
Taking their cue from Whitaker and engaging with international bodies such as the OECD, the next successive Ministers for Education would introduce a series of policies that would greatly increase the educational opportunities available in Ireland particularly for those from less well off families.
These reforms focused initially on the vocational sector as that sector had been specifically identified by Whitaker as a means of supplying skilled labour for industry but also because the Vocational Schools, which did not charge fees, was run by national and local government and was therefore amenable to government policy changes where as the academic-track, fee-paying, Secondary Schools were private institutions run largely by different Church organisations (mostly Catholic with a small Protestant minority) with minimal state involvement. Thus the reforms of the early 1960s would affect those from less well off families rather than the better off. These reforms are discussed in chronological order below and are also described in Table 1.
Apprenticeship Act (1959)
This act established a governmental body, An Cheard Comhairle, to regulate apprenticeship training in Ireland. Prior to this act, apprenticeship training in Ireland was organised on an ad hoc basis. The standard of training provided, the level of pay and quality of work conditions were purely at the discretion of the employer. Having examined apprenticeship systems in other countries, An Cheard Comhairle implemented a number of policy recommendations. One of these was that all new apprentices should have at least completed the Group Certificate3. This recommendation came into force in September 1963. Figure 2 shows that there was a rapid increase in the number of apprentices from the early 1960s onwards. Under the regulations, these new apprenticeships who were at least 16 years old had to have at least Group Certificate education. Thus the first cohorts to have been affected by the expanded system and new regulations were born around 1947 onwards.
Local Authorities Education Scholarships Amendment Act (1961)
The Local Authorities Education Scholarships Amendment Act (1961) was a piece of legislation which greatly increased the number of scholarships available for less well-off students who wanted to attend secondary school. Prior to 1967, secondary schooling (academic-track) was not free. According to the Investment in Education Report of 1965 the average fee for non-boarding schools was £16 per year. According to the Irish Statistical Bulletin (1965) average industrial weekly earnings were about IR£9 per week. Thus tuition costs were high for poorer families relative to income even before other direct costs and before opportunity costs were taken into account.
Prior to 1961 there were some scholarships available for prospective secondary school students. These scholarships had been established in 1944 but no piece of legislation altering the original system was enacted until 1961. Prior to 1961 the number of scholarships awarded was low despite increasing numbers sitting the scholarships exams throughout the late 1950s. Prior to 1961 the funding for these scholarships came solely from local government rather than national government. The 1961 Act changed this by introducing a 5:4 ratio with respect to national government contributions to the scholarship fund relative to local government contributions. Under the new system, scholarships were awarded mostly on academic merit and financial need although around a
3 Aspiring apprentices could also have an Intermediate Certificate which was taken at the fee paying
quarter were awarded on academic merit alone. The result was that the number of scholarships awarded to secondary schools rose from about 500-600 per year to around 1800 from 1961 to 1962 and rising until 1967. This change in policy affected those entering secondary school who were born around 1948 to 1949 and after (see Figure 3). The scholarship scheme was phased out following the introduction of free second level schooling in 1967.
1962 Vocational Education (Amendment) Act
1962 Vocation Education (Amendment) Act increased the funding available to vocational education by raising the amount of maximum allowable spending on vocational education spending by local government from 15-18 pence in the pound (there were 240 pence in a pound) of local tax receipts to a maximum of 24 pence. The old rates had been set in 1954. Figure 4 shows that real spending on Vocational Schools had been increasing by 5-10% year-on-year through the 1950s but rose by 14% in 1962 and by over 20% in 1964. Although spending on Secondary Schooling was rising equally rapidly in the 1960s, secondary schooling, as opposed to vocational schooling, was less accessible to poorer young people as Secondary Schools were still fee-paying until 1967.
1967 Free Education Scheme
In September 1966, the Minister for Education, Donogh O’ Malley, unexpectedly announced that all post-primary schooling would become free in the following academic year4. Such an announcement had not been expected to take place at that time as there was a general expectation that the raising of the minimum school leaving age to 15 (and with it the access to school facilities) would not come until at least 1970. The Minister’s announcement applied to all students and not just to those leaving primary school in the summer of 1967.
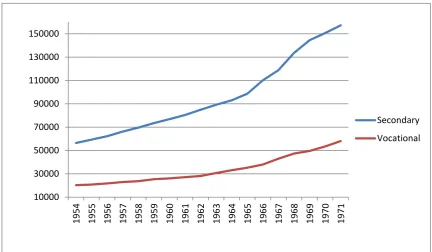
Using the TILDA data alone it is not possible to detect whether there was shift from vocational schools (which had either been free or charging a nominal fee) to secondary schools (which had been charging fees). From an examination of the aggregate numbers from Department of Education annual reports, we can see from Figure 6 that the numbers attending both types of school increased although the rate of increase in vocation schools remained roughly the same as before the introduction of free post-primary schooling where as there is an increased rate of change in the secondary sector.
In addition to the free-fee scheme, students entering vocational schools after 1966 could sit the academic-track Intermediate Certificate rather than the Group Certificate. This change opened up the possibility of sitting the Leaving Certificate at age 18. The Leaving Certificate was required for many civil service jobs and for entry to university. Although attending university as a full-time student was most probably not financially possible for the socioeconomic groups who attended vocational schools, having a leaving certificate would allow students to attend university on a part-time basis in future years. Post 1966, whilst many students in Vocational Schools continued to sit the Group Certificate, it became less popular in the next few years. Using the TILDA data alone it is not possible to detect whether there was a shift from the Group cert to the Intermediate Cert as no distinction was made in the categories offered to respondents. However an analysis of the official aggregate numbers sitting the separate examinations suggests that this was the case. Figure 5 shows that the numbers sitting
4 Schools were given the choice of opting in or out of the scheme. A small minority of Secondary
the group cert in vocational schools peaks in 1967 and then declines thereafter. The numbers sitting the Intermediate Certificate (academic-track) in secondary schools, all of which were fee-paying prior to 1967, increases gradually in the 1950s and the early and mid 1960s but then increases sharply in 1968 and 1969.
Thus for poorer students entering post-primary schooling in 1967, an education leading to either an apprenticeship or to opportunities to enter the civil service and non-manual careers was now freely available. For those poorer students already in the post-primary system by 1967, their remaining years of education would now be free.
4. Results
In this section I model the effects of education on different outcomes in later life when treating education as exogenous and as endogenous. The outcomes of interest are self rated health, self-rated health relative to own age group, self-rated mental health, history of cardiovascular disease, history of non-cardiovascular chronic conditions, self-rated sensory problems, currently smoking, frequent exercise, self-rated memory and objectively measured immediate recall.
When assuming that education is exogenous, I estimate the following model:
1) Outcomei= π0 + π1Child Health Poori + π2Year of Birthi + π3Grew up in Low SC Familyi + π4Grew up in
Countrysidei + π5Educationi + εi
Where the outcome is binary, the model is a Linear Probability Model (LPM). I have also modelled the binary outcomes as probit models. The estimated marginal effects were broadly similar to those of the LPM.
The estimated results are shown in Table 3a and Table 3b. Post-primary education reduces the probability of having fair/poor self-rated health by just under sixteen percentage points. A smaller estimate of around minus eleven percentage points was found in relation to self-rated health relative to people of a similar age. In turn, the effect of education on self-rated mental health was to reduce to the probability of fair/poor mental health by about six percentage points. The effect of education on cardiovascular disease and on non-cardiovascular chronic conditions were very similar in that education reduced the probability of these occurring by around four percentage points.
In Table 3b we find that education reduced the probability of self-report sensory problems by ten percentage points. Education reduces the probability of smoking by about thirteen percentage points and increases the probability of frequent exercise by eight percentage points. In relation to memory, education reduces fair/poor self-rated memory by about six percentage points and increase the number of words recalled in the immediate recall test by 0.75 of a word on average.
When modelling the endogeneity of education, I treat the system as two linear probability models: 2) Outcomei= α0 + α1Child Health Poori + α2Year of Birthi + α3Grew up in Low SC familyi + α4Grew up in
Country Sidei + α5Educationi + εi
3) Educationi = β0 +β1Child Health Poori + β2Year of Birthi +β3Grew up in Low SC familyi + β4Grew up in
Country Sidei + β5Year of Birthi*Grew up in Low SC Familyi +µi
First Stage Results
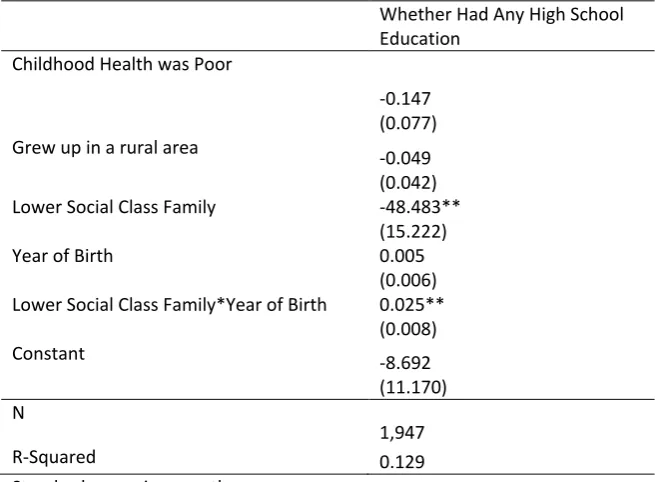
The estimates of the effects of the education policies on the probability of attaining some post-primary school qualification are shown in Table 4. The coefficients are of the, a priori, expected direction. If childhood health was poor and if the person grew up in a lower social class family the probability of attaining at least a Group/Inter Cert is reduced. Growing up in a rural area reduces the probability of attaining at least some post-primary schooling. This could have been due to an under-supply of schools in rural areas or a need for young people to work on family farms from a young age. Year of birth is not significant but the interaction of growing up in a lower social class family and year of birth is positive and significant. This reflects the increase in attainment of those from less well-off families as a result of the series of policies introduced in the 1960s. Crucially for the relevance of the instrument, the F-statistic on the estimated coefficient is 10.18. Thus the instrument is just above the often cited thresholds for weak instruments of 10 (see Bound, Jaegar and Baker, 1995) and thus our strategy avoids the biases that can occur with weak instruments.
Second Stage Results
The lower part of Table 3a and Table 3b shows the second stage estimates of the effect of post-primary education on the different outcomes. There is a large, statistically significant effect on rated health. Having at least post-primary schooling reduces the probability of having poor/fair self-rated health by over forty percentage points. A similar estimate is found in relation to self-self-rated health relative to own age group. An estimate of around 0.57 is found in relation to non-cardiovascular chronic conditions. When looking at the different non-non-cardiovascular conditions separately (results available on request) it is found that this result is largely been driving by the protective effect in relation to arthritis.
An even larger effect, over sixty percentage points, is found concerning the effect of post-primary education on the probability of exercising. This is surprising as there is no statistically significant effect of education on cardiovascular disease. This may be because that although the IV estimate of the effect of education on cardiovascular disease is over two times the size of the OLS estimate, the corresponding standard error is extremely large.
The effects on smoking and having self-reported sensory problems are unexpectedly positive although not statistically significant. There are no statistically significant effects of education on self-reported mental health or on memory. With respect to the latter, the absence of evidence of a statistically significant effect is in contrast to Banks and Mazzonna (2011) who found large effects on males’ memory of the 1947 raising of the school leaving age in the UK. The results can be reconciled when one considers that the IV estimate of the effect of education on self-rated memory is much larger than the OLS estimate but that the estimate is very imprecisely estimated given that the IV standard errors are over eight times larger than the OLS estimates. With respect to the lack of statistically significant effect of education on immediate word recall, although the OLS estimate is larger than the IV estimate, one cannot reject that they are the same. The IV estimate is very imprecisely estimated as the standard error is very large. Therefore, looking at the effect of education on memory, it is very difficult to rule out an effect given the results in the analyses.
Furthermore the large effects could reflect that the estimates are a local average treatment effect (see Imbens & Angrist, 1994) that estimate the effect of post-secondary education on those whose behaviour was altered by the exogenous shifts in policy and that this group had much to gain from even some post-secondary education.
One might suggest that the estimated effects of education on health outcomes in this paper are spurious because they are being driven by some event or effect other than the sudden increase in the schooling of people born into less well-off families relative to those from better-off families. It is therefore important to rule out any changes in access to healthcare or the quality of healthcare available that directly improved the health of those from less well-off families relative to those from better-off families.
The major improvements in the healthcare of those from less well-off backgrounds in Ireland came with the creation of the Ministry of Health in 1947 and with that, a series of public health schemes that were rapidly implemented. For example, Ireland’s tuberculosis problem, the worst in western Europe, was brought under control in just a few years. The very oldest in the sample analysed in this paper spent a short time of their childhood in the period prior to the creation of the Ministry of Health. To allow for this, the models estimated control for self-reported poor health during childhood. Furthermore, Ireland never opted for a universal healthcare system, instead a two-tier system emerged in the 1950s which discriminated between public and private patients. Indeed, Wren (2001) argues that the private health care system has advanced at the expense of the public system since the 1960s due to the arrival of private hospitals and the incentive structures for the payment of hospital consultants and general practitioners. The cohorts used in this study have lived the vast majority of their lives under this two-tier healthcare system and it is therefore difficult to argue that the healthcare available to those from less well-off backgrounds relative to those from better-off backgrounds has been improving over life time of those included in the sample.
5. Conclusion
Higher levels of education is known to be correlated with higher income, lower crime, political and civic participation and health. In relation to health outcomes, the evidence of a causal effect of education on health is mixed even when looking at data from the same countries and using similar strategies.
References
Angrist, J., & J-S. Pischke. 2009. Mostly Harmless Econometics. An Empiricist’s. Princeton: Princeton University Press.
Albouy V. & L. Lequien. 2009. “Does Compulsory Education Lower Mortality?” Journal of Health Economics, 28, 155–168.
Banks, J., & F. Mazzona. 2011. "The Effect of Childhood Education on Old Age Cognitive Abilities: Evidence from a Regression Discontinuity Design."Institute for Fiscal Studies Working Paper 04/11.
Becker, G.S., & C.B. Mulligan. 1997. "The Endogenous Determination of Time Preference," The Quarterly Journal of Economics, MIT Press, vol. 112(3), pages 729-58, August.
Bound, J. 1991. "Self-Reported Versus Objective Measures of Health in Retirement." The Journal of Human Resources, Vol. 26, No. 1, pp. 106-138.
Bound J., D.A. Jaeger, & R. Baker. 1995. “Problems with Instrumental Variables Estimation When the Correlation between the Instruments and the Endogenous Explanatory Variable Is Weak.” Journal of the American Statistical Association, 90(430):443–50.
Clark, D., & H. Royer. 2010. “The Effect of Education on Adult Health and Mortality: Evidence from Britain.” NBER Working Paper No. w1601.
Cooke, J. 2009. A History of the Irish Vocational Education Association, 1902-2002. Nass, Kildare, Republic of Ireland: Vocational Teachers Assocation.
Coolahan, J. 1981. Irish Education: Its History and Structure. Dublin: Institute for Public Administration.
Craig C.L., A.L. Marshall, M. Sjostrom, A.E. Baumen, M.L. Booth, B.E. Ainsworth et al. 2003. "International Physical Activity Questionnaire: 12-Country Reliability and Validity." Med Sci Sports Exerc., 35(8):1381-95.
Department of Finance. 1958. Economic Development. Dublin: The Stationary Office.
Fuchs, V.R. 1982. “Time Preference and Health: An Exploratory Study”, in: Economic Aspects of Health, V.R. Fuchs, 93-120. Chicago: University of Chicago Press for the National Bureau of Economic Research.
Glymour, M.M., I. Kawachi, C.S. Jencks, & L.F. Berkman. 2008. “Does Childhood Schooling Affect Old Age Memory or Mental Status? Using State Schooling Laws as Natural Experiments."Journal of Epidemiology and Community Health, 62 (6): 532-537.
Grossman, M. 1972. “On the Concept of Health Capital and the Demand for Health.” Journal of Political Economy, 80:223-255.
Grossman, M. 2006. "Education and Nonmarket Outcomes," In Handbook of the Economics of Education, ed. E. Hanushek & F. Welch, pages 577-633, North Holland.
Imbens, G., & J. Angrist. 1994. “Identification and Estimation of Local Average Treatment Effects.” Econometrica, Vol. 61, No. 2, 467-476.
Jurges, H., E. Kruk & S. Reinhold. 2009. “The Effect of Complusory Schooling on Health: Evidence from Biomarkers.” Mannheim Research Institute for Ageing.
Jurges, H. 2008. "Self Assessed Health, Reference Levels and Mortality." Applied Economics, 40:5. Kapteyn, A., J.P. Smith & A. van Soest. 2007. “Vignettes and Self-Reports of Work Disability in the
United States and the Netherlands.” American Economic Review, 97. No 1.
Kempter, D., H. Juerges & S. Reinhold. 2011. "Changes in Compulsory Schooling and the Causal Effect of Education on Health: Evidence from Germany." Journal of Health Economics, 30(2), 340-354. Kenkel, D.S. 1991. "Health Behavior, Health Knowledge, and Schooling." Journal of Political Economy,
vol. 99(2), pages 287-305, April.
Lleras-Muney, A., & F.R. Lichtenberg. 2010. "Are the More Educated More Likely to Use New Drugs?" In Contributions in Memory of Zvi Griliches, ed. Jacques Mairesse and Manuel Trajtenberg, pages 671-696. Cambridge Massachusetts: National Bureau of Economic Research Inc.
Lleras-Muney, A. 2005. "The Relationship Between Education and Adult Mortality in the United States." Review of Economic Studies, Volume 72, Issue 1, pages 189–221.
Oreopolous, Philip. 2007. "Do Dropouts Drop Out Too Soon? Wealth, Health and Happiness from Compulsory Schooling." Journal of Public Economics, Volume 91, Issues 11-12, pages 2213-2229.
Organisation for Economic Cooperation and Development. 1966. Investment in Education, Report of the Survey Team Appointed by the Minister for Education in October 1962. Dublin: The Stationary Office.
Randles, E. 1975. Post-Primary Education in Ireland 1957-1970. Dublin: Veritas Publications.
Wooldridge, J. 2002. Economics Analysis of Cross Section and Panel Data. Cambridge, Massachusetts: The MIT Press.
Wren, M. 2001. Unhealthy State: Anatomy of a Sick Society. Dublin, Ireland: New Island.
[image:13.595.96.493.317.604.2]Figures
Figure 1a: Proportion of TILDA sample attaining at least a Group/Intermediate Certificate by year or birth – Lower Social Class Groups
0
.1
.2
.3
.4
.5
.6
.7
.8
.9
1
P
ropor
tion A
tt
aining Q
ualif
ic
at
ion
45-46
47-48
49-50
51-52
53-54
55-56
57-58
59-60
Year of Birth
UB 95% CI estimate
Figure 1b: Proportion of TILDA sample attaining at least a Group/Intermediate Certificate by year or birth – Higher Social Class Groups
Figure 2: Number of apprentices in Ireland
0
.1
.2
.3
.4
.5
.6
.7
.8
.9
1
P
ropor
tion A
tt
aining Q
ualif
ic
at
ion
45-46
47-48
49-50
51-52
53-54
55-56
57-58
59-60
Year of Birth
UB 95% CI estimate
LB 95% CI
[image:14.595.91.483.420.642.2]Figure 3: Number of scholarships awarded to students to study at Secondary School
Figure 4: Annual real spending (2010 prices) on Vocational Schools (Current not capital expenditure) 0
500 1000 1500 2000 2500
1954 1955 1956 1957 1958 1959 1960 1961 1962 1963 1964 1965 1966 1967
[image:15.595.89.401.350.601.2]Figure 5: Numbers sitting Intermediate and Group Certificate
Figure 6: Numbers attending Secondary and Vocational Schools 0
5000 10000 15000 20000 25000 30000 35000 40000
1954 1955 1956 1957 1958 1959 1960 1961 1962 1963 1964 1965 1966 1967 1968 1969 1970 1971
Group Cert Inter Cert
10000 30000 50000 70000 90000 110000 130000 150000
1954 1955 1956 1957 1958 1959 1960 1961 1962 1963 1964 1965 1966 1967 1968 1969 1970 1971
[image:16.595.89.522.346.598.2]Tables
Table 1: Different Reforms and Legislation and Earliest Cohort Affected by reform
Reform Group Affected
Apprenticeship Act (1959)
Comes into affect in 1963 Those entering apprenticeships in autumn 1963 required to have an Intermediate/Group Certificate. Cohorts affected born 1947 and after. Local Authorities Education Scholarships
Amendment Act (1961). Provided increased number of scholarships to Primary School School Leavers of 1962 and after. Group affected most likely born 1949 and after. Vocational Education Act (1962) Increased public spending on vocational
schooling. Students affected were entrants to Vocation School in 1963 and after most likely born 1950 and after.
[image:17.595.44.550.375.732.2]1967 Free Post Primary Schooling Introduced Primary School leavers of 1967 most likely born in 1954 and after. Reform was retrospective so groups born before 1954 may have also been affected.
Table 2: Descriptive Statistics
Full TILDA
Sample* Sample Final High Social Class Final Sample Low Social Class Final Sample Child Health was Poor 0.06 (0.01) 0.05 (0.01) 0.06 (0.02) 0.05 (0.01) Grew up in Rural Area 0.60 (0.04) 0.61 (0.05) 0.32 (0.01) 0.67 (0.03)
Lower Social Class 0.79 (0.05) 0.82 (0.07)
Year of Birth 1945.77 (3.23) 1952.60 (0.65) 1952.73 (0.40) 1952.57 (0.75) At Least Some Post-Primary
School 0.67 (0.18) 0.75 (0.23) 0.94 (0.07) 0.71 (0.26)
Fair/Poor Self-Rated Health 0.24 (0.03) 0.21 (0.04) 0.14 (0.03) 0.22 (0.04) Fair/Poor Self-Rated Health
Relative to Age Group 0.15 (0.01) 0.15 (0.03) 0.11 (0.02) 0.17 (0.07) Fair/Poor Self Rated
Emotional/Mental Health 0.10 (0.01) 0.09 (0.01) 0.09 (0.02) 0.09 (0.01) Cardiovascular disease (1)
0.17 (0.03) 0.13 (0.01) 0.13 (0.01) 0.13 (0.01)
Non-Cardiovascular chronic
(2) 0.46 (0.03) 0.33 (0.02) 0.31 (0.01) 0.33 (0.02)
Fair/Poor Self-Rated Vision
or Hearing 0.20 (0.02) 0.21 (0.03) 0.15 (0.01) 0.22 (0.03)
Smoker 0.18 (0.02) 0.20 (0.03) 0.14 (0.04) 0.21 (0.03)
Exercise Frequently 0.26 (0.03) 0.43 (0.03) 0.48 (0.06) 0.42 (0.03)
Fair/Poor Self-Rated
Memory 0.10 (0.01) 0.08 (0.02) 0.04 (0.01) 0.09 (0.02)
Number of Words Recalled
in Immediate Recall test 5.75 (0.19) 5.95 (0.25) 6.42 (0.25) 5.84 (0.23)
N 3782 1947 359 1588
Standard Errors in Parenthesis
Table 3a: Effect of post-primary education on certain outcomes Fair/Poor Self-rated Health Fair/Poor Self-rated Health Relative to Age Group Fair/Poor Self Rated Emotional /Mental Health Cardio-vascular disease (1) Non cardio-vascular chronic (2)
Education Treated as Exogenous
Effect of Post-Primary
Education -0.158 -0.113 -0.062 -0.037 -0.044
(SE) (0.023) (0.011) (0.012) (0.002) (0.025)
*** *** *** ***
Education treated as Endogenous
Effect of Post-Primary
Education -0.408 -0.437 -0.291 -0.089 -0.569
(SE) (0.179) (0.112) (0.239) (0.217) (0.211)
** *** **
n=1947
*** p<0.01, ** p<0.05, * p<0.1 Standard errors in parentheses
Second Stage Controls: Year of Birth, Came from Low social class family, Poor Childhood Health, Grew Up in the Urban Area
Doctor has told respondent they have angina, had a heart attack, had heart failure, transient ischaemic attacks, diabetes or a stroke
Doctor has told respondent they have cancer, arthritics, osteoporosis, hip fracture, wrist fracture, lung disease
Table 3b: Effect of post-primary education on certain outcomes Fair/Poor
Self-rated Vision or Hearing
Smoker Exercise
Frequently Fair/Poor Self-rated Memory Number of Words Recalled in Immediate Recall test Education Treated as
Exogenous
Effect of Post-Primary
Education -0.100 -0.133 0.080 -0.061 0.750
(SE) (0.017) (0.028) (0.016) (0.013) (0.175)
*** *** *** *** ***
Education treated as Endogenous
Effect of Post-Primary
Education 0.042 0.127 0.638 -0.153 0.434
(SE) (0.090) (0.081) (0.130) (0.112) (0.711)
*** n=1947
*** p<0.01, ** p<0.05, * p<0.1 Standard errors in parentheses
[image:18.595.86.519.489.734.2]Table 4: Linear Probability model of educational attainment
Whether Had Any High School Education
Childhood Health was Poor
-0.147 (0.077)
Grew up in a rural area -0.049
(0.042) Lower Social Class Family -48.483**
(15.222)
Year of Birth 0.005
(0.006) Lower Social Class Family*Year of Birth 0.025**
(0.008)
Constant -8.692
(11.170) N
1,947
R-Squared 0.129
Year Number Title/Author(s) ESRI Authors/Co-authors Italicised
2012
428 Should Coal Replace Coal? Options for the Irish Electricity Market Seán Diffney, Laura Malaguzzi Valeria and Darragh Walsh
427 Competition Policy in Ireland: A Good Recession? Paul K. Gorecki
426 Socioeconomic Distribution of Emissions and Resource Use in Ireland
Seán Lyons, Anne Pentecost and Richard S.J. Tol
425 Behavioural Economics and Policymaking: Learning from the Early Adopters
Pete Lunn
424 The ESRI Energy Model
Valeria Di Cosmo, Marie Hyland
423 The Impact of Climate on Tourist Destination Choice Richard S.J. Tol and Sharon Walsh
422 Trends in Air Pollution in Ireland: A Decomposition Analysis Richard S.J. Tol
421 Electrical Appliance Ownership and Usage in Ireland Eimear Leahy, Seán Lyons and Sharon Walsh
420 Trade, Energy, and Carbon Dioxide: An Analysis for the Two Economies of Ireland
Marie Hyland, Anne Jennings and Richard S.J. Tol
419 To Convergence and Beyond? Human Capital, Economic Adjustment and a Return to Growth
John FitzGerald
For earlier Working Papers see