Abstract—Citric acid production using Aspergillus Niger-NCIM 705 is governed by the process variables such as Initial sucrose concentration, stirrer speed, Incubation period, fermentation temperature, pH, culture medium and O2/N2 supply.
Optimization of these parameters gives maximum yield of citric acid. This study included optimization of two parameters namely pH and Incubation period. For this, experiments were done in a batch fermenter with a one-liter working volume, taking sugar solution as the raw material. Genetic algorithm is used for the optimization of above said Process variables. It is found that the optimum pH is 6.0 and optimum incubation period is 6 days for the maximum yield of Citric acid.
Index Terms— Citric acid, optimization, genetic algorithm, Asperigillus niger.
I. INTRODUCTION
One of the most important fungi used in the industrial microbiology Aspergillus niger has been employed for many
years in the production of citric acid [1]. Citric acid is produced from bulk hydrated materials and as a by-product of sugar production by Asergillus niger [2]. However the demand for citric acid production is increasing faster than its production and hence more economical processes are required [3]. The growth and production of citric acid will greatly be affected by medium composition, fermentation parameters and stimulators. Citric acid (2-hydroxy2, 3-propanetricarboxylic acid) productivity by Aspergillus niger can be improved by
optimizing the fermentation parameters such as pH, fermentation temperature, Incubation period, Initial sucrose concentration, Stirrer speed, O2/N2 supply and Culture medium
A genetic algorithm (GA) is a search technique used in computer science to find approximate solutions to optimization and search problems. Genetic algorithms are a particular class of evolutionary algorithms that use techniques inspired by evolutionary biology such as inheritance, mutation, and recombination. Two elements are required for any problem
Manuscript received July 21, 2007.
K. A. Kishore is with the Department of Chemical Engineering, National Institute of Technology, Warangal-506004, A.P., India (phone: +91870-2462623; fax: +91870-2459547; e-mail: kola_nitw@ yahoo.com).
N. M. Mohan, was a post graduate student of Department of Chemical Engineering, National Institute of Technology, Warangal-506004, A.P., India (e-mail: [email protected]).
G. V. Reddy is with the Department of Chemical Engineering, National Institute of Technology, Warangal-506004, A.P., India (e-mail: [email protected]).
before a genetic algorithm can be used to search for a solution: First, there must be a method of representing a solution in a manner that can be manipulated by the algorithm. Traditionally, a solution can be represented by a string of bits, numbers or characters. Second, there must be some method of measuring the quality of any proposed solution, using a fitness function. For instance, if the problem involves fitting as many different weights as possible into a knapsack without breaking it, a representation of a solution might be a string of bits, where each bit represents a different weight, and the value of the bit represents whether or not the weight is added to the knapsack. The fitness of the solution would be measured by determining the total weight of the proposed solution: The higher the weight, the greater the fitness, provided that the solution is possible.
II. PREVIOUS WORK
The accumulation of citric acid by Aspergillus niger is
strongly influenced by the nutrient composition of the production medium. This medium contains 15–22% (w/v) sugar and is deficient in manganese ions. Among the factors that have been shown to exert an effect on citric acid fermentation (e.g. nitrogen or phosphate limitations, dissolved oxygen concentration, trace elements, etc.) is also the type and concentration of the carbon source. It is first reported by [4] that the final concentration of citric acid increases with increased initial sugar concentration, in the range of 14–22%. Results presented by [5] concerning the range of sucrose concentration for maximal citric acid production is in agreement with this. The superiority of sucrose over glucose and fructose has been documented by [6]-[8]. It has been reported by [9], that citric acid production by A. niger using
molasses as the substrate is severely affected by the presence of iron at a concentration as low as 0.2 ppm (w/v).
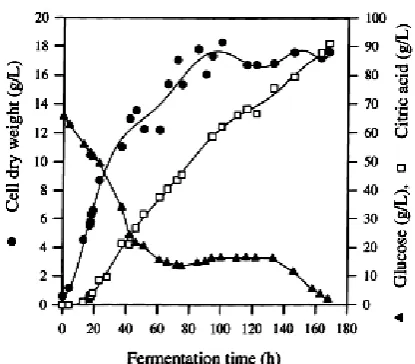
Fig. 1 shows time profiles of the biomass growth, glucose and citric acid concentrations. The rapid growth phase ended within 24 hours and the citric acid production began around this time. The glucose concentration was always high throughout the fermentation allowing the growth to be limited by the release of nitrogen from urea after the rapid growth phase of the fermentation. The maximum citric acid titer of 90 g/l compared well with other fermentations.
Optimization of Citric Acid Production Using
Genetic Algorithm
Fig. 1 Time profiles of cell dry weight, glucose and citric acid
concentrations [10].
Initial glucose concentration in the medium was 60 g/l. Additional glucose was added between 48 and 144 h at a constant feed rate of 6 ml/h to give a total glucose addition equivalent to 120 g/l.
It is developed by [11] that a novel method of citric acid production from beet molasses, in which an anion-exchange resin packed-column was connected to a fermenter for separation of citric acid from fermentation broth. The advantage of separation or purification by a sorption method is simplification in the production flow sheet and technology.
It is reported by [12] that a drop of intracellular pH stimulates citric acid accumulation by some strains of
Aspergillus niger. Their results suggest that one of the
mechanisms stimulating citric acid accumulation by
Aspergillus niger could be a slight cytoplasmic acidification. It
is reported by [13] that the effects of fermentor agitation and fed-batch mode of operation on the citric acid production from
Candida lipolitica using n-paraffin as the carbon source. An
optimum range of agitation speeds in the 800-1000 rpm corresponding to Reynolds numbers 50000 to 63000 gave best substrate utilization and biomass growth and citric acid productions rates. Three cycle fed-batch system increased the overall production rates of citric acid. It is studied by [14] that the oxygen requirement for the growth of Yarrowia lipolitica
and production of citric acid production. The authors report that oxygen requirement for growth of the microorganism and citric acid synthesis depends on iron concentration in the medium. It is studied by [15] that the physiological aspects of free and immobilized Aspergillus niger cultures producing citric acid
under various glucose concentrations. Rates of citric acid production were higher with immobilized mycelium, than the free, especially at higher glucose levels. It has been concluded that increased production of citric acid was due to change in the diffusion path for mass transfer.
It is studied by [16] that the nutrient optimization for the production of citric acid by Aspergillus niger NRRL 567 grown
on peat moss enriched with glucose. Seventeen different combinations of nutrient were tested to grow A. niger at 300C
for 48 hours and 72 hours and the citric acid production was measured. Central composite design method was used to develop a second order equation relating citric acid production as a function of initial glucose concentration, nitrogen, phosphorous and NaCl levels. Initial glucose and nitrogen levels were found to have significant positive and negative effects on citric acid production respectively. A peak citric acid production of 82 g/kg dry peat moss was reported. Citric acid fermentation using response surface methodology is investigated by [17]. The effect of potassium Ferro cyanide concentration on citric acid production and the prevention of solvent toxicity using corn oil were investigated. Citric acid production was increased with increasing Ferro cyanide concentration. The solvent toxicity was reduced using corn oil. Optimization studies related to the production of citric acid have been reported by [18]. Aspergillus niger entrapped in
Ca-alginate beads was used for the production of citric acid and the initial sucrose concentration, nitrogen concentration, ethanol and methanol concentration in the feed were optimized. It is reported by [19] that the optimization of nitrogen for enhanced productivity of citric acid by a 2-deoxy D-glucose resistant culture of Aspergillus niger NG-280 in a 15 l stirred
tank bioreactor. Ammonium nitrate was employed as the nitrogen source in the study and batch culture experiments were carried out under various concentration of ammonium nitrate.
III. EXPERIMENTAL
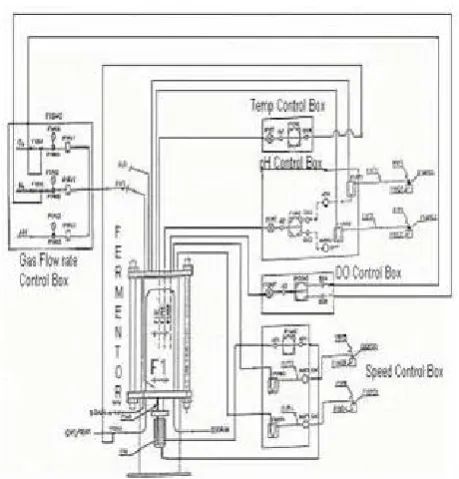
A 1.2 liter capacity fermentor made of glass [Scigenics (India) Pvt. Ltd.] equipped with standard control and instrumentation was used for the citric acid fermentation. The fermentor equipped with a flat blade impeller with three blades. Two 500 ml bottles were provided to the fermentor for the addition of acid and base, one silicon tube was provided for the addition of sterilized silicon oil to control foaming. The fermentor has arrangements for measuring pH and temperature by digital pH controller and digital temperature sensor. Cooling water supply was provided to maintain the temperature in the fermentor at the desired level. There are provisions for supplying Air, N2 and O2 at desired flow rates. The
experimental set up is shown in Fig. 2.
Fermentor was thoroughly cleaned with water and sterilized in an autoclave for 20 minutes. The sterilized fermentor was placed in the main assembly and tube connections were given for water and air. Then the sterilized medium containing vegetative inoculum was transferred to the fermentor from the conical flask after 24 hours of incubation. Thus the system was ready for the process. The power was switched on. The experimental conditions maintained were; agitator speed 200 rpm, fermentation temperature 300C and air flow rate 1-lpm.
Fig. 2 Experimental set up
IV. ESTIMATION METHODS A. Estimation of Citric Acid
Citric acid was estimated by titration method using NaOH solution and phenolphthalein indicator. Known volume of sample was collected from the fermentor, which was titrated against 0.1 N of NaOH solution. The end point is pink color.
B. Estimation of Sucrose
Concentration of sucrose was estimated by DNS method. A single beam UV scanning spectrophotometer (Systronic made and model-117) was used for measuring color intensity. One drop of concentrated HCl solution was added to 1 ml of the sucrose solution in a flask. The flask was heated to 900C for 5
minutes to allow hydrolysis. Three drops of 5 N KOH solution were added to neutralize the acid, because the DNS method must be applied in an alkaline condition to develop the red brown color which represents the presence of reducing sugars. Then the DNS reagent was added and the colour intensity was measured at 220nm. The color intensity is proportional to the concentration of sugar.
C. Estimation of Biomass
Biomass was estimated using a centrifuge. One ml of the sample was taken from the fermentor using a pipette into a micro centrifuge test tube of 1.5-ml capacity, whose empty weight was determined earlier. Then the test tube containing the sample was kept inside a centrifuge. The speed and temperature were maintained at 200 rpm and at 300C
respectively for 10 minutes in the centrifuge. After 10 minutes
the sample was taken out and the solution was poured out, leaving biomass inside the test tube. Then the test tube was kept in a hot oven for about 10 minutes and it was cooled before
measuring the final weight. The difference between the initial and final weights gave the biomass.
V. RESULTS AND DISCUSSION
In the present study, pH and incubation period have been
optimized. The two parameters were first optimized experimentally and the genetic algorithm was also used to optimize the parameters and the results were compared. The agreement between the experimental and the genetic algorithm is very good.
The pH was varied from 5.0 to 7.0 keeping all other parameters constant at: temperature=30οC, Incubation
period=24 hours, Stirrer speed=200 rpm, Initial sucrose concentration=100g/l, air flow rate 1-lpm and culture medium (potato dextrose agar medium).
The incubation period was studied by varying it between 2 and 10 days keeping all other variables constant at: Fermentation temperature=30οC, Stirrer speed=200 rpm,
Initial sucrose concentration=100g/l, pH= 6, air flow rate=1-lpm, and culture medium (potato dextrose agar medium).
[image:3.595.319.540.573.725.2]In Figs. 3 and 4 the variation of concentration of citric acid with time at pH values of 5 and 7 respectively are shown. The trend for other values of pH was found to be same; therefore for brevity only two figures are given. Similarly in Figs. 5 and 6 the variation of the concentration of citric acid with time at incubation periods of 2 and 10 days respectively, are shown. Here also only the representative figures are given. From the Figs. 3 and 4, which show citric acid production at different pH values, it can be seen that the maximum concentration of the citric acid has been reached at 168 hours and further fermentation up to 192 hours has marginally decreased citric acid production. Similarly maximum production of citric acid has been found to be at the same 168 hours of fermentation, in case of different incubation periods also.
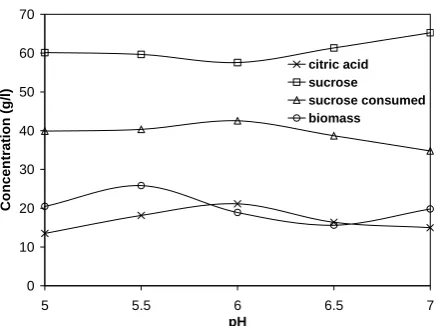
Fig. 7 shows the production of citric acid at different pH values. It is clear that the production is maximum at pH value of 6. Similarly Fig. 8 shows the citric acid production at different incubation periods. The maximum occurs at 6 days incubation period.
0 20 40 60 80 100
0 24 48 72 96 120 144 168
Time (hrs)
C
oncentr
ation (g/
l)
citric acid sucrose
Fig. 3 Time Vs Concentration at pH = 5.0 0 20 40 60 80 100
0 24 48 72 96 120 144 168
Time (hrs) Conc entra tion (g/l) citric acid sucrose sucrose consumed biomass
Fig. 4 Time Vs product Concentrations at pH = 7.0
0 10 20 30 40 50 60 70 80 90 100
0 24 48 72 96 120 144 168
[image:4.595.312.531.85.248.2]Time (hrs) C o nc entra tion (g/l) citric acid Sucrose Sucrose consumed biomass
Fig. 5 Time Vs Product concentrations for Incubation period =2days
0 10 20 30 40 50 60 70 80 90 100
0 24 48 72 96 120 144 168
[image:4.595.52.277.100.461.2]Time (hrs) Conce ntra ion (g/l) citric acid sucrose sucrose consumed bio mass
Fig. 6 Time Vs Product concentrations for Incubation period = 10 days
0 10 20 30 40 50 60 70
5 5.5 6 6.5 7
pH Co ncen tr ation (g /l ) citric acid sucrose sucrose consumed biomass
Fig. 7 Initial pH Vs Various Product Concentrations
0 10 20 30 40 50 60 70 80 90 100
0 2 4 6 8 10
Incubation period (days)
[image:4.595.52.269.121.305.2]Conc ent ra ion ( g /l) citric acid sucrose sucrose consumed biomass
Fig. 8 Incubation period Vs Various Product concentrations VI. OPTIMIZATION BY GENETIC ALGORITHM
In the present study the yield of the citric acid as a function of pH and incubation period has been developed into two separate polynomials.
The Algorithm:
1. Take the data from the experiment between the incubation period or pH and citric acid yield.
2. Using curve fit technique; find the mathematical equation (relation) between input (pH or incubation period) and output (citric acid yield).
3. Optimize the output by controlling the input using the genetic algorithm.
4. Consider population size=20; chromosome length=8, Input minimum=2 days or 5; input max=10 or 7
5. Generate the initial population (20 chromosomes) by random generation of 0’s, 1’s.
6. Decode the generations into actual values of input. 7. Find the fitness values (citric acid production) for the total population using equation from the curve fitting.
[image:4.595.321.540.284.448.2]9. Find the difference error= abs (fit (1)-fit (psize)). 10. If error <=eps. Stop the process, go to 20. 11. if error >= eps. go for next generation, step 5.
12. Elitism: copy the 10% of top previous population(2
chromosomes) to the next population
13. Cross over: select the two parents from the previous
population using roulette wheel technique.
14. Apply cross over between these two parents using different marketing techniques. We will get two children for next population.
15. Generate total population using cross over technique. 16. Mutation: generate a random value. if the random
value<2% of population size.
17. Then select a chromosome and a bit from that chromosome randomly from the none population, and made it inverse (i. e if it is ‘0’, made it ‘1’ vice-versa).
18. Then we have new population of ‘20’. 19. Then go to step 6.
20. 1st chromosome of that population is the optimal control value i.e. optimum input. For that maximum production of citric acid.
[image:5.595.325.539.157.328.2]As a first step, a polynomial is developed using input (pH) and output (citric acid production g/l), relating input to the output. For pH versus citric acid production the following equation has been established. The polynomial has been used to get the optimum value of pH, using the genetic algorithm. The experimental results and the values generated by genetic algorithm have been plotted in Fig. 9. As can be seen from the Fig. 9 the agreement between experimental and GA values is very good.
(1)
Fig. 9 Final Population (after convergence) values using GA and Experimental results. .
Maximum citric acid production = 21.0705 g/l, at pH=6.0 A similar polynomial relating the input (Incubation period) and output (citric acid production g/l) has been developed. Equation 2 represents the citric acid production as function of
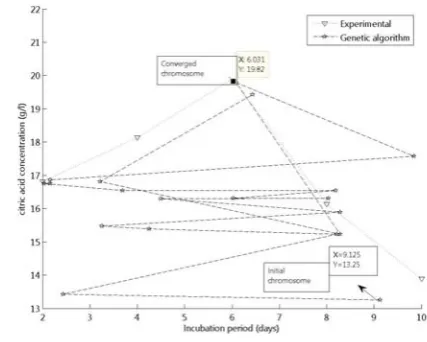
incubation period. The experimental and GA results have been plotted in Fig. 10, and it is observed that the agreement between the two is very good.
(2)
Fig.10 Final Population (after convergence) values using GA and Experimental results
Maximum citric acid production = 19. 7597 g/l, at 6.0313 days. VII. CONCLUSION
Genetic algorithms have been successfully used to optimize the operating parameters for the production of citric acid. Incubation period and pH have been optimized for 1.2 liter capacity batch fermenter. The optimum values are pH=6.0 and incubation period=6.0313 days.
REFERENCES
[1] Schuster, E., Dunn-Coleman, N., Frisvad, J.C., Van Dijck, P.W.M “On the safety of Aspergillus niger– a review”. Appl. Microbiol. Biotechnol., 59, 2002, pp:426–435
[2] Wang, H.H., Lee, S.Y “Poly-(3-hydroxybutyrate) production from whey b yhigh-density cultivation of recombinant Escherichia coli”. App. Microbiol. Biotechnol., 50, 1998,pp: 30-33
[3] Tran, C. T. Shy, L.I, MITCHALL, D.A. “Selection of strain of aspergillus niger for the production of citric acid from pine apple waste in solid sate fermentation” .W. J. Micro biol, Biotechnol.14, 1998: pp no: 399-404. [4] P. Shu, M.G. Jonhson, “Citric acid production by submerged fermentation
with Aspergillus niger”, Ind. Eng. Chem. 40, 1964,pp: 1202–1205.
[5] S. Honecker, B. Bisping, Z. Yang, and H.J. Rehm, “Influence of sucrose concentration and phosphate limitation on citric acid production by immobilized cells of Aspergillus niger,” Appl. Microbial. Biotechnology. 31, 1989, pp. 17–24.
[6] J.K. Gupta, L.G. Heding, O.B. Jorgensen, “Effect of hydrogen ion concentration and ammonium nitrate on the formation of citric acid by
Aspergillus niger,” Appl. Microbial. Acad. Sci. Hung. 23, 1976, pp: 63–76.
[7] M. Hossain, J.D. Brooks, I.S. Maddox, “The effect of the sugar source on citric acid production by Aspergillus niger”, Appl. Microbiol. Biotechnol. 19, 1984, pp: 393–397.
[8] D.P. Xu, C. Madrit, M. Rohr, C.P. Kubicek, “The influence of type and concentration of the carbon source on production of citric acid by
[9] Pera, L.M., Callieri, D.A., 1997. “Influence of calcium on fungal growth, hyphal morphology and citric acid production in Aspergillus niger”. Folia Microbial. 42, 1997, pp: 551–556.
[10] G.C. Paula, M.A. Priedeb, C.R. Thomas, “Relationship between morphology and citric acid production in submerged Aspergillus niger fermentations”, Biochemical Engineering Journal 3, 1999, pp 121-129. [11] Wang Jianlong , Wen Xianghua., Zhou Ding, “Production of citric acid
from molasses integrated with in-situ product separation by ion-exchange resin adsorption.”, Bioresource Technology,75,3, 2000,pp: 231-234 [12] Jerneje, K. and M. Legiga. “A drop of intracellular PH stimulates citric
acid accumulation by some strains of Aspergillus niger.” Journal of
Biotechnology, 112, 2004, pp; 289-297.
[13] Crolla, A. and K. J. Kennedy. “Fed batch production of citric acid by candida lipolitica grown on n-paraffins.” Journal of Biotechnology, 110, 2004, pp: 73-84.
[14] Kamzolova, S., N. V. Shishkanova, I. G. Murgunov and T. V. Finoginova. “Oxygen requirements for growth and citric acid production of Yarrowia lipolitica.” FEMS Yeast Research, 3, 2003, pp: 217-222.
[15] Papagianni, M. and M. Mattey. “Physiological aspects of free and immobilized Aspergillus niger cultures producing citric acid under various glucose concentrations.” Process Biochemistry, 39, 2004, pp: 1963-1970.
[16] Kim, J. W., S. Barrington, I. Sheppard and B. Lee. “Nutrient optimization for the production of citric acid by Aspergillus niger NRRL 567 grown on peat moss enriched with glucose.” Process Biochemistry, 41, 2006, pp: 1253-1260.
[17] Kilhe, M., E. Bayraktar, S. Ates and U. Mehmetoglu. “Investigation of extractive citric acid fermentation using response surface methodology.” Process Biochemistry, 37, 2002, pp: 759-767.
[18] Demirel, Gokan, K. O. Yaykasli and A. Yasar. “The production of citric acid by using immobilized Aspergillus niger A-9 and investigation of its various effects.” Food chemistry, 89, 2005, pp: 393-396.