Abstract—Learning and teaching supported by information and communication technologies is designated by different terms, with e-learning being one of the most frequently used. As a result of strategies defined and measures taken, this modern concept has gradually taken an important place also in Croatian higher education, however, the accomplishments of its implementation cannot be viewed as satisfactory as yet. In order to increase the efficiency and effectiveness of an e-learning system, one needs to foresee possible problems in its functioning and define adequate activities to overcome those problems, which should then be conducted permanently. A mandatory step in this process is polling users' opinion. Although there have been some attempts, these issues remain underresearched within the Croatian higher education system. The paper presents the results of the research which was intended to at least alleviate the current data insufficiency in this area. In addition, the purpose was to present internationally Croatian experience and student views on certain aspects of e-learning. Different statistical methods were used to analyze the collected data, in particular the factor and discriminant analysis.
Index Terms—Croatian students’ perception, efficiency and effectiveness of system, e-learning, factor and discriminant analysis
I. INTRODUCTION
Over the past two decades the Republic of Croatia has been going through complex social changes. Even in the 1980s, then being a part of the Yugoslav Federation, Croatian economy had faced a wide-ranging crisis, which gradually brought to the forefront a number of unresolved political and national issues. The abandonment of the inefficient socialist system of governance and advent of market-based economy coincided with the country's independence in 1991. The reforms initiated at that time came to a halt in the period until 1995, i.e. during the war in Croatia. Other factors that contributed to emphatically negative trends in those years were decreased competitiveness of the national economy, loss of the formerly common market, and privatization gone awry.
Manuscript received July 2, 2009.
Darko Dukić is with the Josip Juraj Strossmayer University of Osijek, Department of Physics, Trg Ljudevita Gaja 6, 31000 Osijek, Croatia (phone: +385981820025; fax: +38531232701; e-mail: [email protected]).
Goran Andrijanić is a Ph.D. Student with the Josip Juraj Strossmayer University of Osijek, Faculty of Economics, Trg Ljudevita Gaja 7, 31000 Osijek, Croatia (e-mail: [email protected]).
Following the war, the main foreign policy aims of the Republic of Croatia were to join the NATO and the European Union. The country has gained full NATO membership this year, whereas the process of joining the EU is still under way, with no foreseeable conclusion.
In the past few years, Croatian economy has managed to recover to a degree, achieving satisfactory growth rates, which were, however, primarily the result of growing debt-funded consumption. This trend was discontinued at the end of last year and earlier this year due to the effects of the global economic crisis, which is still showing no certain signs of alleviation.
Within circumstances briefly outlined above, the all-encompassing reform of the education system was initiated and implemented. The primary goal of the higher education reform in Croatia was to accelerate the inclusion of local university research and teaching into European and world academic communities, thus increasing the quality and competitiveness of Croatian universities. As a result of these efforts, the Republic of Croatia signed the Bologna Declaration in the year 2001, and also ratified the Lisbon Convention [1]. The intention of reform initiators was to design a higher education system that can successfully and promptly respond to the challenges of the modern world. Recent student protests, seeking to abolish tuition fees and demanding better conditions and facilities, indicate that the intentions will not be easily fulfilled. A certain proportion of teaching staff is also continuously speaking against the reforms, i.e. some aspects of reforms, which further complicates the situation.
Higher education reform in Croatia is closely connected with the concept of transforming the country into an information society, and knowledge society. As a modern learning and teaching concept, e-learning, which is based on using information and communication technologies (ICT), can significantly contribute to realizing such endeavors. In recent years, significant strides have been made regarding e-learning implementation; nevertheless, the achieved results are still far from satisfactory. Faculties that offer programs in computer and information sciences are at the forefront of using e-learning. On the other hand, faculties and departments that belong to the areas of biotechnology and natural sciences are mostly lagging behind in introducing e-learning, or limiting its usage to more simple forms. For this reason, it is advisable to take urgent measures regarding e-learning systems at the majority of research and education constituents. The efficiency and effectiveness of particular
Croatian Students’ Perception of e-Learning:
Research Based on Factor and Discriminant
Analysis
e-learning systems can be increased if there is a timely insight into possible problems in their functioning, followed by defining and implementing adequate activities to overcome those problems. Whenever this is necessary, the e-learning management should be prepared to correct the activities already undertaken.
User opinion polling is a key method of uncovering problems that might occur in the functioning of an e-learning system. To secure the information required for making adequate decisions, one needs to conduct regular comprehensive research of the user population, which has not been the case so far in Croatian higher education. There has been occasional polling and analysis of student attitudes towards e-learning, but mostly on very small samples. The research presented in this paper aims to at least alleviate the current data insufficiency in this area, but also to present internationally the way e-learning is perceived by Croatian students.
II. SHORT LITERATURE REVIEW
The introduction of e-learning in higher education has spurred interest for conducting different investigations regarding its implementation. It is therefore possible to find in the literature numerous studies about users and their perceptions. Judging by the countries the authors are coming from, e-learning has become a widely accepted concept, which is intriguing the research and academic communities around the world. Given the limited scope of this paper, we will briefly present only a few papers that have applied factor and discriminant analysis in investigating e-learning users and their perceptions of this learning mode.
N.-S. Chen and K.-M. Lin [2] have conducted an exploratory principal components factor analysis to assess the factor validity of the instrument in their study. The subjects of their research were students taking “Computer Networks and the Internet” course in the masters program offered over the Internet by National Sun Yat-sen University in Taiwan. C. Keller and L. Cernerud [3] used factor analysis and found a close inter-relationship between attitudes of students at the Jönköping University in Sweden related to using Web platforms. By means of factor analysis R. Elango, V.K. Gudep and M. Selvam [4] determined six factors reflecting students' perceptions of e-learning quality (relevance of course contents and delivery related factor, effectiveness of delivery mode related factor, instructor support and students’ commitment related factor, web-usage and online interaction related factor, course compliance and confidence in the system related factor, and relevance of testing instruments and grading related factor). These authors conducted their research on a sample of undergraduate e-learning students who were chosen by simple random sampling method from United Arab Emirates and Oman. In the research conducted by K. Jitgarun, S. Thaveesin, J. Neanchaleay, S. Suksakulchai and B. Puthaserenee [5] the purposes were to analyze and to describe the major factors that affected e-learning of students at public universities in Bangkok metropolitan area. Their research identified 14 main factors.
Using discriminant analysis, A. A. P. Rovai [6] showed
that there is a significant overall difference in community structure between American students enrolled in traditional face-to-face and those enrolled in asynchronous learning network courses. K. Clayton, F. C. Blumberg and D. P. Auld [7] also used discriminant analysis to indicate that there are significant differences in motivational orientations and learning strategies between students who preferred traditional environments showed and students who preferred less traditional environments. This research was conducted on a sample drawn from two post-secondary institutions in New York City.
Among the analyses of e-learning implementation within the Croatian higher education system we shall mention only two studies. In the research by N. Begičević, B. Divjak and T. Hunjak [8] the results of factor analysis have served as input in the multicriteria decision model. On the basis of answers by experts, the authors applied factor analysis and singled out five factors in decision making about e-learning implementation (human resources related factor, specific ICT infrastructure for e-learning related factor, basic ICT infrastructure related factor, strategic readiness for e-learning implementation related factor, and legal and formal readiness of environment related factor). D. Dukić, G. Dukić and M. Sesar [9] chose as a criterion variable the research area of the faculty, i.e. department that students belong to, and then used discriminant analysis to determine one statistically significant function according to which respondents differ. The analysis presented in this paper is a continuation of that research.
III. METHODS, SAMPLE AND VARIABLES
Different statistical methods were used to analyze the collected data. In describing the respondent sample we established absolute and relative frequencies of the determined groups, and also formed a two-way table by grouping according to feature modalities. Basic descriptive statistics were calculated for the variables that were defined in the research as attitudes towards e-learning.
Factor analysis is a statistical technique used to examine the structure of correlations among a set of observed scores. (R. D. Porter and L. R. Fabrigar [10]). Factor analysis can also be defined as a procedure that postulates that the correlations or covariances between a set of observed variables, arise from the relationship of these variables to a small number of underlying, unobservable, latent variables, usually known as the common factors (B. S. Everitt [11]). In our research, factor analysis was used in order to determine a smaller number of factors which explain the correlation pattern within the set of defined variables.
significance of differences in grade point average achieved by the students.
The study was carried out during the months of May and June in 2009. The sample encompassed 388 students at Josip Juraj Strossmayer University of Osijek. Broken down by gender, there were 131 male students (33.76%) and 257 female students (66.24%). The following table shows the distribution of respondents according to gender and the year of study.
Table I. Distribution of respondents according to gender and the year of study
YEAR OF STUDY GENDER
I II III IV TOTAL Male (6.70%) 26 (7.73%) 30 (6.96%) 27 (12.37%) 48 (33.76%)131 Female (15.21%) 59 (9.79%) 38 (17.01%) 66 (24.23%) 94 (66.24%)257 TOTAL (21.91%) 85 (17.53%) 68 (23.97%) 93 (36.60%) 142 (100.00%)388
Gender features and years of study represent the criterion variables in the analysis. In addition, there were 15 further variables defined in the study which reflected student attitudes on certain aspects of e-learning, as listed below: Estimate of the e-learning concept (V1);
Estimate of the possibility of studying and graduating exclusively through e-learning (V2);
Estimate of the need for the traditional teaching to be supported by e-learning (V3);
Estimate of the capability of e-learning to simplify the education process (V4);
Estimate of the impact of e-learning on student creativity (V5);
Estimate of the impact of motivation on e-learning efficiency (V6);
Estimate of grading objectivity when taking computer tests and exams (V7);
Estimate of the acceptance of being tested (by taking preliminary and final exams) by means of a computer (V8); Estimate of the possibility for e-learning to provide
flexibility in choosing teaching times (V9);
Estimate of the possibility to reduce the costs of higher education through e-learning (V10);
Estimate of the usefulness of e-learning for people with limited mobility (V11);
Estimate the capacity of e-learning to promote the acquisition of knowledge and skills in ICT (V12);
Estimate of lack of direct student-teacher contact as a drawback of e-learning (V13);
Estimate of lack of contact with fellow students as a drawback of e-learning (V14);
Estimate the inadequacy of e-learning for students with low computer literacy (V15).
The attitudes of the surveyed students were measured on the Likert scale comprising 5 grades, in which 1 denoted the lowest and 5 the highest degree of agreement with a particular claim.
The data analysis was performed with the support of the statistical packages SPSS and Statistica.
IV. BASIC DESCRIPTIVE STATISTICS REFERRING TO DEFINED RESEARCH VARIABLES
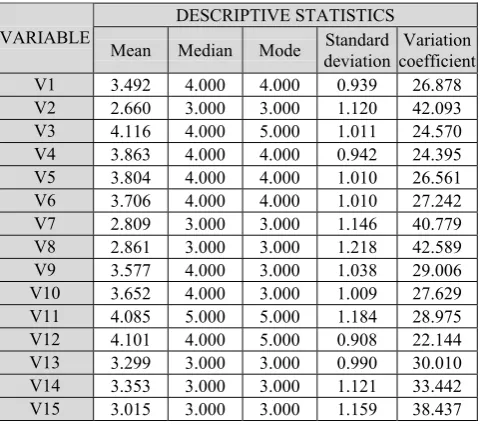
[image:3.595.308.549.150.363.2]For the variables showing student perceptions on e-learning we first calculated the basic descriptive statistics (mean, median, mode, standard deviation and variation coefficient). The obtained results are given in Table II.
Table II. Basic descriptive statistics DESCRIPTIVE STATISTICS VARIABLE
Mean Median Mode deviationStandard coefficientVariation V1 3.492 4.000 4.000 0.939 26.878 V2 2.660 3.000 3.000 1.120 42.093 V3 4.116 4.000 5.000 1.011 24.570 V4 3.863 4.000 4.000 0.942 24.395 V5 3.804 4.000 4.000 1.010 26.561 V6 3.706 4.000 4.000 1.010 27.242 V7 2.809 3.000 3.000 1.146 40.779 V8 2.861 3.000 3.000 1.218 42.589 V9 3.577 4.000 3.000 1.038 29.006 V10 3.652 4.000 3.000 1.009 27.629 V11 4.085 5.000 5.000 1.184 28.975 V12 4.101 4.000 5.000 0.908 22.144 V13 3.299 3.000 3.000 0.990 30.010 V14 3.353 3.000 3.000 1.121 33.442 V15 3.015 3.000 3.000 1.159 38.437 The highest average score was given to the need for e-learning to be the support to traditional teaching modes (V3). The average score higher than 4 was calculated only for variables defined as the estimate the capacity of e-learning to promote the acquisition of knowledge and skills in ICT (V12), and the estimate of the usefulness of e-learning for people with limited mobility (V11). Students gave the lowest average score to the possibility of studying and graduating exclusively through e-learning (V2). On the basis of the obtained results it can be concluded that Croatian students approve of introducing e-learning into the teaching process, however, they do not approve of a full online education. The mean lower than 3 was calculated also for the variables defined as the estimate of grading objectivity when taking computer tests and exams (V7), and the acceptance of being tested (by taking preliminary and final exams) by means of a computer (V8). Although computer-assisted testing is more objective than other types of examination, Croatian students expressed certain dissatisfaction with this manner of testing. There are several reasons for this attitude. Among other things, time for answering questions in a computer test is often limited, which is something most students dislike, as they feel they cannot fully concentrate in such circumstances. Furthermore, most students believe they can get better results if they are answering the questions verbally. These subjective perceptions certainly had an effect on the relatively poor score given to the objectivity of preliminary and final exams taken on a computer.
V. FACTOR ANALYSIS OF VARIABLES REFLECTING STUDENTS' PERCEPTION OF E-LEARNING
Factor analysis was used in our research in order to determine a smaller number of factors by means of which we explained the largest part of the common variance of variables that reflect our respondents' perceptions on e-learning.
Kaiser-Meyer-Olkin (KMO) measure of sampling adequacy, which in this case has the value 0.832, shows that the data are appropriate for conducting a factor analysis. By means of Bartlett's test of sphericity we confirmed the hypothesis on inter-relatedness of variables, which is another precondition for conducting this analysis (χ2= 1664.546,
p= 0.000).
Within the factor analysis, the extraction was carried out by principal components analysis, whereas the number of principal components was determined by means of Kaiser criterion. Following this limitation, the space of 15 variables was reduced to 4 principal components that explained 58.206% of total variance. Table III contains eigenvalues, percentages of variance explained and cumulative percentages of variance explained of extraction and rotation sums of squared loadings.
To make these components more interpretable, it is necessary to rotate solutions. Table IV contains the factor loadings for each variable on the components, which were determined after the method of varimax rotation with Kaiser normalization was applied. Varimax method belongs to the group of orthogonal rotation methods. This method minimizes the number of variables that have high loadings on each factor, and thus simplifies the interpretation of the factors.
The results indicate that six variables were instrumental in forming the first factor: the estimate of the e-learning concept (V1), the estimate of the possibility of studying and graduating exclusively through e-learning (V2), the estimate of the need for the traditional teaching to be supported by e-learning (V3), the estimate of the capability of e-learning to simplify the education process (V4), the estimate of the impact of e-learning on student creativity (V5), and the estimate of the possibility to reduce the costs of higher education through e-learning (V10). Considering the variables participating in its structuring, the factor singled out in this way can be named the factor of efficiency and
effectiveness of e-learning. The strongest correlation with
[image:4.595.306.549.62.268.2]this factor was achieved by variables V5 and V4, and the weakest by variable V10.
Table IV. Factor loadings FACTOR VARIABLE
1 2 3 4
V1 0.580 0.251 -0.003 -0.008
V2 0.610 -0.181 0.477 0.057
V3 0.570 0.491 -0.102 0.109
V4 0.745 0.252 0.088 -0.014
V5 0.786 0.080 0.156 -0.025
V6 0.426 0.453 0.079 0.221 V7 0.072 0.176 0.823 -0.014 V8 0.160 0.148 0.874 -0.011 V9 0.324 0.543 0.395 0.021
V10 0.480 0.206 0.259 -0.039
V11 0.180 0.785 0.106 -0.009 V12 0.371 0.659 0.132 0.051 V13 0.045 -0.014 -0.049 0.860 V14 0.001 0.117 -0.013 0.859 V15 -0.064 0.342 0.110 0.299 Variables defined as the estimate of the impact of motivation on e-learning efficiency (V6), the estimate of the possibility for e-learning to provide flexibility in choosing teaching times (V9), the estimate of the usefulness of e-learning for people with limited mobility (V11), the estimate the capacity of e-learning to promote the acquisition of knowledge and skills in ICT (V12), and the estimate the inadequacy of e-learning for students with low computer literacy (V15) were instrumental in forming the second factor. For this reason this factor, with which variable V11 achieved the strongest correlation, can be called the factor of
e-learning dependence and influence. In addition to variable
V11, a slightly higher correlation with the second factor was achieved by variable V12.
The third factor was structured by two variables, defined as the estimate of grading objectivity when taking computer tests and exams (V7), and the estimate of the acceptance of being tested (by taking preliminary and final exams) by means of a computer (V8), which is why it can be simply named the factor of attitudes towards computer testing. Both variables achieved a relatively high correlation with this factor.
There were only two variables instrumental in forming the fourth factor as well: the estimate of lack of direct student-teacher contact as a drawback of e-learning (V13), and the estimate of lack of contact with fellow students as a drawback of e-learning (V14). Due to the character of variables structuring it, this one can be named the social
factor of e-learning. Here it is also the case that both
variables have a relatively high correlation with the factor. Table III. Eigenvalues, percentages of variance explained and cumulative percentages of variance explained of
extraction and rotation sums of squared loadings
EXTRACTION SUMS OF SQUARED LOADINGS ROTATION SUMS OF SQUARED LOADINGS PRINCIPAL
COMPONENT Eigenvalue
Percentage of variance explained
Cumulative percentage of
variance explained
Eigenvalue
Percentage of variance explained
Cumulative percentage of
variance explained
1 4.608 30.720 30.720 2.929 19.527 19.527
2 1.740 11.603 42.323 2.182 14.547 34.074
3 1.358 9.055 51.379 1.983 13.223 47.297
[image:4.595.75.522.682.785.2]VI. EXAMINING STATISTICAL SIGNIFICANCE OF DIFFERENCES IN STUDENTS' ATTITUDES AND DISCRIMINATIVE ANALYSIS
[image:5.595.48.290.159.374.2]Table V lists the means and results of t-test that was used to verify statistical significance of differences in average scores of male and female students (before testing, the assumption on homogeneity of variances was confirmed by Levene's test).
Table V. Means and results of t-test GENDER
Male Female VARIABLE
Mean Mean
t-value p-level
V1 3.344 3.568 -2.240 0.026
V2 2.664 2.658 0.054 0.957 V3 4.046 4.152 -0.976 0.330
V4 3.702 3.946 -2.419 0.016
V5 3.656 3.879 -2.063 0.040
V6 3.725 3.696 0.264 0.792 V7 2.916 2.755 1.312 0.190 V8 3.031 2.774 1.966 0.050 V9 3.618 3.556 0.555 0.579 V10 3.687 3.634 0.487 0.627 V11 4.115 4.070 0.350 0.727 V12 4.031 4.136 -1.084 0.279 V13 3.313 3.292 0.199 0.843 V14 3.405 3.327 0.645 0.519 V15 3.130 2.957 1.389 0.166 At the level p< 0.05 the following differences in average scores by male and female students are statistically significant: the estimate of the e-learning concept (V1), the estimate of the capability of e-learning to simplify the education process (V4), and the estimate of the impact of e-learning on student creativity (V5). In all three cases female students expressed on average a higher degree of agreement with the claims.
Using the canonical analysis we have determined one discriminant function in students' responses according to their gender, however, it was not established to be statistically significant at the set significance level. For this reason, results that refer to this function will not be considered here.
Table VI contains the means and results of testing statistical significances of differences in average scores given by students in terms of their year of study (ANOVA). In this case the Levene's test was also first used to confirm the assumption on homogeneity of variances.
The results of testing showed that the following differences in average student scores can be viewed as statistically significant in terms of their year of study: the estimate of the need for the traditional teaching to be supported by e-learning (V3), the estimate of grading objectivity when taking computer tests and exams (V7), the estimate of the usefulness of e-learning for people with limited mobility (V11), the estimate the capacity of e-learning to promote the acquisition of knowledge and skills in ICT (V12), and the estimate of lack of contact with fellow students as a drawback of e-learning (V14). In all these cases, the highest scores to certain aspects of e-learning were given by fourth-year students (this corresponds to the first year of graduate studies in most other countries).
Table VI. Means and results of testing the hypothesis that population means are equal
YEAR OF STUDY I II III IV VARIABLE
Mean Mean Mean Mean
[image:5.595.316.539.399.475.2]F-ratio p-level V1 3.506 3.382 3.484 3.542 0.452 0.716 V2 2.565 2.647 2.796 2.634 0.688 0.560 V3 4.024 3.956 4.032 4.303 2.667 0.047 V4 3.741 3.676 4.022 3.923 2.454 0.063 V5 3.835 3.779 3.828 3.782 0.081 0.971 V6 3.529 3.691 3.699 3.824 1.525 0.207 V7 2.471 2.853 2.903 2.930 3.298 0.021 V8 2.612 2.882 2.925 2.958 1.583 0.193 V9 3.459 3.500 3.559 3.697 1.138 0.334 V10 3.600 3.676 3.677 3.655 0.108 0.955 V11 4.047 3.853 3.871 4.359 4.577 0.004 V12 3.953 4.000 4.011 4.296 3.588 0.014 V13 3.294 3.265 3.108 3.444 2.219 0.086 V14 3.282 3.162 3.172 3.606 4.076 0.007 V15 2.918 2.824 3.151 3.077 1.384 0.247 By means of canonical analysis it was established that within latent space students grouped according to the year of study can be differentiated through three discriminant functions (canonical roots). Among these, only the first one was shown to be statistically significant.
Table VII. Results of testing the significance of discriminant functions
SUCCESSIVE ROOTS REMOVED
Wilks'
lambda χ2 p-level
0 0.847 62.757 0.041
1 0.921 30.985 0.318 2 0.975 9.682 0.720
The structure matrix contains within-group correlations of each variable with the discriminant function (Table VIII). By means of this matrix the importance of each predictor variable in the determined canonical roots can be clearly seen.
Table VIII. Structure matrix DISCRIMINANT FUNCTION VARIABLE
1 2 3
V11 0.629 -0.005 0.199
V14 0.597 0.054 0.120
V12 0.523 0.256 -0.084
V3 0.461 0.171 0.133
V13 0.421 -0.153 -0.126
V9 0.261 0.224 -0.013
The obtained results indicate that the strongest correlation with the first discriminant function was achieved by the variable defined as the estimate of the usefulness of e-learning for people with limited mobility (V11). Medium positive correlation was found between the first function and the following variables: the estimate of lack of contact with fellow students as a drawback of e-learning (V14), the estimate the capacity of e-learning to promote the acquisition of knowledge and skills in ICT (V12), the estimate of the need for the traditional teaching to be supported by e-learning (V3), and the estimate of lack of direct student-teacher contact as a drawback of e-learning (V13). The variables defined as the estimate of the possibility for e-learning to provide flexibility in choosing teaching times (V9) has a relatively weak correlation with the first function. Since the remaining canonical roots are not statistically significant, the results that refer to them will not be considered here.
[image:6.595.62.277.290.366.2]Table IX displays the canonical variable means by group. Table IX. Means of canonical variables
DISCRIMINANT FUNCTION YEAR OF
STUDY 1 2 3
I -0.103 -0.380 0.154 II -0.215 -0.101 -0.320 III -0.322 0.301 0.102 IV 0.376 0.079 -0.006 Fourth-year university students were best identified by the first discriminant function. On the opposite side there were third-year students. A negative departure from the average was also shown by first-year and second-year students.
VII. CONCLUSION
The research presented here aims to initiate the efforts towards consistent monitoring of user attitudes on different aspects of e-learning implementation within the Croatian higher education system. Correct and timely insights into operational problems of an e-learning system can provide basic prerequisites for improving its efficiency and effectiveness. Since e-learning development is directly related to Croatia's strategic goals of transforming the country into an information and knowledge society, any disregard of these problems can produce long-ranging consequences. In this context, our research can be understood as a signpost for future studies into attitudes of e-learning users. It has set up a model framework for further research, a framework which needs continuous development.
The analysis conducted here has produced several interesting results. In the scope of factor analysis, four factors were determined that explain the correlation pattern within
the set of predetermined research variables. It was also confirmed that there are statistically significant differences in student attitudes on certain e-learning issues in terms of gender and the year of study. However, statistically significant discriminant function was established only regarding the second feature.
REFERENCES
[1] V. Rakić, and I. Milanović Litre (eds.), Education Sector Development Plan 2005 – 2010, Zagreb: Republic of Croatia - Ministry of Science, Education and Sports, 2005.
[2] N.-S. Chen, and K.-M. Lin, “Factors affecting e-learning for achievement”, in: P. Kommers, V. Petrushin, Kinshuk, and I. Galeev (eds.), Proceedings of the IEEE International Conference on Advanced Learning Technologies, Kazan, Russia, September 9-12, 2002, pp. 200-205., Available:http://lttf.ieee.org/icalt2002/proceedings/t502_icalt 148_End.pdf
[3] C. Keller, and L. Cernerud, “Student's perceptions of e-learning in university education”, Journal of Educational Media, Carfax Publishing (Taylor & Francis Group), vol. 27, nos. 1-2, 2002, pp. 55-67.
[4] R. Elango, V. K. Gudep, and M. Selvam, “Quality of e-learning: an analysis based on e-learners’ perception of e-learning”, The Electronic Journal of e-Learning, vol. 6, issue 1, 2008, pp. 31-44, Available: http://www.ejel.org/Volume-6/v6-i1/Elango_ et_al.pdf
[5] K. Jitgarun, S. Thaveesin, J. Neanchaleay, S. Suksakulchai, and B. Puthaserenee, “An analysis of factors that affected e-learning of students at public universities in Bangkok metropolitan are”, Available: http://www.worldedreform.com/intercon2/kalayanee.pdf [6] A. A. P. Rovai, “A preliminary look at the structural differences of
higher education classroom communities in traditional and ALN courses”, Journal for Asynchronous Learning Networks, vol. 6, issue 1, July 2002, pp. 41-56.
[7] K. Clayton, F. C. Blumberg, and D. P. Auld, “The relationship between motivation, learning strategies, and choice of online or traditional learning environments”, in: Kinshuk, D. G. Sampson, J. M. Spector, P. Isaías, and D. Ifenthaler (eds.), Proceedings of the IADIS International Conference on Cognition and Exploratory Learning in Digital Age (CELDA 2008), Freiburg, Germany, October 13-15, 2008, Freiburg: IADIS Press, 2008, pp. 390-393.
[8] N. Begičević, B. Divjak, and T. Hunjak: “Development of AHP based model for decision making on e-learning implementation”, Journal of Information and Organizational Sciences, Varaždin: Faculty of Organization and Informatics, vol. 31, no.1, 2007, pp. 13-25. [9] D. Dukić, G. Dukić, and M. Sesar, “Analysis of differences in student
opinions as e-learning management support”, in: V. Luzar-Stiffler, I. Jarec, Z. Bekic (eds.), Proceedings of the 31st International Conference
“Information Technology Interfaces” (ITI 2009), Cavtat / Dubrovnik, Croatia, June 22-25, 2009, Zagreb: University of Zagreb, SRCE University Computing Centre, 2009, pp. 363-368.
[10] R. D. Porter, and L. R. Fabrigar, “Factor analysis”, in: N. J. Salkind (ed.), Encyclopedia of Measurement and Statistics, vol. 1, Thousand Oaks: SAGE Publications, Inc., 2007, p. 341.
[11] B. S. Everitt, The Cambridge Dictionary of Statistics, Third edition, Cambridge: Cambridge University Press, 2006, p. 150.
[12] D. Cramer, and D. Howitt, The SAGE Dictionary of Statistics: A Practical Resource for Students in the Social Sciences, London: SAGE Publications, 2004, p. 51.