Emotion Distribution Learning from Texts
Deyu Zhou, Xuan Zhang, Yin Zhou, Quan Zhao, Xin Geng∗ MOE Key Laboratory of Computer Network and Information Integration
School of Computer Science and Engineering Southeast University, Nanjing, China
{d.zhou, zhouying1, xuanzhang, zhaoquan, xgeng}@seu.edu.cn
Abstract
The advent of social media and its prosperity enable users to share their opinions and views. Understanding users’ emotional states might provide the potential to create new business opportunities. Automatically identifying user-s’ emotional states from their texts and clas-sifying emotions into finite categories such as joy, anger, disgust, etc., can be consid-ered as a text classification problem. How-ever, it introduces a challenging learning sce-nario where multiple emotions with differen-t indifferen-tensidifferen-ties are ofdifferen-ten found in a single sen-tence. Moreover, some emotions co-occur more often while other emotions rarely co-exist. In this paper, we propose a novel ap-proach based on emotion distribution learning in order to address the aforementioned issues. The key idea is to learn a mapping function from sentences to their emotion distributions describing multiple emotions and their respec-tive intensities. Moreover, the relations of e-motions are captured based on the Plutchik’s wheel of emotions and are subsequently in-corporated into the learning algorithm in order to improve the accuracy of emotion detection. Experimental results show that the proposed approach can effectively deal with the emo-tion distribuemo-tion detecemo-tion problem and perfor-m reperfor-markably better than both the state-of-the-art emotion detection method and multi-label learning methods.
1 Introduction
The advent of social media and its prosperity enable the creation of massive online user-generated
con-∗Corresponding author
Sentence Trains crash near Thai resort town Emotions anger disgust fear joy sadness surprise2 0 62 0 90 10
Table 1:An example of a sentence containing emotions select-ed from SemEval 2007 Task#14, Affective Text, where each of the six emotions are indicated using a score of [0, 100].
tent including opinions and product reviews. Ana-lyzing such user-generated content allows the detec-tion of users’ emodetec-tional states, which might be po-tentially useful for downstream applications such as brand watching, product recommendation, and de-tection of health-related issues, etc. Based on the way emotions are represented, computational mod-els for emotion analysis can be categorized into di-mensional models and categorical models (Calvo and D’Mello, 2010). Dimensional approaches (Rus-sell, 2003) emphasize the fundamental dimension-s of valence and aroudimension-sal in underdimension-standing emotion-al experience, which have long been studied by e-motion theorists. Categorical models (Gupta et al., 2013) involve the use of a categorical representa-tion, in which emotions are represented by a num-ber of labels. For example, Ekman’s basic emotion set (Ekman, 1992) consists of anger, disgust, fear, happiness, sadness and surprise. An example of a sentence and the annotated emotions can be found in Table 1.
Considering each basic emotion as class label for the sentence, emotion detection can be treated as a classification problem. There is a large body of pri-or wpri-ork on emotion classification (Mishne and de Rijke, 2006; Lin and He, 2009; Quan et al., 2015; Wang and Pal, 2015). By choosing the strongest e-motion as the ee-motion label for the sentence, most of
classification approaches are based on single-label learning. However, as shown in Table 1, a sentence might contain multiple emotions with varying inten-sities. Although, some lexicon-based approach such as (Wang and Pal, 2015) can output multiple emo-tions with intensities using non-negative matrix fac-torization. It can only guarantee convergence to a local minimum, which is prohibitive on the large, realistically-sized emotion detection problem.
Machine learning methods such as multi-label learning (MLL) can be employed to identify mul-tiple emotions for each sentence (Zhang and Zhou, 2014). MLL usually selects a threshold, then label-s emotionlabel-s with label-scorelabel-s higher than the threlabel-shold alabel-s relevant and the others as irrelevant. However, these methods are not able to learn the intensity of each emotion. To address this problem, a new machine learning paradigm called Label Distribution Learn-ing (LDL) (Geng, 2016) was proposed in recently years. Similarly, in this paper, we propose an e-motion distribution learning (EDL) algorithm. Dif-ferent from the previous approaches, EDL assumes that each sentence contains a mixture of basic e-motions with different intensities. Using categori-cal model, we can label each sentence with an emo-tion vector where each element corresponds to one basic emotion and the value of each element indi-cates the intensity of the emotion. We require that each vector element has a value between 0 and 1 and they sum up to 1. By doing so, the emotion vectors can be considered as emotion distributions and the proposed EDL algorithm aims to learn the mapping from sentences to their corresponding e-motion distributions by minimizing the differences between the true distributions and the predicted dis-tributions. Both the single-label learning and ML-L can be considered as special cases of EDML-L in e-motion detection. Moreover, as some ee-motions co-occur more often while others rarely co-exist, the relations between basic emotions are captured ac-cording to the Plutchik’s wheel of emotions theo-ry (Plutchik, 1980) and are incorporated in the learn-ing framework as constraints in order to improve the accuracy of emotion detection.
Our work makes the following contributions:
• We propose a novel approach based on
emo-tion distribuemo-tion learning to identify multiple
emotions with their intensities from texts. To the best of our knowledge, it is the first attempt to identify both emotions and intensities in the distribution learning framework.
• The relations between basic emotions are in-corporated into the learning framework as con-straints to improve the emotion detection accu-racy. To avoid the incorporation of noisy in-formation from the training data, the relation constraint is set based on the Plutchik’s wheel of emotions theory.
• Experimental results show that the proposed approach can effectively deal with the emotion distribution detection problem and perform re-markably better than the state-of-the-art multi-label learning methods and emotion detection method.
2 Related Work
In general, emotion classification can be approached by two types of methods, lexicon-based or corpus-based. Lexicon-based approaches rely on emotion lexicons consisting of words and their correspond-ing emotion labels for detectcorrespond-ing emotions from tex-t. For example, WordNetAffect (Strapparava and Valitutti, 2004) was constructed by extending Word-net, a lexical database of English terms, with infor-mation on affective terms. EmoSenticNet assigns six WordNetAffect emotion labels to SenticNet con-cepts (Poria et al., 2013), which can be thought of as an expansion of WordNetAffect emotion label-s to a larger vocabulary. Many approachelabel-s were proposed based on emotion lexicons. For example, (Aman and Szpakowicz, 2007) classified emotional and non-emotional sentences using the constructed emotion lexicon. (Choudhury et al., 2012) employed a classifier to detect human affective states in social media. (Wang and Pal, 2015) proposed a model with several constraints based on an emotion lexicon for emotion classification.
giv-en time. (Aman and Szpakowicz, 2007) described an emotion annotation task of identifying emotion category, emotion intensity and the words/phrases that indicate emotions in text. Emotion classifica-tion was conducted using trained support vector ma-chines. (Agrawal and An, 2012) proposed an un-supervised context-based approach to detect emo-tions from text at the sentence level. They comput-ed an emotion vector for each potential affect bear-ing word based on the semantic relatedness between words and various emotion concepts. The scores are then tuned using the syntactic dependencies with-in the sentence structure. (Bao et al., 2009) pro-posed an emotion topic model by augmenting laten-t Dirichlelaten-t allocalaten-tion wilaten-th an inlaten-termedialaten-te emolaten-tion layer. (Quan et al., 2015) proposed a logistic regres-sion model for social emotion detection. Intermedi-ate hidden variables were also introduced to model the latent structure of input text corpora.
Our work is partly inspired by (Quan et al., 2015). However, our proposed approach differs from (Quan et al., 2015) in two aspects: 1) by introducing the emotion distribution learning framework, many dif-ferent criteria can be used to measure the distance between the true distribution and the predicted dis-tribution, such as squaredX2, Euclidean, Jeffery’s
divergence apart from Kullback-Leibler divergence employed in logistic regression model. 2) the re-lations between basic emotions are captured based on the Plutchik’s wheel of emotions theory to avoid the incorporation of any noisy information from the training data.
3 Emotion Distribution Learning
3.1 Problem Setting
As have discussed in section 1, one sentence might contain one or more emotions, and each emotion has its own intensity. We usedyx to indicate the intensi-ty of emotion y for sentence x, where x ∈ X and
y∈ Y. The emotion intensity is normalized to make
dyx ∈[0,1]and∑ydyx = 1to constitute the emotion distribution.
Note thatdy
xdenotes the proportion thatyaccounts for in a full emotion distribution of x. It is differ-ent from the probability of y being a correct emo-tion label forx. Probability distribution implies that only one emotion label is correct for each sentence,
while emotion distribution allows multiple emotions in one sentence. The goal of EDL is to learn a map-ping from sentencesX = Rm to the distributions over a finite set of labelsY = {y1,y2, ...yc}. Each label represents one of the basic emotions.
3.2 Learning
Given a training set P = {(x1, E1),(x2, E2), ...,
(xn, En)}, where xi ∈ X is a sentence and Ei =
{dy1
xi,d
y2 xi, ..., d
yc
xi} is the emotion distribution
asso-ciated withxi. The goal of EDL is to learn a con-ditional probability mass function p(y|x) from P, where x ∈ X and y ∈ Y. Assuming that p(y|x) is a parametric model p(y|x;θ), whereθ are mod-el parameters, many different criteria can be used to measure the distance between two distribution-s, such as Squared X2, Euclidean, Jeffery’s
diver-gence, Kullback-Leibler (K-L) divergence and so on. Here we use Divergence defined by
DJ(Qa||Qb) = 2
∑
j
(Qja−Qjb)2 (Qja+Qjb)2
, where Qja and Qjb are the j-th element of the t-wo distributions Qa and Qb, respectively. Diver-gence is balanced, which makesDJ(Qa||Qb)equal toDJ(Qb||Qa). The formula above calculates the sum of all the distances between emotion intensities in the same position.
Then the optimal model parameters θ∗ is deter-mined by
θ∗ = arg min θ
∑
i
DJ(Ei||Eˆi) + ξ1
n
∑
k,r
|θk,r|1
+ξ2 n
∑
u
∑
j,k
ωjk∥θu,j−θu,k∥22
= arg min θ
2
∑
i,j (dyj
xi −p(yj|xi, θ))
2
(dyj
xi +p(yj|xi, θ))2
+ξ1 n
∑
k,r
|θk,r|1
+ ξ2 n
∑
u
∑
j,k
ωjk∥θu,j−θu,k∥22
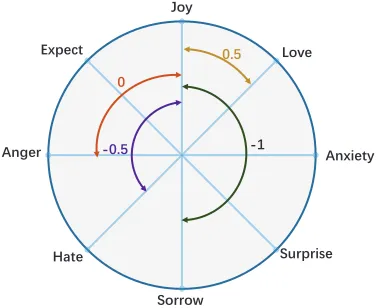
, whereEi is the ground truth emotion distribution of thei-th sentence and the Eˆi is the predicted one by p(y|xi;θ). The second term is a regularizer to make the predicted emotion distribution sparse, and the third term considers the relationship between d-ifferent emotions. As mentioned in section 1, some emotions often co-occur such as joy and love, and some rarely co-exist such as joy and anger. There-fore, the third term is employed to incorporate such prior knowledge. The weight ωjk models the rela-tionship between thej-th emotion and thek-th emo-tion in the distribuemo-tion. In this paper, we capture the relationships between different emotions based on Plutchik’s wheel of emotions (Plutchik, 1980) which is produced in psychology view. Plutchik’s wheel of emotions includes several typical emotions and its eight sectors indicate eight primary emotion dimensions arranged as four pairs of opposites. We re-produce a wheel of eight emotions’ relationship-s according to Plutchik’relationship-s theory, which irelationship-s relationship-shown in Figure 1.
澵濢濬濝濙濨濭
濇濩濦濤濦濝濧濙
濇濣濦濦濣濫 澹濬濤濙濗濨
澼濕濨濙 澵濢濛濙濦
澾濣濭
激濣濪濙
澤
澡澥 澤澢澩
澡澤澢澩
Figure 1:Plutchik’s wheel of emotions.
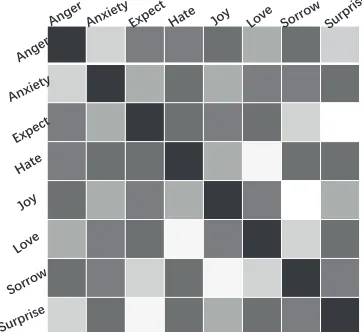
In the emotion wheel, emotions sat at opposite end have an opposite relationship, while emotion-s next to each other are more cloemotion-sely related. We quantify the relations between each pair of emotions based on the angle between them in wheel of emo-tions (Plutchik, 2001). For example, emotion pairs with 180 degrees are opposite to each other, which are described by −1, while emotion pairs with 90 degrees are described by 0, meaning no relation-ship between them. Emotion pairs with 45 degrees have the relationship value of 0.5, while emotion pairs with 135 degrees have the relationship value
of−0.5. Figure 2 shows the gray-scale image of the pair-wise relationships of emotions presented in Fig-ure 1. In each cell, the darker the color is, the more similar the two emotions are.
As forp(y|x;θ), similar to (Geng, 2016), we as-sume it takes a maximum entropy model, i.e.,
p(yk|xi;θ) = 1
Zi
exp(∑
r
θkrxri) (2)
, whereZi = ∑kexp(
∑
rθkrxri) is the normaliza-tion factor, xr
i is the r-th feature of xi, and θkr is an element inθ. Substituting Equation 2 into Equa-tion 1 yields the target funcEqua-tion,
T(θ) = 2∑ i,j
(
1− 4Zid yj xiexp (
∑
rθjrxri) (Zid
yj
xi + exp (
∑
rθjrxri))2
)
+ξ1 n
∑
k,r
|θk,r|1
+ξ2 n
∑
u
∑
j,k
ωjk∥θu,j −θu,k∥22.
(3) The minimization of the functionT(θ)can be effec-tively solved by the limited-memory quasi-Newton method (L-BFGS). The basic idea of L-BFGS is to avoid explicit calculation of the inverse Hessian ma-trix used in the Newton method. L-BFGS approxi-mates the inverse Hessian matrix with an iteratively updated matrix instead of actually storing the ful-l matrix. Here we foful-lful-low the idea of an effective quasi-Newton method BFGS. Consider the second-order Taylor series ofT′(θ) =−T(θ)at the current estimate of the parameter vectorθ(l):
T′(θ(l+1)) ≈ T′(θ(l)) +∇T′(θ(l+1))T∆ +1
2∆
TH(θ(l))∆, (4)
where∆ =θ(l+1)−θ(l)is the update step,∇T′(θ(l))
andh(θ(l)) are the gradient and Hessian matrix of
T′(θ(l)) at θ(l), respectively. The minimizer of E-quation 4 is
∆l=−H−1(θ(l))∇T′(θ(l)). (5) The line search Newton method uses ∆(l) as the search directionp(l) = ∆(l) and updates model pa-rameters by
where the step length α(l) is obtained from a line search procedure to satisfy the strong Wolfe condi-tions (Nocedal and Wright, 2006):
T′(θ(l)+α(l)p(l))≤T′(θ(l))+c1α(l)∇T′(θ(l))Tp(l)
|∇T′(θ(l)+α(l)p(l)| ≤c2|∇T′(θ(l))Tp(l)|,
where0 < c1 < c2 < 1. The idea of BFGS is to
avoid explicit calculation ofH−1(θ(l))by
approxi-mating it with an iteratively updated matrixB, i.e.
B(L+1) = (I−ρ(l)s(l)(u(l))T)×B(l)
×(I −ρ(l)u(l)(s(l))T) +ρ(l)s(l)(s(l))T where
s(l) = θ(l+1)−θ(l),
u(l) = ∇T′(θ(l+1))− ∇T′(θ(l)), ρ(l) = 1
[image:5.612.75.279.198.517.2]s(l)u(l).
Figure 2: Gray-scale image of the pair-wise relationships of emotions shown in Figure 1.
As for the optimization of the target function T(θ), the computation of BFGS is mainly related to the first-order gradient of T′(θ), which can be achieved by
∂T(θ)
∂θjr =
4dyj
xipij(1−pij)(d
yj xi −pij)
(dyj
xi +pij)3
+ξ1 ∑
k,r
sgn(θk,r)
+1 nξ2
∑
k
ωjk(θj−2θk), (7)
wherepij = Z1i exp(∑rθjrxri). Thus it performs more efficiently than the standard line search New-ton method.
In order to compare with the MLL methods, la-bels in the predicted distribution need to be divid-ed into two sets, i.e, the relevant and irrelevant set-s. For this purpose, an extra virtual label y0 is
added into the label set, i.e., the extended label set
Y′ =Y ∪ {y
0}={y0,y1,y2...yc}. Using the new ex-tended label set in the training process, the optimal parameter vector θ∗ is learned. Asy0 is the label
that distinguishes the relevant and irrelevant emo-tions directly, it is initialized as the threshold used in MLL. Given a sentencex′, its emotion distribution
is predicted byp(y|x′;θ∗). The intensity value ofy 0
splits the predicted distribution into two sets. The emotions with the intensity value higher than y0’s are regarded as the relevant emotions, and the rest emotions are regarded as irrelevant ones. Therefore, EDL in fact implements the function of MLL with-out the need of setting the threshold manually.
4 Experiments
4.1 Setup
We evaluate the proposed approach on the Ren-CECps corpus (Quan and Ren, 2010). It contains 35,096 sentences selected from blogs in Chinese. Each sentence is annotated with 8 basic emotion-s, such as anger, anxiety, expect, hate, joy, love, sorrowandsurprise, together with their emotion s-cores. Higher score represents higher emotion inten-sity. We useASi(j)to represent the score of emo-tionj in sentencei. Given a sentencexi, the inten-sity of emotionj is calculated bydyj
xi =
ASi(j) ∑
kASi(k).
By doing so, each intensity value fulfillsdyj
xi ∈[0,1]
and∑ydyj
xi = 1.
The internal nodes of the tree correspond to the com-bined meaning of the nodes underneath them. Each internal node is also represented in the same manner as individual words in the form of a vectorwˆ ∈Rd. These internal nodes are the hidden representations of the neural network. In the RAE model, the vocab-ulary is stored in an embedding matrixV ∈Rd×D whereDis the cardinality of the vocabulary. Typi-cally, each wordw∈V is initialized independently following a Gaussian distributionwi ∼N(0, γ2). In our experiment, we set the dimension of each sen-tence representation to100.
[image:6.612.316.539.56.179.2]We build a gray-scale image shown in Figure 3 by computing the correlation coefficient of the emo-tions from the Ren-CECps corpus. It can be ob-served that Figure 3 is quite similar to Figure 2, which shows that our proposed way in capturing the relations between emotions is inline with what have been revealed by the emotion annotations in the Ren-CECps corpus.
Figure 3: Gray-scale image of the pair-wise relations of the emotions in the Ren-CECps corpus.
4.2 Experimental Results
As the output of EDL is a distribution, a natural choice of criteria is the averaged similarity or dis-tance between the actual emotion distribution and the predicted distribution. There are many metric-s that can be applied to meametric-sure the dimetric-stance be-tween two distributions. In this paper six of them are used to evaluate the results of EDL, i.e, Euclidean, Sϕrensen, SquaredX2, KL divergence, Intersection
and Fidelity, as suggested in (Geng and Ji, 2013).
Name Formula
Distance
Euclidean Euclidean(P, Q) =√∑cj=1(Pj−Qj)2
Sϕrensen Sϕrensen(P, Q) = ∑c
j=1|Pj−Qj| ∑c
j=1(Pj+Qj)
SquaredX2 Squared
X2(P, Q) =∑c j=1
(Pj−Qj)2
Pj+Qj
Kullback-Leibler (KL) K-L(P, Q) =∑cj=1Pjln Pj
Qj
Similarity
Intersection Intersection(P, Q) =∑cj=1min(Pj, Qj)
Fidelity F idelity(P, Q) =∑cj=1
√
PjQj
Table 2:Evaluation criteria for the Label Distribution Learning (LDL) methods.
Name Formula
Hamming Loss hloss(h) =1
P ∑P
i=1|h(xi)△Yi| One error one-error(f) =1
P ∑P
i=1[arg maxy∈Yf(xi,y)]∈/Yi Coverage Coverage(f) =1
P ∑P
i=1maxy∈Yirankf(xi,y)−1 Ranking Loss rloss(f) =1
P ∑P
i=1|Yi1||Yi¯|· |R|, W here
R= (y′,y′′)|f(x
i,y′)≤f(xi,y′′),(y′,y′′)∈Yi×Y¯i Average Precision Average(f) =1
P ∑P
i=1|Yi1| ∑
[image:6.612.317.541.223.321.2]y∈Yirankf|Pi(|xi,y), where Pi=y′|rankf(xi,y′)≤rankf(xi,y),(y)′∈Yi Table 3:Evaluation criteria for the MLL methods.
The formulae of the six criteria are summarized in Table 4.2. Note that the virtual labely0 is removed
before evaluation.
[image:6.612.94.275.345.511.2]Algorithm Evaluation Criterion
Euclidean(↓) Sϕrensen(↓) SquaredX2(↓) K-L(↓) Intersection(↑) Fidelity(↑)
EDL 0.2361±0.0057 0.2346±0.0061 0.1780±0.0037 0.2067±0.0046 0.7654±0.0046 0.9523±0.0019
AA-KNN (Geng, 2016) 0.2948±0.0101• 0.2941±0.0123• 0.2688±0.0102• 0.3163±0.0087• 0.7059±0.0078• 0.9258±0.0090•
PT-Bayes (Geng, 2016) 0.3295±0.0125• 0.3288±0.0158• 0.2826±0.0115• 0.3263±0.0238• 0.6711±0.0241• 0.9238±0.0060•
PT-SVM (Geng, 2016) 0.3614±0.0869• 0.3625±0.0145• 0.3415±0.0089• 0.4073±0.0209• 0.6375±0.0099• 0.9069±0.0073•
AA-BP (Geng, 2016) 0.3299±0.0159• 0.3430±0.0264• 0.2885±0.0251• 0.3406±0.0092• 0.6569±0.0166• 0.9229±0.0056•
emoDetect (Wang and Pal, 2015) 0.3333±0.0678• 0.3468±0.0719• 0.2928±0.0674• 0.3463±0.0790• 0.6532±0.0719• 0.9212±0.0180• Table 4:Experimental results in comparison with the LDL methods and the emotion detection approach.
Algorithm Evaluation Criterion
Average Precision(↑) Coverage(↓) Hamming Loss(↓) One Error(↓) Ranking Loss(↓)
EDL 0.6419±0.0235 2.1412±0.0235 0.1772±0.0568 0.5239±0.0945 0.2513±0.0560
ML-KNN (Zhang and Zhou, 2014) 0.5917±0.0742• 2.448±0.0981• 0.2459±0.0781• 0.5339±0.0954• 0.2908±0.0431•
LIFT (Zhang, 2011) 0.5979±0.0891• 2.4267±0.0492• 0.1779±0.0597• 0.5131±0.0666• 0.2854±0.0427•
Rank-SVM (Zhang and Zhou, 2014) 0.5738±0.0892• 2.5861±0.0777• 0.2485±0.0458• 0.5603±0.0921• 0.3055±0.0579•
MLLOC (Huang and Zhou, 2012) 0.4135±0.0568• 3.6994±0.0764• 0.1850±0.0659• 0.6971±0.0924• 0.4742±0.0734•
BP-MLL (Zhang and Zhou, 2006) 0.4791±0.0999• 3.3773±0.0681• 0.2108±0.0986• 0.6316±0.0988• 0.4293±0.0956•
ECC (Read et al., 2011) 0.5121±0.0892• 2.7767±0.0876• 0.1812±0.0945• 0.6969±0.0598• 0.3281±0.0659• Table 5:Experimental results in comparison with the MLL methods.
2016), i.e., PT-Bayes, PT-SVM, AA-KNN, AA-BP. kin AA-KNN is set to 8. Linear kernel is used in PT-SVM. The number of hidden-layer neurons for AA-BP is set to 60. The evaluation results of our proposed approach in comparison to the LDL base-lines are presented in Table 4.2. For all the mea-sures, “↓” indicates “the smaller the better”, while “↑” indicates “the larger the better”. The best perfor-mance on each measure is highlighted by boldface. The two-tailedt-tests with 5% significance level are performed to see whether the differences between EDL and the baselines are statistically significan-t. We use• to indicate significance difference. As
the state-of-the-art emotion detection method pro-posed in (Wang and Pal, 2015) can output the e-motion distributions based on a dimensional reduc-tion method, we present its experimental results on the Ren-CECps corpus in the last row of Table 4.2. It can be observed that EDL performs significant-ly better than all the baseline LDL methods and the state-of-the-art emotion detection approach on al-l criteria considered here.
Since EDL can be seen as an extension of MLL, EDL is compared with 7 widely used MLL methods using the virtual labely0, namely ML-KNN (Zhang and Zhou, 2014), ECC (Read et al., 2011), MLLOC (Huang and Zhou, 2012), LIFT (Zhang, 2011), ML-RBF (Zhang, 2009), Rank-SVM (Zhang and Zhou, 2014), BP-MLL (Zhang and Zhou, 2006). Among
Zhou, 2006).
The virtual label y0 used in EDL and the thresh-old value used in MLL are all set to 2.5. Besides, the ε,ξ1andξ2are set as 0.25, 0.0001, 0.1 respectively.
For the MLL methods, the value ofk is set to 8 in ML-KNN, ratio is 0.02 andµis 2 in ML-RBF. Lin-ear kernel is used in LIFT. Rank-SVM uses the RBF kernel with the widthσequals to 1. The evaluation results of the proposed approach in comparison to all MLL baselines are presented in Table 4.2. EDL performs best on all evaluation measures. It verifies the advantage of EDL owing to the consideration of varying intensity of the basic emotions.
4.3 Further Analysis
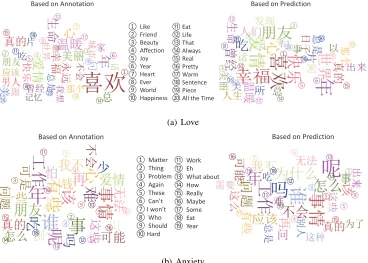
To fully understand the emotion detection results, we use word cloud (Harris, 2011) to output the top 30 frequent words in the testing data for the emotion love andanxietybased on the annotation as shown in the left part of Figure 4. We also output the top 30 frequent words for the two emotions based on the prediction generated by EDL as shown in Figure 4 ’s right part. It can be observed that most words based on prediction indeed express their associated emotions. For example, word “like” delivers the e-motion oflove(right part of Figure 4(a)) and word “problem” tells anxiety (right part of Figure 4(b)). Moreover, the annotation and the prediction share 20 out of the top 30 most frequent words for the emo-tionlovesuch as “friend”, “joy”, “happiness”, etc as shown in the middle of Figure 4(a) and 19 out of 30 for the emotion ofanxiety(the middle of Figure 4(b). It demonstrates that EDL can learn emotions from text precisely.
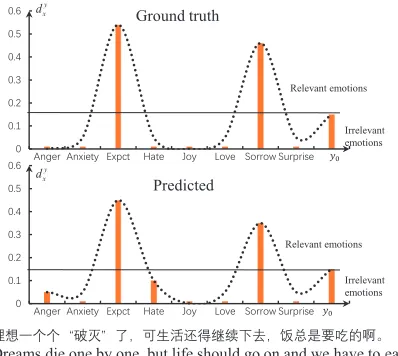
To investigate the emotion distributions generated by EDL, a sentence from the Ren-CECps corpus to-gether with the emotion distribution output by EDL is illustrated in Figure 5. The ground truth emotion distribution is obtained by normalizing the scores and the virtual label y0. As can be seen, the curve of the predicted emotion distribution is very similar as the ground truth distribution, which demonstrates that EDL can learn the varying intensities of all the basic emotions well.
濃 濃濁濄 濃濁濅 濃濁濆 濃濁濇 濃濁濈 濃濁濉
濔瀁濺濸瀅 濔瀁瀋濼濸瀇瀌 濘瀋瀃濶瀇 濛濴瀇濸 濝瀂瀌 濟瀂瀉濸 濦瀂瀅瀅瀂瀊 濦瀈瀅瀃瀅濼瀆濸
Ground truth
y x d
濃 濃濁濄 濃濁濅 濃濁濆 濃濁濇 濃濁濈 濃濁濉
濔瀁濺濸瀅 濔瀁瀋濼濸瀇瀌 濘瀋瀃濶瀇 濛濴瀇濸 濝瀂瀌 濟瀂瀉濸 濦瀂瀅瀅瀂瀊 濦瀈瀅瀃瀅濼瀆濸
Predicted
ݕ Relevant emotions
Irrelevant emotions y
x d
ݕ Relevant emotions
Irrelevant emotions
䌅⿲ᴩᴩ瀡䜳㽬瀢ᶅ漓⋮䐞㰺廗⺖䷦䷬ᴊ⊺漓桬⼺㔮墀⌂䖃⑉ȼ
[image:8.612.326.525.73.251.2]Dreams die one by one, but life should go on and we have to eat.
Figure 5: A sentence with the emotion distribution predicted by EDL.
5 Conclusions and Future Work
In this paper, we have proposed a novel approach based on EDL to identify multiple emotions with their intensities from texts. Moreover, the relations between basic emotions is incorporated in the learn-ing framework as constraints to improve the learnlearn-ing accuracy. Experimental results show that the pro-posed approach can effectively deal with the emo-tion distribuemo-tion detecemo-tion problem and perform re-markably better than the state-of-the-art multi-label learning methods and the emotion detection method. In future work, we will investigate the efficiency of the proposed approach in other datasets and explore other methods in capturing the inter-relations of e-motions.
Acknowledgments
⑩ ⑨ ⑧ ⑦ ⑥ ⑤④ ③ ② ① ⑰ ⑪ ⑫ ⑬ ⑭ ⑮ ⑯ ⑲ ⑱ ⑳ ③ ④ ⑤ ⑥ ⑦ ⑧ ⑨ ⑩ ① ② ⑪ ⑫ ⑬ ⑭ ⑮ ⑯ ⑰ ⑱ ⑲
ڙ֣ Зટ୍ͫՠङ߄ Зટͫ ҿИ ۈ չ ۈީ ङ߶՚ୃީ ͫ ୃ৬ઠۨ ①Like ②Friend ③Beauty ④Affection ⑤Joy ⑥Year ⑦Heart ⑧Ever ⑨World ⑩Happiness ⑪Eat ⑫Life ⑬That ⑭Always ⑮Real ⑯Pretty ⑰Warm ⑱Sentence ⑲Piece ⑳All the Time
Based on Annotation Based on Prediction
⑳ (a) Love ① ② ⑩ ⑨ ⑧ ⑦ ⑥ ⑤ ④ ③ ⑪ ⑫ ⑬ ⑭ ⑮ ⑯ ⑰ ⑱ ⑲ ⑩ ⑨ ⑧ ⑥ ⑤ ④ ③ ② ① ⑦ ⑯ ⑮ ⑭ ⑬ ⑫ ⑪ ⑲ ⑱ ⑰
Based on Prediction Based on Annotation
①Matter ②Thing ③Problem ④Again ⑤These ⑥ Can’t ⑦ I won’t ⑧Who ⑨Should ⑩Hard
⑪Work ⑫Eh ⑬What about ⑭How ⑮Really ⑯Maybe ⑰Some ⑱Eat ⑲Year
ڙ֣ Зટ୍ͫՠङ߄ Зટ
[image:9.612.123.491.73.336.2](b) Anxiety
Figure 4:Top 30 frequent words for the emotionloveandanxietybased on the annotation or the prediction.
References
Ameeta Agrawal and Aijun An. 2012. Unsuper-vised emotion detection from text using semantic and syntactic relations. In Proceedings of the 2012 IEEE/WIC/ACM International Joint Conferences on Web Intelligence and Intelligent Agent Technology, pages 346–353.
Saima Aman and Stan Szpakowicz. 2007. Identifying expressions of emotion in text. Lecture Notes in Com-puter Science, 4629:196–205.
S. Bao, Shengliang Xu, Li Zhang, Rong Yan, Zhong Su, Dingyi Han, and Yong Yu. 2009. Joint emotion-topic modeling for social affective text mining. In Proceed-ings of the Ninth IEEE International Conference on Data Mining, pages 699–704.
Bernhard E. Boser, Isabelle M. Guyon, and Vladimir N. Vapnik. 1992. A training algorithm for optimal mar-gin classifiers. In Proceedings of the Fifth Annual Workshop on Computational Learning Theory, pages 144–152.
R.A. Calvo and S. D’Mello. 2010. Affect detection: An interdisciplinary review of models, methods, and their applications. Affective Computing, IEEE Transactions on, 1(1):18–37.
Munmun De Choudhury, Michael Gamon, and Scot-t CounScot-ts. 2012. Happy, nervous or surprised? clas-sification of human affective states in social media. In
Proceedings of the Sixth International AAAI Confer-ence on Weblogs and Social Media, pages 435–438. Paul Ekman. 1992. An argument for basic emotions.
Cogition and emotion, 6(3-4):169–200.
Xin Geng and Rongzi Ji. 2013. Label distribution learn-ing. In Proceedings of the 13th IEEE International Conference on Data Mining Workshops, pages 377– 383.
Xin Geng. 2016. Label distribution learning. IEEE Transactions on Knowledge and Data Engineering, 28(7):1734–1748.
Narendra Gupta, Mazin Gilbert, and Giuseppe Di Fab-brizio. 2013. Emotion detection in email customer care.Computational Intelligence, 29(3):489–505. Jacob Harris. 2011. Word clouds considered harmful.
Nieman Journalism Lab.
Sheng-Jun Huang and Zhi-Hua Zhou. 2012. Multi-label learning by exploiting label correlations locally. In Proceedings of the 26th AAAI Conference on Artificial Intelligence, pages 949–955, Toronto, Canada. Chenghua Lin and Yulan He. 2009. Joint sentiment/topic
model for sentiment analysis. InProceedings of the 18th ACM Conference on Information and Knowledge Management, CIKM ’09, pages 375–384, New York, NY, USA. ACM.
Sympo-sium on Computational Approaches to Analysing We-blogs (AAAI-CAAW), pages 145–152, June.
Jorge Nocedal and Stephen Wright. 2006. Numerical optimization. Springer Science & Business Media. Robert Plutchik. 1980. A general psychoevolutionary
theory of emotion. Theories of emotion, 1.
Robert Plutchik. 2001. An argument for basic emotions. American Scientist, 89(4):344–350.
S. Poria, A. Gelbukh, A. Hussain, N. Howard, D. Das, and S. Bandyopadhyay. 2013. Enhanced senticnet with affective labels for concept-based opinion min-ing. Intelligent Systems, IEEE, 28(2):31–38.
Changqin Quan and Fuji Ren. 2010. Sentence emotion analysis and recognition based on emotion words us-ing ren-cecps. International Journal of Advanced In-telligence, 2(1):105–117.
Xiaojun Quan, Qifan Wang, Ying Zhang, Luo Si, and Li-u Wenyin. 2015. Latent discriminative models for social emotion detection with emotional dependency. ACM Trans. Inf. Syst., 34(1):2:1–2:19.
Jesse Read, Bernhard Pfahringer, Geoff Holmes, and Eibe Frank. 2011. Classifier chains for multi-label classification. Machine Learning, 85(3):333–359. James A. Russell. 2003. Core affect and the
psycholog-ical construction of emotion. Psychological Review, 110(1):145–172.
Richard Socher, Jeffrey Pennington, Eric H Huang, An-drew Y Ng, and Christopher D Manning. 2011. Semi-supervised recursive autoencoders for predicting sen-timent distributions. InProceedings of the Conference on Empirical Methods in Natural Language Process-ing, pages 151–161.
Carlo Strapparava and Alessandro Valitutti. 2004. Wordnet-affect: an affective extension of wordnet. In Proceedings of the 4th International Conference on Language Resources and Evaluation, pages 1083– 1086.
Yichen Wang and Aditya Pal. 2015. Detecting emo-tions in social media: A constrained optimization ap-proach. In Proceedings of the Twenty-Fourth Inter-national Joint Conference on Artificial Intelligence, pages 996–1002.
Min-Ling Zhang and Zhi-Hua Zhou. 2006. Multilabel neural networks with applications to functional ge-nomics and text categorization. IEEE Transactions on Knowledge and Data Engineering, 18(10):1338–1351. Min-Ling Zhang and Zhi-Hua Zhou. 2014. A review on multi-label learning algorithms. IEEE Transactions on Knowledge and Data Engineering, 26(8):1819–1837. Min-Ling Zhang. 2009. Ml-rbf: Rbf neural networks
for multi-label learning. Neural Processing Letters, 29(2):61–74.