Comparing Data Sources and Architectures for
Deep Visual Representation Learning in Semantics
Douwe Kiela, Anita L. Ver˝o and Stephen Clark Computer Laboratory
University of Cambridge
douwe.kiela,alv34,[email protected]
Abstract
Multi-modal distributional models learn grounded representations for improved performance in semantics. Deep visual representations, learned using convolutional neural networks, have been shown to achieve particularly high performance. In this study, we systematically compare deep visual representation learning techniques, exper-imenting with three well-known network architectures. In addition, we explore the various data sources that can be used for retrieving relevant images, showing that images from search engines perform as well as, or better than, those from manually crafted resources such as ImageNet. Furthermore, we explore the optimal number of images and the multi-lingual applicability of multi-modal semantics. We hope that these findings can serve as a guide for future research in the field.
1 Introduction
Multi-modal distributional semantics addresses the fact that text-based semantic models, which rep-resent word meanings as a distribution over other words (Turney and Pantel, 2010; Clark, 2015), suf-fer from the grounding problem (Harnad, 1990). Re-cent work has shown that this theoretical motivation can be successfully exploited for practical gain. In-deed, multi-modal representation learning leads to improvements over language-only models in a range of tasks, including modelling semantic similarity and relatedness (Bruni et al., 2014; Silberer and La-pata, 2014; Kiela and Bottou, 2014; Lazaridou et
al., 2015), improving lexical entailment (Kiela et al., 2015a), predicting compositionality (Roller and Schulte im Walde, 2013), bilingual lexicon induc-tion (Bergsma and Van Durme, 2011), selecinduc-tional preference prediction (Bergsma and Goebel, 2011), linguistic ambiguity resolution (Berzak et al., 2015), visual information retrieval (Bulat et al., 2016) and metaphor identification (Shutova et al., 2016).
Most multi-modal semantic models tend to rely on raw images as the source of perceptual input. Many data sources have been tried, ranging from image search engines to photo sharing websites to manually crafted resources. Images are retrieved for a given target word if they are ranked highly, have been tagged, or are otherwise associated with the tar-get word(s) in the data source.
Traditionally, representations for images were learned through bag-of-visual words (Sivic and Zis-serman, 2003), using SIFT-based local feature de-scriptors (Lowe, 2004). Kiela and Bottou (2014) showed that transferring representations from deep convolutional neural networks (ConvNets) yield much better performance than bag-of-visual-words in multi-modal semantics. ConvNets (LeCun et al., 1998) have become very popular in recent years: they are now the dominant approach for almost all recognition and detection tasks in the com-puter vision community (LeCun et al., 2015), ap-proaching or even exceeding human performance in some cases (Weyand et al., 2016). The work by Alex Krizhevsky et al. (2012), which won the Im-ageNet Large Scale Visual Recognition Challenge (ILSVRC) (Russakovsky et al., 2015) in 2012, has played an important role in bringing convolutional
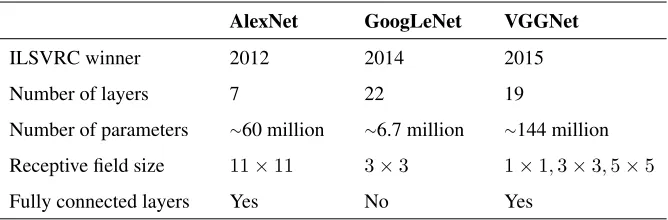
AlexNet GoogLeNet VGGNet
ILSVRC winner 2012 2014 2015
Number of layers 7 22 19
Number of parameters ∼60 million ∼6.7 million ∼144 million
Receptive field size 11×11 3×3 1×1,3×3,5×5
[image:2.612.140.474.59.169.2]Fully connected layers Yes No Yes
Table 1: Network architectures. Layer counts only include layers with parameters.
networks (back) to prominence. A similar network was used by Kiela and Bottou (2014) to obtain high quality image embeddings for semantics.
This work aims to provide a systematic compari-son of such deep visual representation learning tech-niques and data sources; i.e. we aim to answer the following open questions in multi-modal semantics:
• Does the improved performance over bag-of-visual-words extend to different convolu-tional network architectures, or is it specific to Krizhevsky’s AlexNet? Do others work even better?
• How important is the source of images? Is there a difference between search engines and manu-ally annotated data sources? Does the number of images obtained for each word matter?
• Do these findings extend to different languages beyond English?
We evaluate semantic representation quality through examining how well a system’s similarity scores cor-relate with human similarity and cor-relatedness judg-ments. We examine both the visual representations themselves as well as the multi-modal representa-tions that fuse visual representarepresenta-tions with linguistic input, in this case using middle fusion (i.e., concate-nation). To the best of our knowledge, this work is the first to systematically compare these aspects of visual representation learning.
2 Architectures
We use the MMFeat toolkit1(Kiela, 2016) to obtain
image representations for three different convolu-tional network architectures: AlexNet (Krizhevsky
1https://github.com/douwekiela/mmfeat
et al., 2012), GoogLeNet (Szegedy et al., 2015) and VGGNet (Simonyan and Zisserman, 2014). Image representations are turned into an overall word-level visual representation by either taking the mean or the elementwise maximum of the relevant image representations. All three networks are trained to maximize the multinomial logistic regression objec-tive using mini-batch gradient descent with momen-tum:
−
D
X
i=1 K
X
k=1
1{y(i)=k}log exp(θ
(k)>x(i))
PK
j=1exp(θ(j)>x(i))
where1{·}is the indicator function,x(i)andy(i)are
the input and output, respectively. Dis the number
of training examples andKis the number of classes.
The networks are trained on the ImageNet classifica-tion task and we transfer layers from the pre-trained network. See Table 1 for an overview. In this sec-tion, we describe the network architectures and their properties.
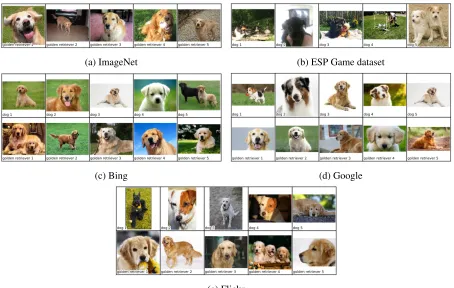
(a) ImageNet (b) ESP Game dataset
(c) Bing (d) Google
[image:3.612.80.534.58.346.2](e) Flickr
Figure 1: Example images fordog andgolden retriever from the various data sources. ImageNet has no images for dog, with images only at nodes lower in the hierarchy. ESP does not have images for the golden retriever tag.
instead of the other way around). While it uses an almost identical architecture, performance of Caf-feNet is slightly better than the original AlexNet.
GoogLeNet The ILSVRC 2014 challenge win-ning GoogLeNet (Szegedy et al., 2015) uses “incep-tion modules” as a network-in-network method (Lin et al., 2013) for enhancing model discriminability for local patches within the receptive field. It uses much smaller receptive fields and explicitly focuses on efficiency: while it is much deeper than AlexNet, it has fewer parameters. Its architecture consists of two convolutional layers, followed by inception lay-ers that culminate into an average pooling layer that feeds into the softmax decision (so it has no fully connected layers). Dropout is only applied on the final layer. All connections use rectifiers.
VGGNet The ILSVRC 2015 ImageNet classifi-cation challenge was won by VGGNet (Simonyan and Zisserman, 2014). Like GoogLeNet, it is much deeper than AlexNet and uses smaller receptive
fields. It has many more parameters than the other networks. It consists of a series of convolutional layers followed by the fully connected ones. All layers are rectified and dropout is applied to the first two fully connected layers.
These networks were selected because they are very well-known in the computer vision commu-nity. They exhibit interesting qualitative differences in terms of their depth (i.e., the number of layers), the number of parameters, regularization methods and the use of fully connected layers. They have all been winning network architectures in the ILSVRC ImageNet classification challenges.
3 Sources of Image Data
Google Bing Flickr ImageNet ESP Game
Type Search engine Search engine Photo sharing Image database Game Annotation Automatic Automatic Human Human Human Coverage Unlimited Unlimited Unlimited Limited Limited
Multi-lingual Yes Yes No No No
Sorted Yes Yes Yes No No
Tag specificity Unknown Unknown Loose Specific Loose
Table 2: Sources of image data.
visual representations. Various sources of image data have been used in multi-modal semantics, but there have not been many comparisons: Bergsma and Goebel (2011) compare Google and Flickr, and Kiela and Bottou (2014) compare ImageNet (Deng et al., 2009) and the ESP Game dataset (von Ahn and Dabbish, 2004), but most works use a single data source. In this study, one of our objectives is to asses the quality of various sources of image data. Table 2 provides an overview of the data sources, and Fig-ure 1 shows some example images. We examine the following corpora:
Google Images Google’s image search2 results
have been found to be comparable to hand-crafted image datasets (Fergus et al., 2005).
Bing Images An alternative image search engine is Bing Images3. It uses different underlying
tech-nology from Google Images, but offers the same functionality as an image search engine.
Flickr Although Bergsma and Goebel (2011) have found that Google Images works better in one exper-iment, the photo sharing service Flickr4 is an
inter-esting data source because its images are tagged by human annotators.
ImageNet ImageNet (Deng et al., 2009) is a large ontology of images developed for a variety of com-puter vision applications. It serves as a benchmark-ing standard for various image processbenchmark-ing and com-puter vision tasks. ImageNet is constructed along the same hierarchical structure as WordNet (Miller,
2https://images.google.com/ 3https://www.bing.com/images 4https://www.flickr.com
MEN (3000) SimLex (999)
Google 3000 999
Bing 3000 999
Flickr 3000 999
ImageNet 1326 373
ESPGame 2927 833
Common subset 1310 360
Table 3: Coverage on MEN and SimLex for our data sources.
1995), by attaching images to the corresponding synset (synonym set).
ESP Game The ESP Game dataset (von Ahn and Dabbish, 2004) was constructed through a so-called “game with a purpose”. Players were matched on-line and had to agree on an appropriate word label for a randomly selected image within a time limit. Once a word has been mentioned a certain number of times, that word becomes a taboo word and can no longer be used as a label.
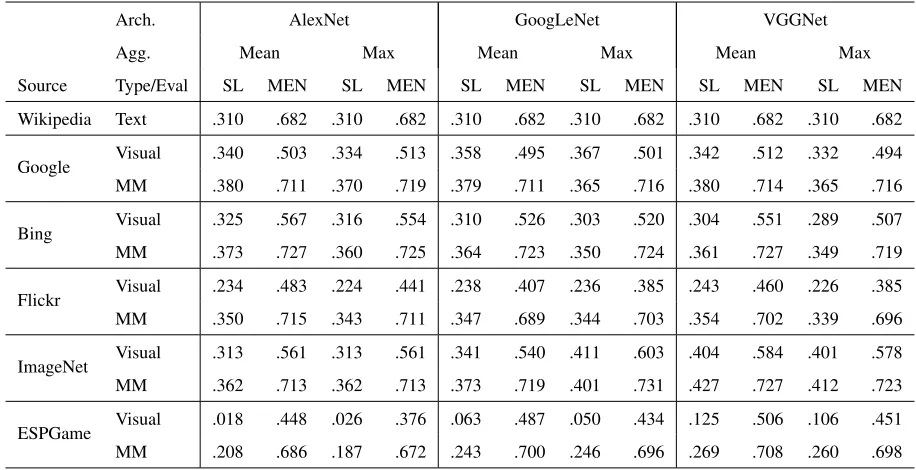
Arch. AlexNet GoogLeNet VGGNet
Agg. Mean Max Mean Max Mean Max
Source Type/Eval SL MEN SL MEN SL MEN SL MEN SL MEN SL MEN
[image:5.612.76.534.59.294.2]Wikipedia Text .310 .682 .310 .682 .310 .682 .310 .682 .310 .682 .310 .682 Google Visual .340 .503 .334 .513 .358 .495 .367 .501 .342 .512 .332 .494 MM .380 .711 .370 .719 .379 .711 .365 .716 .380 .714 .365 .716 Bing Visual .325 .567 .316 .554 .310 .526 .303 .520 .304 .551 .289 .507 MM .373 .727 .360 .725 .364 .723 .350 .724 .361 .727 .349 .719 Flickr Visual .234 .483 .224 .441 .238 .407 .236 .385 .243 .460 .226 .385 MM .350 .715 .343 .711 .347 .689 .344 .703 .354 .702 .339 .696 ImageNet Visual .313 .561 .313 .561 .341 .540 .411 .603 .404 .584 .401 .578 MM .362 .713 .362 .713 .373 .719 .401 .731 .427 .727 .412 .723 ESPGame Visual .018 .448 .026 .376 .063 .487 .050 .434 .125 .506 .106 .451 MM .208 .686 .187 .672 .243 .700 .246 .696 .269 .708 .260 .698
Table 4: Performance on maximally covered datasets.
language-specific, while the human annotated data sources are restricted to English. Google and Bing will return images that were ranked highly, while Flickr contains photos rather than just any kind of image. ImageNet contains high-quality images de-scriptive of a given synset, meaning that the tagged object is likely to be centered in the image, while the ESP Game and Flickr images may have tags de-scribing events happening in the background also.
3.1 Selecting and processing images
Selecting images for Google, Bing and Flickr is straightforward: using their respective APIs, the de-sired word is given as the search query and we ob-tain the top N returned images (unless otherwise in-dicated, we use N=10). In the case of ImageNet and ESP, images are not ranked and vary greatly in num-ber: for some words there is only a single image, while others have thousands. With ImageNet, we are faced with the additional problem that images tend to be associated only with leaf nodes in the hi-erarchy. For example,doghas no directly associated images, while its hyponyms (e.g. golden retriever,
labrador) have many. If a word has no associated
images in its subtree, we try going up one level and seeing if the parent node’s tree yields any images. We subsequently randomly sample 100images
as-sociated with the word and obtain semi-ranked
re-sults by selecting the 10 images closest to the me-dian representation as the sampled image represen-tations. We use the same method for the ESP Game dataset. In all cases, images are resized and center-cropped to ensure that they are the correct size input.
4 Evaluation
Representation quality in semantics is usually evalu-ated using intrinsic datasets of human similarity and relatedness judgments. Model performance is as-sessed through the Spearmanρsrank correlation
be-tween the system’s similarity scores for a given pair of words, together with human judgments. Here, we evaluate on two well-known similarity and re-latedness judgment datasets: MEN (Bruni et al., 2012) and SimLex-999 (Hill et al., 2015). MEN fo-cuses explicitly on relatedness (i.e. coffee-tea and
coffee-mugget high scores, whilebakery-zebragets
a low score), while SimLex-999 focuses on what it calls “genuine” similarity (i.e.,coffee-teagets a high score, while bothcoffee-mug andbakery-zebra get low scores). They are standard evaluations for eval-uating representational quality in semantics.
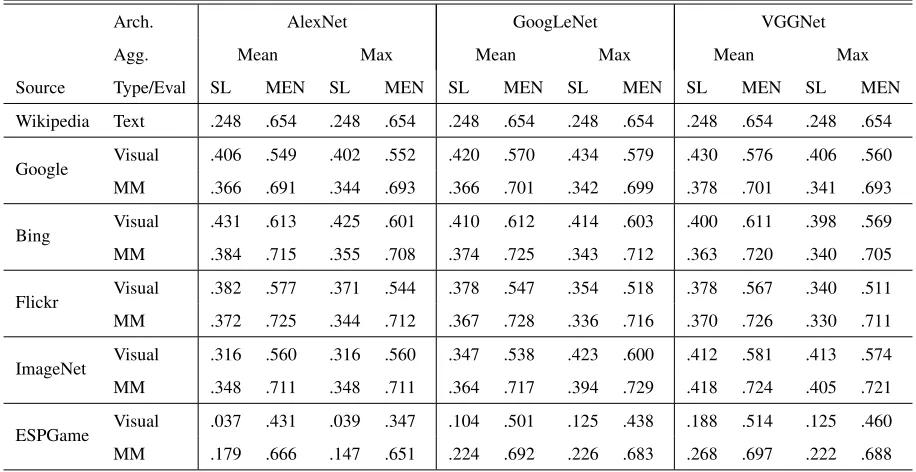
Arch. AlexNet GoogLeNet VGGNet
Agg. Mean Max Mean Max Mean Max
Source Type/Eval SL MEN SL MEN SL MEN SL MEN SL MEN SL MEN
[image:6.612.77.535.58.294.2]Wikipedia Text .248 .654 .248 .654 .248 .654 .248 .654 .248 .654 .248 .654 Google Visual .406 .549 .402 .552 .420 .570 .434 .579 .430 .576 .406 .560 MM .366 .691 .344 .693 .366 .701 .342 .699 .378 .701 .341 .693 Bing Visual .431 .613 .425 .601 .410 .612 .414 .603 .400 .611 .398 .569 MM .384 .715 .355 .708 .374 .725 .343 .712 .363 .720 .340 .705 Flickr Visual .382 .577 .371 .544 .378 .547 .354 .518 .378 .567 .340 .511 MM .372 .725 .344 .712 .367 .728 .336 .716 .370 .726 .330 .711 ImageNet Visual .316 .560 .316 .560 .347 .538 .423 .600 .412 .581 .413 .574 MM .348 .711 .348 .711 .364 .717 .394 .729 .418 .724 .405 .721 ESPGame Visual .037 .431 .039 .347 .104 .501 .125 .438 .188 .514 .125 .460 MM .179 .666 .147 .651 .224 .692 .226 .683 .268 .697 .222 .688 Table 5: Performance on common coverage subsets of the datasets (MEN* and SimLex*).
case, we apply mid-level fusion, concatenating the L2-normalized representations (Bruni et al., 2014). Middle fusion is a popular technique in multi-modal semantics that has several benefits: 1) it allows for drawing from different data sources for each modal-ity, that is, it does not require joint data; 2) con-catenation is less susceptible to noise, since it pre-serves the information in the individual modalities; and 3) it is straightforward to apply and computa-tionally inexpensive. Linguistic representations are 300-dimensional and are obtained by applying skip-gram with negative sampling (Mikolov et al., 2013) to a recent dump of Wikipedia. The normalization step that is performed before applying fusion en-sures that both modalities contribute equally to the overall multi-modal representation.
5 Results
As Table 3 shows, the data sources vary in cover-age: it would be unfair to compare data sources on the different subsets of the evaluation datasets that they have coverage for. That is, when comparing data sources we want to make sure we evaluate on images for the exact same word pairs. When com-paring network architectures, however, we are less interested in the relative coverage between datasets and more interested in overall performance, in such
a way that it can be compared to other work that was evaluated on the fully covered datasets. Hence, we report results on the maximally covered subsets per data source, which we refer to as MEN and SimLex, as well as for the overlapping common subset of word pairs that have images in each of the sources, which we refer to as MEN* and SimLex*.
5.1 Maximum coverage comparison
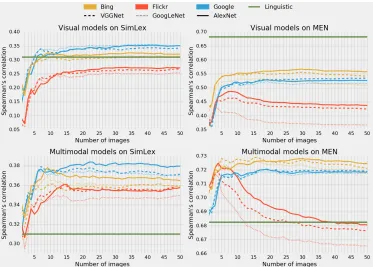
Figure 2: The effect of the number of images on representation quality.
For each of the network architectures, we see a marked improvement of multi-modal representa-tions over uni-modal linguistic representarepresenta-tions. In many cases, we also see visual representations out-performing linguistic ones, especially on SimLex. This is interesting, because e.g. Google and Bing have full coverage over the datasets, so their visual representations include highly abstract words, which does not appear to have an adverse impact on the method’s performance. For the ESP Game dataset (on which performance is quite low) and ImageNet, we observe an increase in performance as we move to the right in the table. Interestingly, VGGNet on ImageNet scores very highly, which seems to indi-cate that VGGNet is somehow more “specialized” on ImageNet than the others. The difference be-tween mean and max aggregation is relatively small, although the former seems to work better for Sim-Lex while the latter does slightly better for MEN.
5.2 Common subset comparison
Table 5 shows the results on the common subset of the evaluation datasets, where all word pairs have images in each of the data sources. First, note the same patterns as before: multi-modal
representa-tions perform better than linguistic ones. Even for the poorly performing ESP Game dataset, the VG-GNet representations perform better on both Sim-Lex and MEN (bottom right of the table). Visual representations from Google, Bing, Flickr and Im-ageNet all perform much better than ESP Game on this common covered subset. In a sense, the full-coverage datasets were “punished” for their ability to return images for abstract words in the previous experiment: on this subset, which is more concrete, the search engines do much better. To a certain extent, including linguistic information is actually detrimental to performance, with multi-modal per-forming worse than purely visual. Again, we see the marked improvement with VGGNet for ImageNet, while Google, Bing and Flickr all do very well, re-gardless of the architecture.
well, and is best avoided. If we have the right cov-erage, then ImageNet gives good results, especially if we can use VGGNet. However, coverage is of-ten the main issue, in which case Google and Bing yield images that are comparable or even better than images from the carefully annotated ImageNet.
5.3 Number of images
Another question is the number of images we want to use: does performance increase with more im-ages? Is it always better to have seen 100cats
in-stead of only10, or do we have enough information after having seen one or two already? There is an obvious trade-off here, since downloading and pro-cessing images takes time (and may incur financial costs). This experiment only applies to relevance-sorted data sources: the image selection procedure for ImageNet and ESPGame is more about removing outliers than about finding the best possible images. As Figure 2 shows, it turns out that the optimal number of images stabilizes surprisingly quickly: around 10-20images appears to be enough, and in
some cases already too many. Performance across networks does not vary dramatically when using more images, but in the case of Flickr images on the MEN dataset, performance drops significantly as the number of images increases.
5.4 Multi- and cross-lingual applicability Although there are some indicators that visual rep-resentation learning extends to other languages, par-ticularly in the case of bilingual lexicon learning (Bergsma and Van Durme, 2011; Kiela et al., 2015b; Vuli´c et al., 2016), this has not been shown directly on the same set of human similarity and relatedness judgments. In order to examine the multi-lingual ap-plicability of our findings, we train linguistic repre-sentations on recent dumps of the English and Italian Wikipedia. We then search for10images per word
on Google and Bing, while setting the language to English or Italian. We compare the results on the original SimLex, and the Italian version from Le-viant and Reichart (2015).
Similarly, we examine a cross-lingual scenario, where we translate Italian words into English using Google Translate. We then obtain images for the translated words and extract visual representations. These cross-lingual visual representations are
sub-SimLex EN IT (M) IT (C) Wikipedia Linguistic .310 .179 .179
Google Visual .340 .231 .238 Multi-modal .380 .231 .227
[image:8.612.314.538.63.188.2]Bing Visual .325 .212 .194 Multi-modal .373 .227 .207
Table 6: Performance on English and Italian Sim-Lex, either in the multi-lingual setting (M) or the cross-lingual settting (C) where we first map to En-glish.
sequently evaluated on the Italian version of Sim-Lex. Since we know that performance across archi-tectures is similar, we use AlexNet representations.
The results can be found in Table 6. We find the same pattern: in all cases, visual and multi-modal representations outperform linguistic ones. The Ital-ian version of SimLex appears to be more diffi-cult than the English version. Google performs bet-ter than Bing, especially on the Italian evaluations. For Google, the cross-lingual scenario works bet-ter, while Bing yields better results in the multi-lingual setting where we use the language itself in-stead of mapping to English. Although somewhat preliminary, these results clearly indicate that multi-modal semantics can fruitfully be applied to lan-guages other than English.
6 Conclusion and future work
The objective of this study has been to system-atically compare network architectures and data sources for multi-modal systems. In particular, we focused on the capabilities of deep visual represen-tations in capturing semantics, as measured by cor-relation with human similarity and relatedness judg-ments. Our findings can be summarized as follows:
best performance, AlexNet and VGGNet are the best choices.
• The choice of data sources appeared to have a bigger impact: Google, Bing, Flickr and Im-ageNet were much better than the ESP Game dataset. Google, Flickr and Bing have the ad-vantage that they have potentially unlimited coverage. Google and Bing are particularly suited to full-coverage experiments, even when these include abstract words.
• We found that the number of images has an impact on performance, but that it stabilizes at around10-20images, indicating that it is
usu-ally not necessary to obtain more than 10
ages per word. For Flickr, obtaining more im-ages is detrimental to performance.
• Lastly, we established that these findings ex-tend to other languages beyond English, obtain-ing the same findobtain-ings on an Italian version of SimLex using the Italian Wikipedia. We ex-amined both the multi-lingual setting where we obtain search results using the Italian language and a cross-lingual setting where we mapped Italian words to English and retrieved images for those.
This work answers several open questions in multi-modal semantics and we hope that it will serve as a guide for future research in the field. It is im-portant to note that the multi-modal results only ap-ply to the mid-level fusion method of concatenat-ing normalized vectors: although these findconcatenat-ings are indicative of performance for other fusion methods, different architectures or data sources may be more suitable for different fusion methods.
In future work, downstream tasks should be ad-dressed: it is good that multi-modal semantics im-proves performance on intrinsic evaluations, but it is important to show its practical benefits in more applied tasks as well. Understanding what it is that makes these representations perform so well is an-other important and yet unanswered question. We hope that this work may be used as a reference in determining some of the choices that can be made when developing multi-modal models.
Acknowledgments
Anita Ver˝o is supported by the Nuance Foundation Grant: Learning Type-Driven Distributed Represen-tations of Language. Stephen Clark is supported by the ERC Starting Grant: DisCoTex (306920).
References
Shane Bergsma and Randy Goebel. 2011. Using visual information to predict lexical preference. In Proceed-ings of RANLP, pages 399–405.
Shane Bergsma and Benjamin Van Durme. 2011. Learn-ing bilLearn-ingual lexicons usLearn-ing the visual similarity of la-beled web images. InIJCAI, pages 1764–1769. Yevgeni Berzak, Andrei Barbu, Daniel Harari, Boris
Katz, and Shimon Ullman. 2015. Do you see what i mean? visual resolution of linguistic ambiguities. In
Proceedings of EMNLP.
Elia Bruni, Gemma Boleda, Marco Baroni, and Nam-Khanh Tran. 2012. Distributional semantics in tech-nicolor. InACL, pages 136–145.
Elia Bruni, Nam-Khanh Tran, and Marco Baroni. 2014. Multimodal distributional semantics. Journal of Artif-ical Intelligence Research, 49:1–47.
Luana Bulat, Douwe Kiela, and Stephen Clark. 2016. Vision and Feature Norms: Improving automatic fea-ture norm learning through cross-modal maps. In Pro-ceedings of NAACL-HLT 2016, San Diego, CA. John A. Bullinaria and Joseph P. Levy. 2007. Extracting
Semantic Representations from Word Co-occurrence Statistics: A computational study. Behavior Research Methods, 39:510–526.
Stephen Clark. 2015. Vector Space Models of Lexical Meaning. In Shalom Lappin and Chris Fox, editors,
Handbook of Contemporary Semantic Theory, chap-ter 16. Wiley-Blackwell, Oxford.
Jia Deng, Wei Dong, Richard Socher, Li-Jia Li, Kai Li, and Fei-Fei Li. 2009. ImageNet: A large-scale hi-erarchical image database. InProceedings of CVPR, pages 248–255.
Robert Fergus, Fei-Fei Li, Pietro Perona, and Andrew Zisserman. 2005. Learning object categories from Google’s image search. In Proceedings of ICCV, pages 1816–1823.
Stevan Harnad. 1990. The symbol grounding problem.
Physica D, 42:335–346.
Geoffrey E Hinton, Nitish Srivastava, Alex Krizhevsky, Ilya Sutskever, and Ruslan R Salakhutdinov. 2012. Improving neural networks by preventing co-adaptation of feature detectors. arXiv preprint arXiv:1207.0580.
Douwe Kiela and L´eon Bottou. 2014. Learning image embeddings using convolutional neural networks for improved multi-modal semantics. In Proceedings of EMNLP, pages 36–45.
Douwe Kiela and Stephen Clark. 2014. A Systematic Study of Semantic Vector Space Model Parameters. In Proceedings of EACL 2014, Workshop on Contin-uous Vector Space Models and their Compositionality (CVSC).
Douwe Kiela, Laura Rimell, Ivan Vuli´c, and Stephen Clark. 2015a. Exploiting image generality for lexical entailment detection. In Proceedings of ACL, pages 119–124, Beijing, China, July. Association for Com-putational Linguistics.
Douwe Kiela, Ivan Vuli´c, and Stephen Clark. 2015b. Vi-sual bilingual lexicon induction with transferred con-vnet features. InProceedings of the 2015 Conference on Empirical Methods in Natural Language Process-ing, pages 148–158, Lisbon, Portugal, September. As-sociation for Computational Linguistics.
Douwe Kiela. 2016. Mmfeat: A toolkit for extracting multi-modal features. InProceedings of ACL 2016. Alex Krizhevsky, Ilya Sutskever, and Geoffrey E. Hinton.
2012. ImageNet classification with deep convolutional neural networks. InProceedings of NIPS, pages 1106– 1114.
Angeliki Lazaridou, Nghia The Pham, and Marco Baroni. 2015. Combining language and vision with a multi-modal skipgram model. InProceedings of NAACL. Yann LeCun, L´eon Bottou, Yoshua Bengio, and Patrick
Haffner. 1998. Gradient-based learning applied to document recognition. Proceedings of the IEEE, 86(11):2278–2324.
Yann LeCun, Yoshua Bengio, and Geoffrey Hinton. 2015. Deep learning. Nature, 521(7553):436—444. Ira Leviant and Roi Reichart. 2015. Judgment language
matters: Multilingual vector space models for judg-ment language aware lexical semantics. arXiv preprint arXiv:1508.00106.
Min Lin, Qiang Chen, and Shuicheng Yan. 2013. Net-work in netNet-work. CoRR, abs/1312.4400.
David G. Lowe. 2004. Distinctive image features from scale-invariant keypoints. International Journal of Computer Vision, 60(2):91–110.
Tomas Mikolov, Kai Chen, Greg Corrado, and Jeffrey Dean. 2013. Efficient estimation of word representa-tions in vector space. InProceedings of ICLR, Scotts-dale, Arizona, USA.
George A. Miller. 1995. WordNet: A lexical database for English. Communications of the ACM, 38(11):39–41. Vinod Nair and Geoffrey E Hinton. 2010. Rectified
lin-ear units improve restricted boltzmann machines. In
Proceedings of ICML, pages 807–814.
Stephen Roller and Sabine Schulte im Walde. 2013. A multimodal LDA model integrating textual, cogni-tive and visual modalities. InProceedings of EMNLP, pages 1146–1157.
Olga Russakovsky, Jia Deng, Hao Su, Jonathan Krause, Sanjeev Satheesh, Sean Ma, Zhiheng Huang, Andrej Karpathy, Aditya Khosla, Michael Bernstein, Alexan-der C. Berg, and Li Fei-Fei. 2015. ImageNet Large Scale Visual Recognition Challenge. International Journal of Computer Vision (IJCV), 115(3):211–252. Ekaterina Shutova, Douwe Kiela, and Jean Maillard.
2016. Black holes and white rabbits: Metaphor iden-tification with visual features. In Proceedings of NAACL-HTL 2016, San Diego. Association for Com-putational Linguistics.
Carina Silberer and Mirella Lapata. 2014. Learning grounded meaning representations with autoencoders. InProceedings of ACL, pages 721–732.
Karen Simonyan and Andrew Zisserman. 2014. Very deep convolutional networks for large-scale image recognition.arXiv preprint arXiv:1409.1556.
Josef Sivic and Andrew Zisserman. 2003. Video google: A text retrieval approach to object matching in videos. InProceedings of ICCV, pages 1470–1477.
Christian Szegedy, Wei Liu, Yangqing Jia, Pierre Ser-manet, Scott Reed, Dragomir Anguelov, Dumitru Er-han, Vincent Vanhoucke, and Andrew Rabinovich. 2015. Going deeper with convolutions. In Proceed-ings of the IEEE Conference on Computer Vision and Pattern Recognition, pages 1–9.
Peter D. Turney and Patrick Pantel. 2010. From Fre-quency to Meaning: vector space models of semantics.
Journal of Artifical Intelligence Research, 37(1):141– 188, January.
Luis von Ahn and Laura Dabbish. 2004. Labeling im-ages with a computer game. InCHI, pages 319–326. Ivan Vuli´c, Douwe Kiela, Marie-Francine Moens, and
Stephen Clark. 2016. Multi-modal representations for improved bilingual lexicon learning. InProceedings of ACL, Berlin, Germany. Association for Computa-tional Linguistics.