Mr Ruben Ndihokubwayo, Lecturer, Department of Construction Management and Quantity Surveying, Cape Peninsula University of Technology, PO Box 1906, Bellville, 7535, South Africa. Phone: +27 21 959 6845, Fax: +27 86 778 0006, email: <ndihokubwayoR@ cput.ac.za>
Prof. Gerrit J. Crafford, Department of Quantity Surveying, Nelson Mandela Metropolitan University, PO Box 77000, Port Elizabeth, 6031, South Africa. Phone: +27 41 504 2153, Fax: +27 504 9935, email: <[email protected]>
Prof. Fanie Buys, Department of Quantity Surveying, Nelson Mandela Metropolitan University, PO Box 77000, Port Elizabeth, 6031, South Africa. Phone: +27 41 504 2023, Fax +27 504 9935, email: <[email protected]>
Model for setting priority construction
project objectives aligned with monetary
incentives
Peer reviewed and revised
Abstract
A comprehensive model based on priority project objectives aligned with monetary incentives, and agreed upon by built environment stakeholders was developed. A web survey was adopted to send out a questionnaire to nationwide participants, including contractors, quantity surveyors, project managers, architects, and consulting engineers, requesting them to base their responses on a specific construction project in which they have been involved. The development of the model consists of the combination of results from inferential statistics analyses of 7-point Likert scale questions in three aspects, namely motivational factors (Mann-Whitney and Kruskal-Wallis), monetary incentives (T-test and ANOVA), and project objectives aligned with monetary incentives (Principal Component Analysis). In total, 164 respondents participated in the survey. The findings revealed that there was no statistically significant difference between demographic groups (gender, age, qualification, experience) of respondents in the importance of motivational factors and monetary incentives. However, a significant difference was found in self-development needs and team working environment where, respectively, the younger age generation displayed more desire towards professional registration, while the older age generation did not favour the mix of skills and experience into the project. It was revealed that the provision of work opportunities to Small, Micro- and Medium Enterprises (SMMEs), and Health (HIV/AIDS) and Safety should be prioritised when offering monetary incentives. An understanding of the importance of monetary incentives offered towards achieving project objectives will create conducive procurement environment handling the personnel allocated to construction projects meeting their performance requirements.
Abstrak
‘n Model is ontwikkel vir projekdoelwitte wat deur die konstruksie- en konsultant spanlede betrokke in ‘n projek geprioritiseer kan word wanneer dit in lyn is met geldelike aansporings. ‘n Web-opname is gedoen deur ‘n vraelys landwyd aan deelnemers te stuur wat kontrakteurs, bourekenaars, projekbestuurders, argitekte en raadgewende ingenieurs insluit. Respondente is versoek om hul antwoorde te baseer op ‘n spesifieke konstruksieprojek waarby hulle betrokke is. Die ontwikkeling van die model is gebaseer op die kombinasie van resultate van inferensiële statistiekontleding van 7-punt Likert-skaal vrae in drie aspekte insluitende motiverende faktore (Mann-Whitney en Kruskal-Wallis), geldelike aansporings (T-toets en ANOVA), en projekdoelwitte in ooreenstemming met geldelike aansporings (Beginsel Komponente Analise). Die bevindinge van die opname, waaraan 164 respondente deelgeneem het, het aangetoon dat daar geen statisties beduidende verskil was tussen demografiese groepe (geslag, ouderdom, kwalifikasie, ervaring) van die respondente ten opsigte van die belangrikheid van die motiverende faktore en geldelike aansporings nie. Daar was ‘n beduidende verskil in self-ontwikkelingsbehoeftes en span werksomgewing waar, onderskeidelik, die jonger generasie meer begeerte na professionele registrasie getoon het, terwyl die ouer geslag nie ten gunste was vir ‘n kombinasie van vaardighede en ervaring in die projek nie. Die resultate toon ook dat die verskaffing van werkgeleenthede aan Klein, Mikro- en Medium Ondernemings (KMMOs) en Gesondheid (MIV/Vigs) en Veiligheid geprioritiseer moet word wanneer geldelike aansporings aangebied word. Begrip vir die belangrikheid van geldelike aansporings om projekdoelwitte te bereik, sal bevorderlik wees vir die verkrygingsomgewing se hantering van die personeel van konstruksieprojekte om aan hul prestasievereistes te voldoen.
Sleutelwoorde: geldelike vergoeding, motiveringsfaktore, projekdoelwitte
1. Introduction
the most critical areas in each construction project and mobilise the construction and consultant team members to adopt an incentive-motivated procurement system.
Tang, Qiang, Duffield, Young & Lu (2010: 465) stipulate that there is consensus among all parties involved in any construction project that the use of incentives is effective in providing motivation for participants to perform better. For purposes of this article, incentives may be understood as rewards offered to construction and consultant team members involved in the construction project to compel them towards higher performance. Rao (2009: 239) establishes that the reward informs the person that the behaviour was appropriate and can be used again in the future. The reward can be intrinsic or extrinsic. Intrinsic reward is the satisfaction a person gets in the process of performing a particular action, such as solving a complex problem; the extrinsic reward is given by another person in the form of promotion and pay increase (Rao, 2009: 239). While incentives have been recognised as motivational tools for individual employees to achieve certain goals, the South African construction industry has not fully exploited the various avenues to initiate motivation approaches aligned with project objectives in order to enhance the successful delivery of construction projects. This article reports on a study testing the following three hypotheses:
H1: Age, experience, qualification and gender do not result in statistically significant differences in construction and consultant team members’ perceptions of the importance of motivational factors.
H2: Age, experience, qualification and gender do not result in statistically significant differences in construction and consultant team members’ perceptions of the importance of monetary incentives.
H3: A comprehensive model based on priority project objectives aligned with monetary incentives, and agreed upon by built environment stakeholders can be developed.
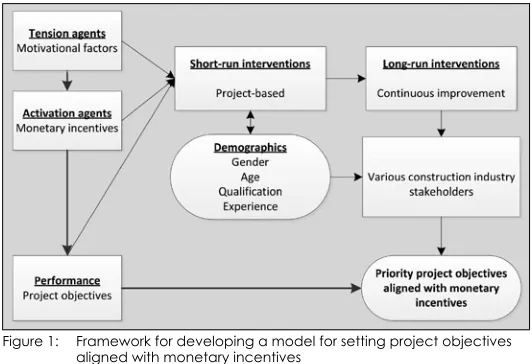
activation agent towards higher performance in order to enhance project objectives. Short-run intervention can be designed at project level, considering the demographics of construction and consultant team members involved in the project. Long-run interventions arising from demographics may be provided by various construction industry stakeholders, including government bodies, learning institutions and professional bodies.
Figure 1: Framework for developing a model for setting project objectives aligned with monetary incentives
Source: Ndihokubwayo, Crafford & Buys, 2014: own figure
2.
Motivational factors
Motivation is a set of forces that initiates, directs, and makes people persist in their efforts to accomplish a goal (Williams, 2009: 578). Hill & Howlett (2009: 254) stipulate that motivation is a driver that causes individuals to set personal goals and behave in a way that will allow them to reach those goals. In the context of this study, the following motivational factors towards higher performance will be discussed: self-development needs, organisational commitment, and team working environment. In other words, the accomplishment of these factors would imply a working and motivational environment conducive to higher job performance.
2.1 Self-development needs
[image:4.421.56.322.142.324.2]Collins et al. (2011: 239) refer to self-development as being a personal and professional development for managers, with individuals taking responsibility for their own learning, and control of both the means and the objectives for that development. In the context of this article, self-development for personal and professional development should be understood as a need for personal interest to fulfil career and professional development, compelling construction and consultant team members to higher performance for a given task. While a worker is expected to be fully committed to the organisation, it should not be ignored that project team members have other interests arising from being involved in project tasks, such as the desire to pursue their personal developmental goals, and motivational project team working environment.
In the context of this article, personal needs refer to needs related to professional development. Murdoch & Hughes (2008: 9) remark that people have interests outside their work: they may be members of professional institutions; their project membership may arise as a consequence of belonging to a firm. From the construction project point of view, project team members benefit from the opportunity of participating in the construction project in order to maximise their personal development. However, care should be taken that their personal interest does not conflict with the overall project goal.
2.2 Organisational commitment
Organisational commitment is the degree to which a person identifies with a specific organisation and its goals, and wishes to maintain membership in the organisation (Werner, 2007: 62). Employees should be committed to the success of their organisations. Hence, commitment to the employing organisation should be understood as the employees’ loyalty. In the construction industry context, the success of a project is inherent to construction and consultant team members’ performance; hence, a combination of employees’ self-development and loyalty to the companies they represent.
2.3 Team working environment
large extent, on the way in which the architect, engineer, quantity surveyor, contractors and others work together. French, Rayner, Rees & Rumbles (2008: 275) indicate that high-performance teams have special characteristics that allow them to excel in team work and achieve special performance advantages:
• High-performance teams have strong core values that help guide their attitudes and behaviours in directions consistent with the team’s purpose.
• High-performance teams turn a general sense of purpose into
specific performance objectives. Whereas a shared sense
of purpose gives general direction to a team, commitment
to specific performance results makes this purpose truly
meaningful.
• Members of high-performance teams have the right mix of skills, including technical skills, problem-solving and decision-making skills, and interpersonal skills.
• High performance teams possess creativity to assist organisations in continuous improvement of operations and in continuous development of new products, services and markets.
3.
Monetary incentives
more the contribution of the consultant team member to a successful project delivery.
4.
Team members’ diversity of needs in relation to their
demographics
Diversity refers to dissimilarities (differences) among people in respect of age, gender, race, ethnicity, religion, sexual orientation, socio-economic background, education, experience, physical appearance, capabilities/disabilities, and any other characteristic that is used to distinguish between people (Meyer, Ashleigh, George & Jones, 2007: 136; Schermerhorn, Hunt & Osborn, 2005: 43). The effective management of diversity means learning to appreciate and respond appropriately to the needs, attitudes, beliefs, and values that diverse people bring to the organisation (Meyer et al., 2007: 136). Team members are diverse in terms of their demographic status such as age, gender, race, cultural values, physical well-being, lifestyle preferences, ethnicity, educational background, religious preference, and occupational background (Slocum & Hellriegel, 2007: 231). Accordingly, their needs may be diverse. Consequently, it may be a complex issue to ascertain appropriate motivation approaches of team members.
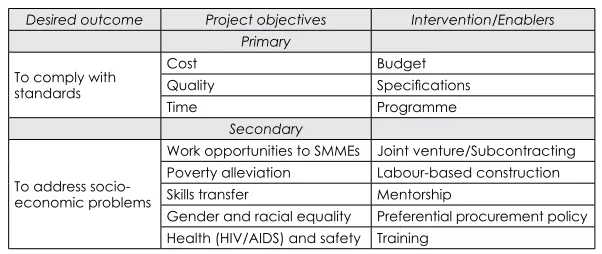
eager to fulfil. Secondary objectives are those related to intervention measures tailored to address certain socio-economic problems. Table 1: Outcome-driven construction procurement
Desired outcome Project objectives Intervention/Enablers
Primary
To comply with standards
Cost Budget
Quality Specifications
Time Programme
Secondary
To address socio-economic problems
Work opportunities to SMMEs Joint venture/Subcontracting Poverty alleviation Labour-based construction Skills transfer Mentorship
Gender and racial equality Preferential procurement policy Health (HIV/AIDS) and safety Training
5.1 Cost
While the cost of a construction project is an important concern in any construction project (Chan & Park, 2005: 295), Mbachu & Nkado (2004: 1) report that the global construction industry is plagued with cost overruns in project delivery. Ali & Kamaruzzaman (2010: 111) indicate that cost is a major problem in project development and a regular feature in the construction industry. In order to control the cost within the acceptable level, Chan & Park (2005: 295) propose an appropriate accurate measurement of various project-related determinants and an understanding of the magnitude of their effects.
5.2 Time
[image:8.421.53.354.100.227.2]5.3 Quality
Quality in construction is defined as meeting or exceeding the needs of the customer (Knutson, Schexnayder, Fiori & Mayo, 2004: 505). Freeman-Bell & Balkwill (1996: 208) synthesise that the definitions of quality have been coined as ‘fit for purpose’ and ‘satisfying customer needs’. Cornick (1991: 31) indicates that, if quality means conformance to requirements, there must be some means of ensuring that there is an unbroken chain of conformance to requirements throughout every phase of the total project process.
5.4 Provision of work opportunities to SMMEs
In order to redress the inequalities of the past in every sphere (political, social and economic), the National Small Business Act 102 was introduced in 1996 to provide an enabling environment for SMMEs (DTI, 2003: 8). The growth in the small- and medium-enterprise sector is desirable; hence, the creation of an enabling environment would be an essential component for small- and medium-enterprise development (CIDB, 2004b: 4). CIDB (2010a: 9) proposes that SMMEs would be provided with work on projects where it is desirable and feasible:
• To have SMMEs as a main contractor or joint venture partner. • To provide for mandatory subcontracting requirements or
obligations to subcontract an agreed quantum of work.
5.5 Poverty alleviation
5.6 Skills transfer
According to CIDB (2010a: 9), skills transfer in construction projects can occur where it is desirable to provide work-place experience or training of designated persons. The Skills Development Act of 1998 proposed the establishment of Sector Education and Training Authorities (SETA) for any national economic sector (South Africa, 1998: 14). The Construction Education Training Authority (CETA), established in 2000, has undertaken various skills development projects, and learnerships have been initiated with a view to developing a pool of skilled and motivated construction workforce whose skills are recognised and valued in terms of the National Qualifications Framework (NQF) (CETA, 2008: online). CETA promotes and accelerates quality training and identification of critical and scarce skills with a view to addressing skills shortages in the construction sector (CETA, 2008: online). Training was made possible by a joint effort of various stakeholders such as government departments and public entities involved in contractor skills training; CETA-accredited training providers, Built Environment professional bodies, construction employers’ bodies, labour organisations, and trainees. Despite the CETA’s effort to provide training of the workforce, the faster economic growth rate has resulted in rapid employment creation and skills demand.
5.7 Gender and racial equality
Reconstruction and Development Programme (RDP) goals – the RDP goal is to build a democratic, non-racial and non-sexist future; it represents a vision for the transformation of South Africa (South Africa, Parliament, 1994: 7).
5.8 Health (HIV/AIDS) and safety
The South African government has formulated the Occupational Health and Safety Act No. 85 of 1993 to provide for the health and safety of persons at work and of persons using plant and machinery; the protection of persons other than persons at work against hazards to health and safety arising out of, or in connection with activities of persons at work (South Africa, 1993: 1). The continuing poor health and safety performance of the construction industry in the form of fatalities, injuries, and disease, the large-scale construction accidents, and the general non-participation by key project stakeholders such as clients and designers provided a catalyst for a new approach which culminated in the promulgation of consolidated construction health and safety legislation in the form of Construction Regulation on the 18 July 2003 (Smallwood & Haupt, 2005: 2). Given that HIV/AIDS has become a pandemic in the construction industry, the CIDB (2008: 22) recommends that construction workers be exposed to an interactive workshop covering specific learning outcomes. These outcomes include the nature of HIV/AIDS, the transmission of HIV infection, HIV/AIDS preventive measures, voluntary HIV/AIDS counselling and testing, living with HIV/AIDS, treatment options for people with HIV/ AIDS, and the rights and responsibilities of workers in the work place with regard to HIV/AIDS (CIDB, 2008: 22-23).
6. Research
6.1 Methodology
A web survey strategy was used to gather the empirical data whereby a questionnaire was distributed nationwide. The survey was designed mostly with closed-ended questions and a few open-ended ones grouped into four sections. Section A requested the biographic profile of respondents. Section B tested motivation factors towards project success. Respondents were able to indicate on a 7-point Likert scale how important some self-development needs, organisational commitment and project team performance criteria motivate them to achieve higher performance. Section C consisted of questions testing perceptions on the importance of monetary incentives in the motivation to achieve the successful delivery of construction projects. Section D consisted of questions testing the aligning of project objectives with incentives. Specific project objectives were tested, including cost, time, quality, gender and racial equality, provision of work opportunities to SMMEs, skills transfer, Health (HIV/ AIDS) and Safety (H&S) aspects, respectively for the contracts in which respondents were involved.
Respondents were able to indicate on a 7-point Likert scale the importance of the provision of monetary incentives towards the achievement of cost, time and quality effectiveness, gender and racial equality target, provision of work opportunities to SMMEs aspects, skills transfer target, and Health (HIV/AIDS) & Safety (H&S) targets, respectively.
In all instances where the Likert response format questions were used, the scale measurement was 1 = unimportant, 2 = little important, 3 = somewhat important, 4 = important, 5 = very important, 6 = extremely important, 7 = utmost important, and U = Unsure.
The sample size consisted of 164 selected construction members of the Engineering Council of South Africa (ECSA), South African Institute of Architects (SAIA), South African Council for the Quantity Surveying Profession (SACQSP), South African Council for Project and Construction Management Profession (SACPCMP), and general building contractors registered by the Construction Industry Development Board (CIDB). 6.2 Interpretation of findings
consistency reliability for any scales or subscales used (Gliem & Gliem, 2003: 88). Reliability is the extent to which a measuring instrument is repeatable and consistent (Maree & Pietersen, 2007: 214). For this particular article, the internal reliability of variables was tested using Cronbach’s alpha coefficient of reliability. Maree & Pietersen (2007: 216) suggest the following guidelines for the interpretation of Cronbach’s alpha coefficient: 0.90 – high reliability; 0.80 – moderate reliability, and 0.70 – low reliability. For purposes of this article, the Cronbach’s alpha test results for each question are indicated in the findings section.
Differences between demographic groups were assessed using parametric tests, where the assumption of normality was not violated, and non-parametric tests, where the assumption of normality was violated. Non-parametric tests generally require the scores or observation to be independent, or matched samples are employed (Struwig & Stead, 2001: 165). Fellows & Liu (2008: 196) advise that rank-sum tests be used to test whether independent samples have been drawn from the same population. Fellows & Liu (2008: 196) propose using the Mann-Whitney U-test when there are two samples and the Kruskal-Wallis K-Test when there are three or more samples.
The analysis of variance (ANOVA) is a parametric test (Fellows & Liu, 2008: 194; Gravetter & Wallnau, 2009: 433) used for testing mean differences among two or more treatment conditions. According to Sarantakos (1997: 430), the ANOVA test is employed if the following three conditions are met:
• Independence – The observations that make up data are independent of one another if each observation or
measurement is not influenced by any other observation or
measurement (Pallant, 2010: 205).
• Normality – For parametric techniques, it is assumed that the populations from which the samples are taken are normally
distributed (Pallant, 2010: 206). Carifio & Perla (2007: 115)
advise that, if a Likert scale response format is used, and particularly so for items that factorially hold together as a scale or subscale reasonably well, then it is perfectly acceptable and correct to analyse the results at the (measurement) scale level using parametric analyses techniques such as F-Ratio or
Pearson correlation coefficients or its extensions (e.g., multiple
regression), and the results of these analyses should and will also be interpretable.
variances, and the test for homogeneity may be performed
by Levene’s test for equality of variance. If the significance
value is less than 0.05, this suggests that the variances for two groups are equal; therefore, the homogeneity of variance has been violated (Pallant, 2010: 207).
In this article, the dimension reduction was done by means of a Principal Component Analysis (PCA) to find priority project objectives aligned with monetary incentives. Abdi & Williams (2010: 1) refer to PCA as a multivariate technique that analyses a data table in which observations are described by several inter-correlated quantitative dependent variables. The PCA is appropriate when one has obtained measures on a number of observed variables and wishes to develop a smaller number of artificial variables that would account for most of the variance in the observed variables (SAS, 2011: 2). Fellows & Liu (2008: 227) stipulate that the principal components are extracted so that the first principal components account for the largest amount of the total variation in the data. Since the distinctive characteristic of PCA is its data-reduction capacity, it must determine the number of factors to be retained (Fellows & Liu, 2008: 227).
7. Findings
7.1 Respondents’ profile
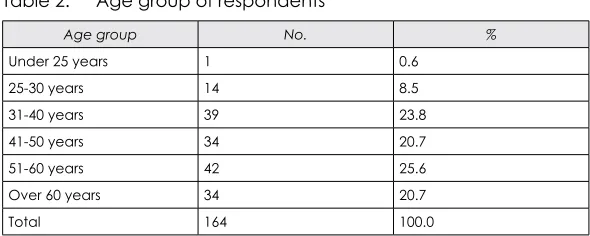
Of the 164 respondents, 80.5% (132) were males and 19.5% (32) were females. Table 2 shows the age distribution: 0.6% of the respondents were younger than 25 years; 8.5% were aged between 25 and 30; 23.8% between 31 and 40; 20.7% between 41 and 50; 25.6% between 51 and 60, and 20.7% were older than 60. From Table 3, it is evident that almost 80% of the respondents were highly qualified with a bachelor degree or higher.
Table 2: Age group of respondents
Age group No. %
Under 25 years 1 0.6
25-30 years 14 8.5
31-40 years 39 23.8
41-50 years 34 20.7
51-60 years 42 25.6
Over 60 years 34 20.7
[image:14.421.56.351.413.531.2]Table 3: Formal qualification of respondents
Qualification No. %
Matriculation certificate 9 5.5
Diploma 26 16.0
Bachelor degree 42 25.8
Honours degree 32 19.6
Postgraduate diploma 13 8.0
Masters degree 34 20.9
Doctorate degree 5 3.1
Other unspecified 2 1.2
Total 163 100.0
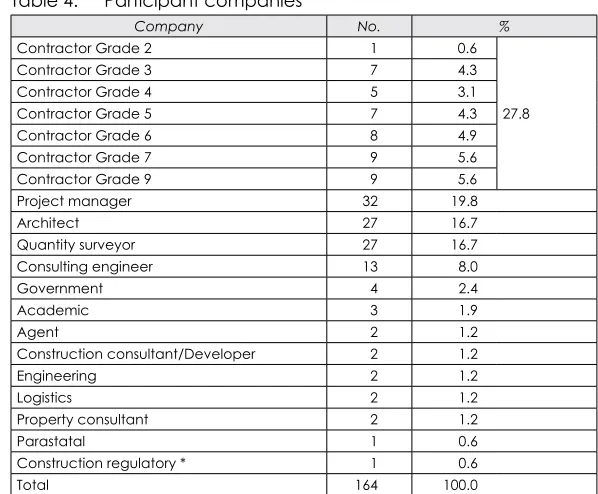
Table 4 shows that participant companies included contractors (28.8%), architects (19.0%), quantity surveyors (18.4%), project managers (17.2%), and consulting engineers (9.2%). While the total number of respondents was 164, missing data was not reported in the tables. Table 4: Participant companies
Company No. %
Contractor Grade 2 1 0.6
27.8
Contractor Grade 3 7 4.3
Contractor Grade 4 5 3.1
Contractor Grade 5 7 4.3
Contractor Grade 6 8 4.9
Contractor Grade 7 9 5.6
Contractor Grade 9 9 5.6
Project manager 32 19.8
Architect 27 16.7
Quantity surveyor 27 16.7
Consulting engineer 13 8.0
Government 4 2.4
Academic 3 1.9
Agent 2 1.2
Construction consultant/Developer 2 1.2
Engineering 2 1.2
Logistics 2 1.2
Property consultant 2 1.2
Parastatal 1 0.6
Construction regulatory * 1 0.6
Total 164 100.0
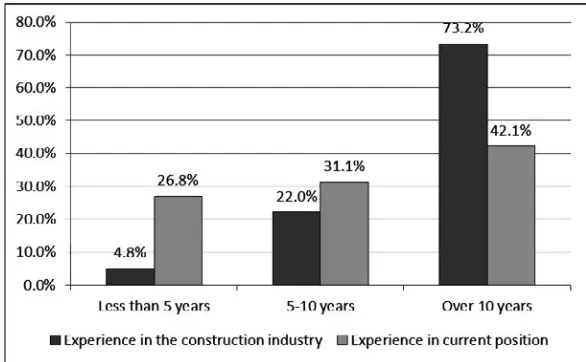
[image:15.421.69.364.64.178.2] [image:15.421.66.365.242.489.2]Figure 2 shows that 73.2% (120) of the respondents had over 10 years’ experience in the construction industry; 22.0% (36) between 5 and 10 years, and 4.9% (8) less than 5 years. Of the respondents, 42% (69) had been in their current position for over 10 years; 31.1% (51) between 5 and 10 years, and 26.8% (44) less than 5 years.
Figure 2: Experience of respondents
7.2 Hypothesis 1: Motivational factors
Table 5 presents the results of the test for the normality of motivational factors based on average. Given that the sample size is greater than 50, the significance level is based on the Shapiro-Wilk test (Field, 2013: 188). The obtained significance value of 0.00 (equal or less than 0.05) suggests the violation of the assumption of normality (Pallant, 2010: 63; Field, 2013: 185); thus, hypotheses were computed using non-parametric tests, namely Mann-Whitney and Kruskal-Wallis.
Table 5: Tests of normality for motivational factors
Kolmogorov-Smirnov Shapiro-Wilk
Statistic Df Sig. Statistic Df Sig.
Motivational factors 0.12 164 0.00 0.94 164 0.00
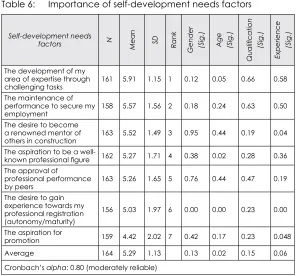
[image:16.421.59.351.447.485.2]mean score with a moderate reliability of 0.80, and reports the average significant differences of these variables in gender, age, qualification and experience of construction and consultant team members’ perceptions of the importance of self-development needs to motivate them to achieve higher performance.
Table 6: Importance of self-development needs factors
Self-development needs
factors N Mean SD Rank
Gender (Sig.) Age (Sig.)
Qualification
(Sig.)
Experience
(Sig.)
The development of my area of expertise through
challenging tasks 161 5.91 1.15 1 0.12 0.05 0.66 0.58 The maintenance of
performance to secure my
employment 158 5.57 1.56 2 0.18 0.24 0.63 0.50
The desire to become a renowned mentor of
others in construction 163 5.52 1.49 3 0.95 0.44 0.19 0.04 The aspiration to be a
well-known professional figure 162 5.27 1.71 4 0.38 0.02 0.28 0.36
The approval of professional performance
by peers 163 5.26 1.65 5 0.76 0.44 0.47 0.19
The desire to gain experience towards my professional registration (autonomy/maturity)
156 5.03 1.97 6 0.00 0.00 0.23 0.00
The aspiration for
promotion 159 4.42 2.02 7 0.42 0.17 0.23 0.048
Average 164 5.29 1.13 0.13 0.02 0.15 0.06
Cronbach’s alpha: 0.80 (moderately reliable)
[image:17.421.70.366.123.399.2]Regarding gender, the Mann-Whitney U-Test revealed no statistically significant difference (p=0.13) in the average of self-development needs levels of males (Md=5.29, n=132) and females (Md=5.71, n=32). Both males and females equally view the maintenance of performance to secure employment, the aspiration of promotion, the desire to become a renowned mentor of others in construction, the approval of professional performance by peers, the aspiration to be a well-known professional figure, and the development of their area of expertise through challenging tasks. However, there is a statistically significant difference between males and females in the desire to gain experience towards professional registration (autonomy/maturity). This suggests that further studies be done to find out any possible workplace gender imbalances in terms of career development and registration with construction industry professional bodies.
Regarding age, a Kruskal-Wallis test revealed a statistically significant difference (p=0.02) in the average of the importance of self-development needs across 6 different age groups, where Gp1, n=1: under 25 years; Gp2, n=14: 26-30 years; Gp3, n=39: 31-40 years; Gp4, n=34: 41-40 years; Gp5, n=42: 51-60 years, and Gp6, n=34: over 60 years. The age group (31-40 years) recorded the highest median score (5.86), while the older age group (over 60 years) recorded the lowest median value of 4.86. A post-hoc test revealed that the younger age group was more concerned with self-development needs than the older age group (Gp3: Md=5.86 vs Gp5: Md=5.14; Gp3: Md=5.86 vs Gp6: Md=4.86; Gp4: Md=5.50 vs Gp6: Md=4.86). By implication, the older age groups have a diminished need for professional registration or autonomy.
the younger age generation needs more exposure than the older age generation.
With regard to qualification, a Kruskal-Wallis test revealed no statistically significant difference (p=0.15) in the average of the importance of self-development needs across 8 different qualification categories, where Ql1, n=9: Matriculation certificate; Ql2, n=26: Diploma; Ql3, n=42: Bachelor degree; Ql4, n=32: Honours degree; Ql5, n=13: Postgraduate diploma; Ql6, n=34: Masters degree; Ql7, n=7: Doctorate degree, and Ql8, n=8: Others unspecified. The Postgraduate diploma category recorded the highest median score (6.00), while the Honours degree category recorded the lowest median value of 5.07.
With regard to experience, a Kruskal-Wallis test revealed no statistically significant differences (p=0.06) in the average of the importance of self-development needs across 3 different experience categories in the construction industry categories, where Exp1, n=8: less than 5 years; Exp2, n=36: 5-10 years, and Exp3, n=120: over 10 years. The experience category (5-10 years) recorded the highest median score (5.86), while the over 10 years’ experience category recorded the lowest median value of 5.29. With regard to the experience in the construction industry, there was no statistically significant difference in statements such as the maintenance of performance to secure employment, the approval of professional performance by peers, the aspiration to be a well-known professional figure, and the development of area of expertise through challenging tasks. However, other statements such as the aspiration for promotion, and the desire to become a renowned mentor of others in construction revealed a statistically significant difference.
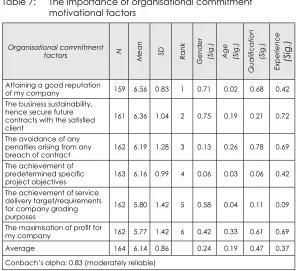
Table 7: The importance of organisational commitment motivational factors
Organisational commitment
factors N Mean SD Rank
Gender (Sig.) Age (Sig.)
Qualification
(Sig.)
Experience (Sig.)
Attaining a good reputation
of my company 159 6.56 0.83 1 0.71 0.02 0.68 0.42
The business sustainability, hence secure future contracts with the satisfied client
161 6.36 1.04 2 0.75 0.19 0.21 0.72
The avoidance of any penalties arising from any
breach of contract 162 6.19 1.28 3 0.13 0.26 0.78 0.69 The achievement of
predetermined specific
project objectives 163 6.16 0.99 4 0.06 0.03 0.06 0.42 The achievement of service
delivery target/requirements for company grading purposes
162 5.80 1.42 5 0.58 0.04 0.11 0.09
The maximisation of profit for
my company 162 5.77 1.42 6 0.42 0.33 0.61 0.69
Average 164 6.14 0.86 0.24 0.19 0.47 0.37
Conbach’s alpha: 0.83 (moderately reliable)
From Table 7, it is evident that attaining a good reputation of the company (6.56), business sustainability (6.36), and the avoidance of any penalties arising from any breach of the contract (6.19) had the highest mean scores. This suggests that construction and professional team members care about the business of their employing organisations. Once their employing organisations are successful, they also become successful. The average mean of 6.14 demonstrates the state of high importance of organisational commitment towards achieving higher job performance.
With regard to gender, a Mann-Whitney U-Test revealed no statistically significant difference (p=0.24) in the average of importance of organisational commitment levels of males (Md=6.33, n=132) and females (Md=6.50, n=32).
[image:20.421.55.352.59.330.2]organisational commitment across 6 different age groups, where Gp1, n=1: under 25 years; Gp2, n=14: 26-30 years; Gp3, n=39: 31-40 years; Gp4, n=34: 41-40 years; Gp5, n=42: 51-60 years, and Gp6, n=34: over 60 years. The 25-30 years age group recorded the highest median score (6.58), while the younger age group recorded the lowest median value of 4.50. From a post-hoc test, it was evident that the middle age group’s desire to attain a good reputation of their companies was more important than that of the younger and older age groups. Therefore, the desire to bring the company to reputation grows from the younger age; it peaks in the middle age, but fades as one grows older. By implication, there might be fewer younger age generation (under 25 years) individuals owning companies than middle age groups; or else, middle age might be more loyal than the younger age. The fact that the younger age is not concerned a great deal with the attainment of the reputation of their employing companies could be an indication of the instability in their work place. With regard to qualification, a Kruskal-Wallis test revealed no statistically significant difference (p=0.47) in the average of the importance of organisational commitment across 8 different qualification categories, where Ql1, n=9: Matriculation certificates; Ql2, n=26: Diploma; Ql3, n=42: Bachelor degree; Ql4, n=32: Honours degree; Ql5, n=13: Postgraduate diploma; Ql6, n=34: Masters degree; Ql7, n=7: Doctorate degree, and Ql8, n=8: Others unspecified. The Postgraduate diploma category recorded the highest median score (6.67), while the Doctorate degree category recorded the lowest median value of 6.00.
With regard to experience, a Kruskal-Wallis test revealed no statistically significant differences in the average of the importance of organisational commitment across 3 different experience categories in the construction industry, where Exp1, n=8: less than 5 years; Exp2, n=36: 5-10 years; Exp3, n=120: over 10 years, and p=0.37. The 5-10 years’ experience category recorded the highest median score (6.42), while the less than 5 years’ experience category recorded the lowest median value of 6.17.
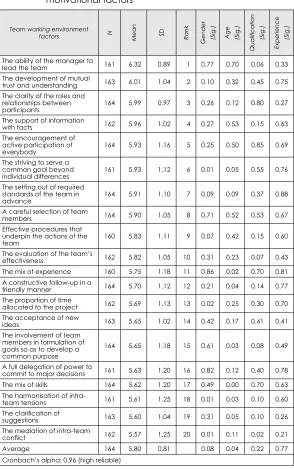
Table 8: The importance of team working environment motivational factors
Team working environment
factors N Mean SD Rank
Gender (Sig.) Age (Sig.)
Qualification
(Sig.)
Experience
(Sig.)
The ability of the manager to
lead the team 161 6.32 0.89 1 0.77 0.70 0.06 0.33
The development of mutual
trust and understanding 163 6.01 1.04 2 0.10 0.32 0.45 0.75
The clarity of the roles and relationships between
participants 164 5.99 0.97 3 0.26 0.12 0.80 0.27
The support of information
with facts 162 5.96 1.02 4 0.27 0.53 0.15 0.63
The encouragement of active participation of
everybody 164 5.93 1.16 5 0.25 0.50 0.85 0.69
The striving to serve a common goal beyond
individual differences 161 5.93 1.12 6 0.01 0.05 0.55 0.76
The setting out of required standards of the team in
advance 164 5.91 1.10 7 0.09 0.09 0.37 0.88
A careful selection of team
members 164 5.90 1.05 8 0.71 0.52 0.53 0.67
Effective procedures that underpin the actions of the
team 160 5.83 1.11 9 0.07 0.42 0.15 0.60
The evaluation of the team’s
effectiveness 162 5.82 1.05 10 0.31 0.23 0.07 0.43
The mix of experience 160 5.75 1.18 11 0.86 0.02 0.70 0.81
A constructive follow-up in a
friendly manner 164 5.70 1.12 12 0.21 0.04 0.14 0.77
The proportion of time
allocated to the project 162 5.69 1.13 13 0.02 0.25 0.30 0.70
The acceptance of new
ideas 163 5.65 1.02 14 0.42 0.17 0.41 0.41
The involvement of team members in formulation of goals so as to develop a common purpose
164 5.65 1.18 15 0.61 0.03 0.08 0.49
A full delegation of power to
commit to major decisions 161 5.63 1.20 16 0.82 0.12 0.40 0.78
The mix of skills 164 5.62 1.20 17 0.49 0.00 0.70 0.63
The harmonisation of
intra-team tensions 161 5.61 1.25 18 0.01 0.03 0.10 0.60
The clarification of
suggestions 163 5.60 1.04 19 0.31 0.05 0.10 0.26
The mediation of intra-team
conflict 162 5.57 1.25 20 0.01 0.11 0.02 0.21
Average 164 5.80 0.81 0.08 0.04 0.22 0.77
[image:22.421.58.352.72.542.2]From Table 8, it is evident that the ability of the manager to lead the team (6.32), the development of mutual trust and understanding (6.01), and the clarity of the roles and relationships between participants (5.99) had the highest mean scores. This reveals that the role of the project manager is of utmost importance in achieving successful project delivery. In addition, good relationships between project participants would create a working environment conducive to enhancing higher performance in a construction project. The average mean of 5.80 demonstrates the state of high importance of the team working environment towards achieving higher job performance.
With regard to gender, a Mann-Whitney U-Test revealed no statistically significant difference (p=0.08) in the average of the importance of team working environment levels of males (Md=5.80, n=132) and females (Md=6.13, n=32). A statistically significant difference between gender groups was found in statements such as the harmonisation of intra-team tensions, the mediation of intra-team conflict, the striving for serving a common goal beyond individual differences, and the proportion of time allocated to the project. Most obviously, the team working environment should be gender sensitive in such identified issues.
With regard to qualification, a Kruskal-Wallis test revealed no statistically significant difference (p=0.22) in the average of the importance of team working environment across 8 different qualification categories, where Ql1, n=9: Matriculation certificate; Ql2, n=26: Diploma; Ql3, n=42: Bachelor degree; Ql4, n=32: Honours degree; Ql5, n=13: Postgraduate diploma; Ql6, n=34: Masters degree; Ql7, n=5: Doctorate degree, and Ql8, n=2: Others unspecified. The Matriculation certificate qualification recorded the highest median score (6.80), while the Doctorate degree qualification recorded the lowest median value of 5.65.
With regard to experience, a Kruskal-Wallis test revealed no statistically significant difference (p=0.77) in the average of the importance of team working environment across 3 different experience categories in the construction industry, where Exp1, n=8: less than 5 years; Exp2, n=36: 5-10 years, and Exp3, n=120: over 10 years. The 5-10 years’ experience category recorded the highest median score (5.95), while the less than 5 years’ experience category recorded the lowest median value of 5.78.
The analysis of Hypothesis 1, “Age, experience, qualification and gender do not result in statistically significant differences in construction and consultant team members’\’ perceptions of the importance of motivational factors” showed no statistically significant difference in the majority of the demographic groups. However, a statistically significant difference was found in age for self-development needs and team working environment.
7.3 Hypothesis 2: Monetary incentives
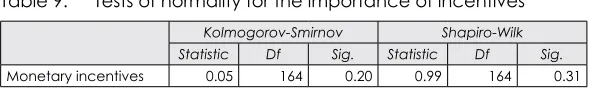
Table 9 shows the output of normality test on the importance of monetary incentives. Based on Shapiro-Wilk, the significance level of 0.31 shows that assumption of normality was not violated; thus, the hypothesis was computed using parametric tests, namely T-test and ANOVA.
Table 9: Tests of normality for the importance of incentives
Kolmogorov-Smirnov Shapiro-Wilk
Statistic Df Sig. Statistic Df Sig.
Monetary incentives 0.05 164 0.20 0.99 164 0.31
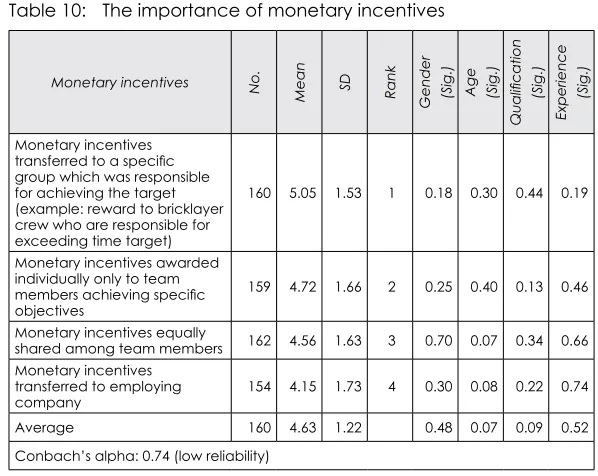
Table 10 shows the individual mean scores of the variables related to monetary incentives into a single mean score with a low Cronbach’s
[image:24.421.57.352.441.485.2]construction and consultant team members’ perceptions of the importance of monetary incentives needs to motivate them to achieve higher performance.
Table 10: The importance of monetary incentives
Monetary incentives No.
Mean SD Rank Gender (Sig.) Age (Sig.)
Qualification
(Sig.)
Experience
(Sig.)
Monetary incentives transferred to a specific group which was responsible for achieving the target (example: reward to bricklayer crew who are responsible for exceeding time target)
160 5.05 1.53 1 0.18 0.30 0.44 0.19
Monetary incentives awarded individually only to team members achieving specific objectives
159 4.72 1.66 2 0.25 0.40 0.13 0.46
Monetary incentives equally
shared among team members 162 4.56 1.63 3 0.70 0.07 0.34 0.66 Monetary incentives
transferred to employing
company 154 4.15 1.73 4 0.30 0.08 0.22 0.74
Average 160 4.63 1.22 0.48 0.07 0.09 0.52
Conbach’s alpha: 0.74 (low reliability)
From Table 10, it is evident that monetary incentives transferred to a specific group which was responsible for achieving the target (5.05), monetary incentives awarded individually only to team members achieving specific objectives (4.72), and monetary incentives equally shared among team members (4.76) had the highest mean scores. The average mean of 4.63 demonstrates the state of moderate importance of monetary incentives towards achieving successful project delivery. It is evident that the study produced the low reliable score of 0.74. Given that Cronbach’s alpha coefficient is sensitive to the number of items in the scale, Pallant (2010: 97) advises that the coefficient of reliability with the value of 0.5 in scales with fewer than 10 items is common. The reliability score of 0.74 is acceptable, given that the reliability test was conducted on 4 items.
With regard to age, the ANOVA test revealed a statistically significant difference (p=0.07) in the average of the importance of monetary incentives across 6 different age groups, where Gp1: less than 25 years; Gp2: 25-30 years; Gp3: 31-40 years; Gp4: 41-50 years, Gp5: 51-60 years, and Gp6: over 60 years. The 41-50 years age group recorded the highest mean score (5.19), while the younger age group recorded the lowest mean score of 3.75.
With regard to qualification, the ANOVA test revealed a statistically significant difference (p=0.09) in the average of the importance of monetary incentives across 8 groups: Ql1: Matriculation certificate; Ql2: Diploma; Ql3: Bachelor degree; Ql4: Honours degree; Ql5: Postgraduate diploma; Ql6: Masters degree; Ql7: Doctorate degree, and Ql8: Others unspecified. The Matriculation certificate group recorded the highest mean score (5.58), while the Honours degree group recorded the lowest mean score of 3.75.
With regard to experience, the ANOVA test revealed a statistically significant difference (p=0.52) in the average of the importance of monetary incentives across 3 groups: Exp1: less than 5 years; Exp2: 5-10 years, and Exp3: over 10 years. The less than 5 years’ experience group recorded the highest mean score (4.94) and the over 10 years’ experience group recorded the lowest mean score (4.57).
The analysis of Hypothesis 2, “Age, experience, qualification and gender do not result in statistically significant differences in construction and consultant team members’ perceptions of the importance of monetary incentives”, showed no statistically significant difference in the majority of the demographic groups. However, a statistically significant difference was found in age and experience in the construction industry.
7.4 Hypothesis 3: Priority project objectives to be aligned with monetary incentives
Table 11: Project objectives aligned with monetary incentives
Project objectives No. Mean SD Rank
Reliability Number
of items per question
Cronbach’s
alpha Comments
Primary project objectives
Time 158 5.25 1.48 1 11 0.97 Highly reliable
Quality 157 5.12 1.54 2 15 0.99 Highly reliable
Cost 159 5.09 1.40 3 13 0.97 Highly reliable
Secondary project objectives Health (HIV/AIDS)
and safety 152 4.76 1.90 4 7 0.98 Highly reliable
Skills transfer 153 4.30 1.66 5 7 0.94 Highly reliable Poverty alleviation 151 4.18 1.81 6 10 0.98 Highly reliable Provision of work
opportunities to
SMMEs 150 3.88 1.81 7 5 0.95
Highly reliable Gender and racial
equality 150 3.68 1.73 8 8 0.98 Highly reliable
Average 154 4.52 1.31
From Table 11, it is evident that primary project objectives such as time (5.25), quality (5.12) and cost (5.09) had average mean scores above 5. This scoring demonstrates the state of higher importance of offering monetary incentives towards achieving primary project objectives. Secondary project objectives such as health (HIV/AIDS) and safety (4.76), skills transfer (4.30), poverty alleviation (4.18), provision of work opportunities to SMMEs (3.88), and gender and racial equality (3.68) had average mean scores below 5. This scoring demonstrates the state of moderate importance of offering monetary incentives towards achieving secondary project objectives.
of the PCA is to retain components with relatively large eigenvalue and ignore those with relatively small eigenvalues. The PCA, as shown in Table 13, revealed the presence of two components (SMMEs and Health) with eigenvalues exceeding 1, explaining 57.90% and 15.52% of the variance, respectively.
Table 12: Kaiser-Meyer-Olkin Measure and Bartlett’s Test
Kaiser-Meyer-Olkin and Bartlett’s Test
Kaiser-Meyer-Olkin Measure of sampling adequacy 0.88
Bartlett’s Test of sphericity
Approximate Chi-Square 709.34
Df 28.00
[image:28.421.57.351.233.429.2]Sig. 0.00
Table 13: Total variance explained
Component
Initial Eigenvalues Extraction sums of squared loadings squared loadingsRotation sums of
Total
% of variance Cumulative %
Total
% of variance Cumulative %
Total
% of variance Cumulative % SMMEs 4.63 57.90 57.90 4.63 57.90 57.90 3.22 40.24 40.242 Health 1.24 15.52 73.42 1.24 15.52 73.42 2.65 33.18 73.418
Skills 0.56 7.00 80.42
Poverty 0.47 5.81 86.23
Gender 0.39 4.87 91.11
Time 0.33 4.11 95.22
Cost 0.25 3.09 98.31
Quality 0.13 1.69 100.00
15 showed that all values were above 0.3, with gender displaying the lowest value of 0.56. This confirms that there was no need to refine the scale (Pallant, 2010: 198).
Table 14: Component score covariance matrix
Component 1 2
SMMEs 1.00 0.00
Health 0.00 1.00
Table 15: Rotated component and component score coefficient
matrices
Component
Rotated component
matrix Component score coefficient matrix Communalities
Component Component
1 2 1 2 Extracted
SMMEs 0.82 0.31 -0.10 0.74
Health 0.79 0.31 -0.13 0.66
Skills 0.78 0.30 -0.12 0.63
Poverty 0.77 0.27 -0.06 0.68
Gender 0.68 0.31 0.22 -0.02 0.56
Time 0.91 -0.14 0.43 0.90
Cost 0.89 -0.17 0.44 0.83
Quality 0.38 0.85 -0.07 0.37 0.87
With regard to the decision concerning the number of factors to be retained, Pallant (2010: 184) proposes Kaiser’s criterion, scree test, and parallel analysis. Kaiser’s criterion consists of retaining only factors with the eigenvalue of 1.0 or more. In this article, Kaiser’s criterion was used to select factors to be retained. Only 2 factors exceeded 1; it was thus not deemed necessary to use further decision-making methods such as a scree test or parallel analysis.
The analysis of Hypothesis 3 consisted of dimension reduction, testing the importance of monetary incentives aligned with 8 project objectives in terms of their achievement of a project success using a principal component analysis. Results showed that the provision of work opportunities to SMMEs, and the focus on health (HIV/AIDS) and safety objectives need to be prioritised, and the provision of monetary incentives would yield positive results. A comprehensive model can be developed from priority project objectives which construction and consultant team members agree upon, if aligned with monetary incentives.
8.
Model layout and conclusions
Figure 3 is a model developed from the combination of the PCA on project objectives aligned with monetary incentives, test results of significant differences of motivational factors as tension agents and incentives as activation agents.
[image:30.421.56.303.335.531.2]From the PCA output, it is evident that secondary project objectives (SMMEs, health and safety, skills, poverty, gender) are located on the left hand side, and primary project objectives (cost, time, quality) are located on the right hand side. From the model, it is evident that monetary incentives should be given priority in order to achieve the provision of work to SMMEs and health (HIV/AIDS) and safety project objectives (see Table 15).
The CIDB (2010b: 1) indicated that there is a compelling need to unlock growth and to develop sustainable contracting capacity, as well as to enhance the development of previously disadvantaged individuals and enterprises. In order to unlock such growth strengths, the government has initiated the National Contractor Development Programme (NCDP) spearheaded by the CIDB, national and provincial public works and other willing stakeholders to enhance the capacity, and promote the equity ownership across different contracting categories and grades, as well as to improve skills and performance in the delivery of capital works and maintenance across the public sector (CIDB, 2010b: 3). The CIDB (2010b: 9) proposes many contractor development components, in which the provision of work opportunities to SMMEs falls under the component focusing on contracting enterprise development contractor grades 3 to 6. While the provision of work opportunities to construction SMMEs is done through direct contract and joint ventures, the study revealed that there is a need for the provision of monetary incentives in order to achieve this objective. By implication, mentoring lower grade contractors may negatively affect the business efficiency of the higher grade contractors. The CIDB (2010c: 5) proposes that the cost of training, mentoring and programme overheads be included when evaluating the cost of contractor development as follows:
• Grade 1 contractor: R50 000 per year, and • Grades 2 to 6 contractor: R100 000 per year.
diminished need to focus on team working environment, care should be taken to avoid age-related problems.
The PCA also reveals that monetary incentives should be regarded as important in order to achieve health (HIV/AIDS) and safety objectives. Arguably, this could be a signal raising the concern about the status of health and safety in the South African construction industry; typically, claiming that monetary losses incurred due to health and safety might be recovered in one way or another. In fact, Mthalane, Othman & Pearl (2008: 5) complain that unsafe and unhealthy working conditions have still taken an economic toll at the start of the 21st century. In addition, Kyereh & Hoffman (2008: 45) indicate that HIV/AIDS results in increased costs for a company in the form of insurance, cover, retirement fund claims, health and safety claims, medical assistance, increased demand for training, recruitment and funeral costs. The findings suggest that monetary incentives be offered towards compliance with H&S standards, the achievement of H&S requirements, and the induction programme on H&S, prior to commencing the project. While it could be argued that the provision of monetary incentives may compromise health and safety ethics, monetary incentives may be administered in a strict way in order to achieve health and safety targets. For example, Dean (2010: 38) points out that the employers who implement prescribed health and safety improvements in their work places must receive a rebate on premiums. In the short run, monetary incentives may work well in order to achieve secondary project objectives. However, it may be suggested that other intervention measures be initiated from various construction stakeholders in order to enhance a successful project delivery.
9. Recommendations
In the short-run, monetary incentives should be prioritised in order to achieve secondary project objectives (the provision of work opportunities to SMMEs, health and safety, skills transfer, poverty alleviation, and gender and racial equality) as opposed to primary project objectives (cost, time, quality), of which the achievement would not necessarily involve monetary incentives.
policy makers and regulatory bodies would be required to review policies from time to time. The study revealed that age group-related differences emanate from the inherited colonial leadership styles; therefore, construction firms are required to conduct seminars and workshops to harmonise the differences between age groups. Qualification-related group differences may be settled in partnership between employing organisations and learning institutions to design tailor-made courses for bridging the gap between the qualification levels. In-house training within companies may also fill the gap. Problems related to experience in the construction industry should be addressed through a joint effort between the employing companies and built-environment professional bodies in order to identify and fill the gap.
Further studies should investigate to what extent construction-related organisations are committed to promoting motivational factors at both organisation and project level. In addition, further studies should be conducted to determine any possible gender imbalances affecting work performance, career development and professional registration. While the test for the significant difference between groups was based on the respondents’ demographics, further studies could focus on grouping them according to their professional affiliations.
References list
Abdi, H. & Williams, L.J. 2010. Principal component analysis. Wiley Interdisciplinary Reviews: Computational Statistics, 2(4), pp. 433-459. Ali, A.S. & Kamaruzzaman, S.N. 2010. Cost performance for building construction projects in Klang Valley. Journal of Building Performance,
1(1), pp. 110-118.
Alwi, S. & Hampson, K. 2003. Identifying the important causes of delays in building construction projects. In: Proceedings of the 9th East
Asia-Pacific Conference on Structural Engineering and Construction, Bali, Indonesia, 16-18 December 2003. [online]. Available from: <http:// eprints.qut.edu.au/4156/1/4156.pdf> [Accessed: 11 October 2012]. Bowen, P.A., Cattell, K.S., Hall, K.A. & Pearl, R.G. 2002. Perceptions of time, cost and quality management on building projects. The Australian Journal of Construction Economics and Building, 2(2), pp. 48-56.
Burns, R.B. 2000. Introduction to research methods. London: Sage Publications.
Carifio, J. & Perla, R.J. 2007. Ten common misunderstandings, misconceptions, persistent myths and urban legends about Likert scales and Likert response formats and their antidotes. Journal of Social Sciences, 3(3), pp. 106-116.
CETA (Construction Education and Training Authority). 2008. Construction Education and Training Authority. [online]. Available from: <http://www.ceta.org.za/> [Accessed: 14 June 2011].
Chan, S.L. & Park, M. 2005. Project cost estimation using principal component regression. Construction Management and Economics,
23(3), pp. 295-304.
CIDB (Construction Industry Development Board). 2004a. Construction Procurement - Methods and Procedures for Implementing Preferential Procurement Policies, Best Practice Guideline # B2, 1st edition of CIDB document 1008.
CIDB (Construction Industry Development Board). 2004b. Construction Procurement – Joint Venture Arrangements, Best Practice Guideline # D2, 1st edition of CIDB document 1013.
CIDB (Construction Industry Development Board). 2008. Specification for social and economic deliverables in construction works contracts, Version 2. Pretoria: CIDB Publications.
CIDB (Construction Industry Development Board). 2010a. Delivery management guidelines practice guideline 2: Construction procurement strategy, Version 9-1. Pretoria: CIDB Publications.
CIDB (Construction Industry Development Board). 2010b. National Contractor Development Programme (NCDP) Framework: 2012 and beyond. Pretoria: CIDB Publications.
CIDB (Construction Industry Development Board). 2010c. Targeting for Contractor Development Programmes: Background. Pretoria: CIDB Publications.
Collins, C., Emsell, P. & Haydon, J. 2011. Leadership and management development. New York: Oxford University Press.
Dean, T. 2010. Expert Advisory Panel on Occupational Health and Safety: Report and recommendations to the minister of labour, Toronto. [online]. Available from: <http://www.labour.gov.on.ca/ english/hs/pdf/eap_report.pdf> [Accessed: 10 October 2013]. DTI (Department of Trade and Industry). 2003. South Africa’s economic transformation: A strategy for broad-based Black Economic Empowerment. DTI online publications. [online]. Available from: <http://www.economic.gov.za/bee/complete.pdf> [Accessed: 23 May 2011].
Fellows, R. & Liu, A. 2008. Research methods for construction. 3rd edition. West Sussex: Wiley-Blackwell.
Field, A. 2013. Discovering statistics using IBM SPSS statistics. 4th edition. London: Sage Publications.
Freeman-Bell, G. & Balkwill, J. 1996. Management in engineering: Principles and practice. 2nd edition. London: Prentice Hall.
French, R., Rayner, C., Rees, G. & Rumbles, S. 2008. Organizational behaviour. Barcelona: John Wiley & Sons.
Gliem, J.A. & Gliem, R.R. 2003. Calculating, interpreting, and reporting Cronbach’s alpha reliability coefficient for Likert-type scales. In:
21th Annual Midwest Research-to-Practice Conference on Adult,
Continuing, and Community Education, 8-10 October, Columbus OH, pp. 82-88.
Gravetter, F.J. & Wallnau, L.B. 2009. Statistics for the behavioral sciences. 8th edition. Belmont: Wadsworth Cengage Learning.
Hill, S.S. & Howlett, H.A. 2009. Success in practical nursing: From student to leader. 5th edition. Missouri: Elsevier Saunders.
Howard, W.E. 1996. Innovation strategies for compensation of engineering and construction contractors. Unpublished dissertation (Ph.D.). Clemson, SC: Clemson University.
Hyde, K.F. 2000. Recognising deductive process in qualitative research. Qualitative Market Research: An International Journal, 3(2), pp. 82-89.
Knutson, K., Schexnayder, C.J., Fiori, C. & Mayo, R.E. 2004.
Construction management fundamentals. New York: McGraw-Hill
Kyereh, K.T. & Hoffman, D.J. 2008. The impact of HIV/AIDS on skills availability in South African coal mines. In: Verster, J.J.P & Marx, H.J. (eds). Proceedings of the 5th Post Graduate Conference on
Construction Industry Development: Construction as a cornerstone
for economic growth and development, 16-18 March 2008,
Bloemfontein, South Africa, pp. 43-52.
Leedy, P.D. & Ormrod, J.E. 2010. Practical research: Planning and design. 9th edition. Boston: Pearson Education.
Maree, K. & Pietersen, J. 2007. Surveys and the use of questionnaires. In: Maree, K. (ed.). First steps in research. Pretoria: Van Schaik Publishers, pp. 155-170.
Mbachu, J.I.C. & Nkado, R.N. 2004. Reducing building construction costs: The view of consultants and contractors. In: Ellis, R. & Bell, M. (eds) CD-ROM Proceedings of the international Construction Research Conference of the Royal Institution of Chartered Surveyors, COBRA,
7-8 September 2004, Leeds, United Kingdom, pp. not numbered. Meyer, E., Ashleigh, M., George, J.M. & Jones, G.R. 2007. Contemporary management. London: McGraw-Hill.
MSG Experts. 2012. Management study guide experts: Organisational behavior. [online]. Available from: <http://www. managementstudyguide.com/what_is_motivation.htm> [Accessed: 22 August 2012].
Mthalane, D., Othman, A.A.E. & Pearl, R.G. 2008. The economic and social impacts of site accidents on the South African society. In: Verster, J.J.P & Marx, H.J. (eds). Proceedings of the 5th Post Graduate
Conference on Construction Industry Development: Construction as a cornerstone for economic growth and development, 16-18 March 2008, Bloemfontein, South Africa, pp. 1-10.
Murdoch, J. & Hughes, W. 2008. Construction contracts: Law and management. London: Taylor & Francis.
National Treasury. 2001. Media release on the Regulations of the Preferential Procurement Policy Framework Act, No. 5 of 2000. [online]. Available from: <http://www.treasury.gov.za/legislation/pfma/ supplychain/PPPFA%20-%20media.pdf> [Accessed: 2 June 2011]. Oberlender, G.D. 1993. Project management for engineering and construction. New York: McGraw-Hill.
Pallant, J. 2010. SPSS survival manual: A step-by-step guide to data analysis using the SPSS program. 4th edition. Berkshire: McGraw Hill. Peterson, T.M. 2007. Motivation: How to increase project team performance. Project Management Journal, 38(4), pp. 60-69.
Rao, V.S.P. 2009. Organisational behaviour. New Delhi: Excel Books. Rose, T. & Manley, K. 2011. Motivation toward financial incentive goals on construction projects. Journal of Business Research, 64(7), pp. 765-773.
SAHO (South African History Online). 2011. Women in South African history. [online]. Available from: <http://www.sahistory.org.za/pages/ governence-projects/womens-struggle/index.htm> [Accessed: 1 June 2011].
Saqib, M., Farooqui, R. & Lodi, S.H. 2008. Assessment of critical success factors for construction projects in Pakistan. In: Proceedings of the first International Conference on Construction Development in Developing Countries (ICCIDC-I), Karachi, Pakistan, 4-5 August, pp. 392-404.
Sarantakos, S. 1997. Social research. 2nd edition. New York: Palgrave. SAS. 2011. SAS online. Principal component analysis. Available from: <http://support.sas.com/publishing/pubcat/chaps/55129.pdf> [Accessed: 26 September 2001].
Schermerhorn, J.R., Hunt, J.G. & Osborn, R.N. 2005. Organisational behavior. 9th edition. New York: John Wiley & Sons.
Slocum, J.W. & Hellriegel, D. 2007. Fundamentals of organisational behavior. China, South-Western: Thomson.
Smallwood, J. & Haupt, T. 2005. The need for construction Health and Safety (H&S) and the Construction Regulations: Engineer’s perceptions. Journal of the South African Institution of Civil Engineering, 47(2), pp. 2-8.
South Africa. 1993. Occupational Health and Safety Act, Act No. 85 of 1993. Pretoria: Government Printer.
South Africa. 1998. Skills Development Act, Act No. 97 of 1998. Pretoria: Government Printer.
Struwig, F.W. & Stead, G.B. 2001. Planning, design and reporting research. Cape Town: Pearson Education South Africa.
Tang, W., Qiang, M., Duffield, C.F., Young, D.M. & Lu, Y. 2010. Incentives in the Chinese construction industry. Journal of Construction Engineering and Management, 134(7), pp. 457-467.
Van Wyk, L. 2004. A review of the South African construction industry – Part 3: The built environment professions, CSIR (BOUTEK).
Walker, A. 2002. Project management in construction. 4th edition. Oxford: Blackwell Publishing.
Werner, A. 2007. Organisational behaviour. 2nd edition. Pretoria: Van Schaik Publishers.
Williams, C.R. 2009. Principles of management. 5th edition. Mason, Ohio: South-Western Cengage Learning.