Testing for Significance of Increased Correlation with Human Judgment
Yvette Graham Timothy Baldwin
Department of Computing and Information Systems The University of Melbourne
[email protected], [email protected]
Abstract
Automatic metrics are widely used in ma-chine translation as a substitute for hu-man assessment. With the introduction of any new metric comes the question of just how well that metric mimics human assessment of translation quality. This is often measured by correlation with hu-man judgment. Significance tests are gen-erally not used to establish whether im-provements over existing methods such as BLEU are statistically significant or have
occurred simply by chance, however. In this paper, we introduce a significance test for comparing correlations of two metrics, along with an open-source implementation of the test. When applied to a range of metrics across seven language pairs, tests show that for a high proportion of metrics, there is insufficient evidence to conclude significant improvement over BLEU.
1 Introduction
Within machine translation (MT), efforts are on-going to improve evaluation metrics and find bet-ter ways to automatically assess translation qual-ity. The process of validating a new metric in-volves demonstration that it correlates better with human judgment than a standard metric such as BLEU (Papineni et al., 2001). However, although
it is standard practice in MT evaluation to mea-sure increases in automatic metric scores with sig-nificance tests (Germann, 2003; Och, 2003; Ku-mar and Byrne, 2004; Koehn, 2004; Riezler and Maxwell, 2005; Graham et al., 2014), this has not been the case in papers proposing new met-rics. Thus it is possible that some reported im-provements in correlation with human judgment are attributable to chance rather than a systematic improvement.
In this paper, we motivate and introduce a novel significance test to assess the statistical signifi-cance of differences in correlation with human judgment for pairs of automatic metrics. We ap-ply tests to the WMT-12 shared metrics task to
compare each of the participating methods, and find that for a high proportion of metrics, there is not enough evidence to conclude that they signifi-cantly outperform BLEU.
2 Correlation with Human Judgment A common means of assessing automatic MT evaluation metrics is Spearman’s rank correlation with human judgments (Melamed et al., 2003), which measures the relative degree of monotonic-ity between the metric and human scores in the range [−1,1]. The standard justification for cal-culating correlations over ranks rather than raw scores is to: (a) reduce anomalies due to absolute score differences; and (b) focus evaluation on what is generally the primary area of interest, namely the ranking of systems/translations.
An alternative means of evaluation is Pearson’s correlation, which measures the linear correlation between a metric and human scores (Leusch et al., 2003). Debate on the relative merits of Spear-man’s and Pearson’s correlation for the evaluation of automatic metrics is ongoing, but there is an in-creasing trend towards Pearson’s correlation, e.g. in the recent WMT-14 shared metrics task.
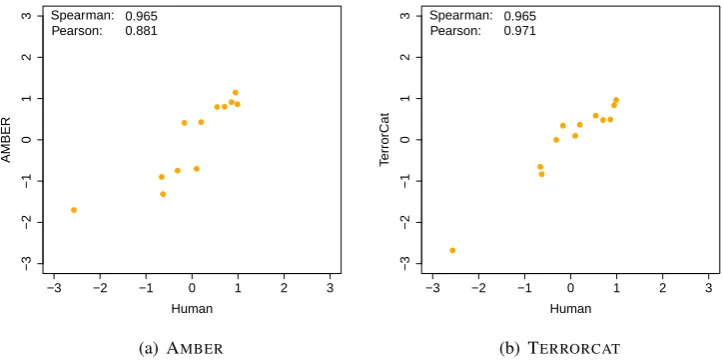
Figure 1 presents the system-level results for two evaluation metrics – AMBER (Chen et al.,
2012) and TERRORCAT (Fishel et al., 2012)
– over the WMT-12 Spanish-to-English metrics
task. These two metrics achieved the joint-highest rank correlation (ρ = 0.965) for the task, but dif-fer greatly in terms of Pearson’s correlation (r =
0.881vs.0.971, resp.). The largest contributor to
this artifact is the system with the lowest human score, represented by the leftmost point in both plots.
● ●
● ●
● ● ● ●
● ●
●
●
−3 −2 −1 0 1 2 3
−3
−2
−1
0
1
2
3
Human
AMBER
Spearman: 0.965 Pearson: 0.881
(a) AMBER
● ●
● ●
● ● ● ●
● ●
●
●
−3 −2 −1 0 1 2 3
−3
−2
−1
0
1
2
3
Human
T
errorCat
Spearman: 0.965 Pearson: 0.971
[image:2.595.113.475.81.261.2](b) TERRORCAT
Figure 1: Scatter plot of human and automatic scores of WMT-12 Spanish-to-English systems for two
MT evaluation metrics (AMBERand TERRORCAT)
Consistent with the WMT-14 metrics shared
task, we argue that Pearson’s correlation is more sensitive than Spearman’s correlation. There is still the question, however, of whether an observed difference in Pearson’sris statistically significant, which we address in the next section.
3 Significance Testing
Evaluation of a new automatic metric, Mnew,
commonly takes the form of quantifying the cor-relation between the new metric and human judg-ment,r(Mnew, H), and contrasting it with the
cor-relation for some baseline metric,r(Mbase, H). It
is very rare in the MT literature for significance testing to be performed in such cases, however. We introduce a statistical test which can be used for this purpose, and apply the test to the evalua-tion of metrics participating in the WMT-12 metric
evaluation task.
At first gloss, it might seem reasonable to per-form significance testing in the following man-ner when an increase in correlation with human assessment is observed: apply a significance test separately to the correlation of each metric with human judgment, with the hope that the newly proposed metric will achieve a significant correla-tion where the baseline metric does not. However, besides the fact that the correlation between al-most any document-level metric and human judg-ment will generally be significantly greater than zero, the logic here is flawed: the fact that one correlation is significantly higher than zero
(r(Mnew, H)) and that of another is not, does not
necessarily mean that thedifference between the two correlations is significant. Instead, a specific test should be applied to the difference in corre-lations on the data. For this same reason, con-fidence intervals for individual correlations with human judgment are also not particularly mean-ingful.
In psychological studies, it is often the case that samples that data are drawn from are independent, and differences in correlations are computed on in-dependent data sets. In such cases, the Fisherr
to z transformation is applied to test for signifi-cant differences in correlations. In the case of au-tomatic metric evaluation, however, the data sets used are almost never independent. This means that ifr(Mbase, H)andr(Mnew, H)are both>0,
the correlation between the metric scores them-selves, r(Mbase, Mnew), must also be > 0. The
strength of this correlation, directly between pairs of metrics, should be taken into account using a significance test of the difference in correlation be-tweenr(Mbase, H)andr(Mnew, H).
3.1 Correlated Correlations
T
errorCat
METEOR
Sagan
Sempos
P
osF
XEnErrCats WBErrCats
Amber
BErrCats
SimpBLEU BLEU.4cc
TER
TER BLEU−4cc SimpBLEU BErrCats Amber WBErrCats XEnErrCats PosF Sempos Sagan METEOR TerrorCat
(a) Pearson’s correlation
T
errorCat
METEOR
Sagan
Sempos
P
osF
XEnErrCats WBErrCats
Amber
BErrCats
SimpBLEU BLEU.4cc
TER
TER BLEU−4cc SimpBLEU BErrCats Amber WBErrCats XEnErrCats PosF Sempos Sagan METEOR TerrorCat
(b) Statistical significance
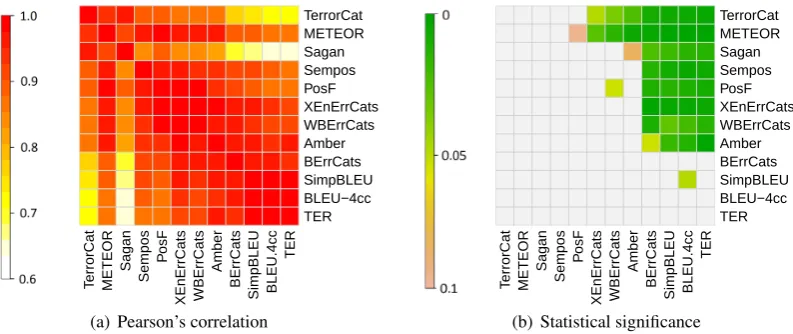
Figure 2: (a) Pearson’s correlation between pairs of automatic metrics; and (b) p-value of Williams significance tests, where a colored cell in rowi(named on y-axis), colj indicates that metrici(named on x-axis) correlates significantly higher with human judgment than metricj; all results are based on the WMT-12 Spanish-to-English data set.
1959)1evaluates significance in a difference in
de-pendent correlations (Steiger, 1980). It is formu-lated as follows, as a test of whether the population correlation betweenX1andX3equals the popula-tion correlapopula-tion betweenX2andX3:
t(n−3) = (r13−r23)
p
(n−1)(1 +r12)
q
2K((nn−−3)1) +(r23+r13)2
4 (1−r12)3 ,
where rij is the Pearson correlation between Xi
andXj,nis the size of the population, and:
K = 1−r122−r132−r232+ 2r12r13r23
The Williams test is more powerful than the equivalent for independent samples (Fisher r to
z), as it takes the correlations between X1 and
X2 (metric scores) into account. All else being equal, the higher the correlation between the met-ric scores, the greater the statistical power of the test.
4 Evaluation and Discussion
Figure 2a is a heatmap of the degree to which au-tomatic metrics correlate with one another when computed on the same data set, in the form of the Pearson’s correlation between each pair of met-rics that participated in the WMT-12 metrics task
for Spanish-to-English evaluation. Metrics are or-dered in all tables from highest to lowest correla-tion with human assessment. In addition, for the 1Also sometimes referred to as the Hotelling–Williams
test.
purposes of significance testing, we take the abso-lute value of all correlations, in order to compare error-based metrics with non-error based ones.
In general, the correlation is high amongst all pairs of metrics, with a high proportion of paired metrics achieving a correlation in excess of r =
0.9. Two exceptions to this are TERRORCAT
(Fishel et al., 2012) and SAGAN (Castillo and
Es-trella, 2012), as seen in the regions of yellow and white.
Figure 2b shows the results of Williams sig-nificance tests for all pairs of metrics. Since we are interested in not only identifying significant differences in correlations, but ultimately ranking competing metrics, we use a one-sided test. Here again, the metrics are ordered from highest to low-est (absolute) correlation with human judgment.
For the Spanish-to-English systems, approxi-mately 60% of WMT-12 metric pairs show a
sig-nificant difference in correlation with human judg-ment at p < 0.05 (for one of the two metric di-rections).2 As expected, the higher the correlation
with human judgment, the more metrics a given method is superior to at a level of statistical signifi-cance. Although TERRORCAT(Fishel et al., 2012)
achieves the highest absolute correlation with hu-man judgment, it is not significantly better (p ≥
0.05) than the four next-best metrics (METEOR
(Denkowski and Lavie, 2011), SAGAN (Castillo
and Estrella, 2012), SEMPOS(Mach´aˇcek and
Bo-2Correlation matrices (red) are maximally filled, in
[image:3.595.105.502.60.227.2]BLEU.4cc SimpBLEU Sempos Amber TER Sagan
METEOR TerrorCat BErrCats
XEnErrCats
P
osF
WBErrCats
WBErrCats PosF XEnErrCats BErrCats TerrorCat METEOR Sagan TER Amber Sempos SimpBLEU BLEU−4cc
(a) Czech-to-English
T
errorCat Sempos METEOR SimpBLEU BLEU.4cc
Amber P
osF
XEnErrCats
BErrCats
WBErrCats
TER
TER WBErrCats BErrCats XEnErrCats PosF Amber BLEU−4cc SimpBLEU METEOR Sempos TerrorCat
(b) French-to-English
Sempos
METEOR TerrorCat
Amber
BErrCats
P
osF
WBErrCats XEnErrCats SimpBLEU
TER
BLEU.4cc
BLEU−4cc TER SimpBLEU XEnErrCats WBErrCats PosF BErrCats Amber TerrorCat METEOR Sempos
(c) German-to-English
T
errorCat
EnXErrCats
Amber
BErrCats
WBErrCats BLEU.4cc
P
osF
SimpBLEU
TER
METEOR
METEOR TER SimpBLEU PosF BLEU−4cc WBErrCats BErrCats Amber EnXErrCats TerrorCat
(d) English-to-Spanish
EnXErrCats
BErrCats
SimpBLEU METEOR WBErrCats
Amber
BLEU.4cc TerrorCat
P
osF TER
TER PosF TerrorCat BLEU−4cc Amber WBErrCats METEOR SimpBLEU BErrCats EnXErrCats
(e) English-to-French
T
errorCat
SimpBLEU
P
osF
BErrCats
EnXErrCats
Amber TER WBErrCats BLEU.4cc METEOR
METEOR BLEU−4cc WBErrCats TER Amber EnXErrCats BErrCats PosF SimpBLEU TerrorCat
[image:4.595.77.517.60.363.2](f) English-to-German
Figure 3: Significance results for pairs of automatic metrics for each WMT-12 language pair.
jar, 2011) and POSF (Popovic, 2012)). There is
not enough evidence to conclude, therefore, that this metric is any better at evaluating Spanish-to-English MT system quality than the next four met-rics.
Figure 3 shows the results of significance tests for the six other language pairs used in the WMT
-12 metrics shared task.3 For no language pair
is there an outright winner amongst the met-rics, with proportions of significant differences be-tween metrics for a given language pair ranging from 3% for Czech-to-English to 82% for English-to-French (p <0.05). The number of metrics that significantly outperform BLEU for a given
lan-guage pair is only 34% (p <0.05), and no method significantly outperforms BLEU over all language
pairs – indeed, even the best methods achieve sta-tistical significance over BLEU for only a small
minority of language pairs. This underlines the dangers of assessing metrics based solely on cor-relation numbers, and emphasizes the importance of statistical testing.
It is important to note that the number of
com-3We omit English-to-Czech due to some metric scores
be-ing omitted from the WMT-12 data set.
peting metrics a metric significantly outperforms should not be used as the criterion for ranking competing metrics. This is due to the fact that the power of the Williams test to identify signifi-cant differences between correlations changes de-pending on the degree to which the pair of met-rics correlate with each other. Therefore, a metric that happens to correlate strongly with many other metrics would be at an unfair advantage, were numbers of significant wins to be used to rank met-rics. For this reason, it is best to interpret pairwise metric tests in isolation.
As part of this research, we have made avail-able an open-source implementation of statis-tical tests tailored to the assessment of MT metrics available at https://github.com/ ygraham/significance-williams.
5 Conclusions
in correlations for dependent samples. Analysis of statistical significance in the WMT-12 metrics
shared task showed there is currently insufficient evidence for a high proportion of metrics to con-clude that they outperform BLEU.
Acknowledgments
We wish to thank the anonymous reviewers for their valuable comments. This research was sup-ported by funding from the Australian Research Council.
References
Julio Castillo and Paula Estrella. 2012. Semantic tex-tual similarity for MT evaluation. InProceedings of the Seventh Workshop on Statistical Machine Trans-lation, pages 52–58, Montr´eal, Canada.
Boxing Chen, Roland Kuhn, and George Foster. 2012. Improving AMBER, an MT evaluation metric. In Proceedings of the Seventh Workshop on Statisti-cal Machine Translation, pages 59–63, Montr´eal, Canada.
Michael Denkowski and Alon Lavie. 2011. Meteor 1.3: Automatic metric for reliable optimization and evaluation of machine translation systems. In Pro-ceedings of the Sixth Workshop on Statistical Ma-chine Translation, pages 85–91, Edinburgh, UK. Mark Fishel, Rico Sennrich, Maja Popovi´c, and Ondˇrej
Bojar. 2012. TerrorCat: a translation error categorization-based MT quality metric. In Pro-ceedings of the Seventh Workshop on Statistical Ma-chine Translation, pages 64–70, Montr´eal, Canada. Ulrich Germann. 2003. Greedy decoding for
statis-tical machine translation in almost linear time. In Proceedings of the 2003 Conference of the North American Chapter of the Assoc. Computational Lin-guistics on Human Language Technology-Volume 1, pages 1–8, Edmonton, Canada.
Yvette Graham, Nitika Mathur, and Timothy Baldwin. 2014. Randomized significance tests in machine translation. InProceedings of the ACL 2014 Ninth Workshop on Statistical Machine Translation, pages 266–274, Baltimore, USA.
Philipp Koehn. 2004. Statistical significance tests for machine translation evaluation. In Proceedings of Empirical Methods in Natural Language Processing 2004 (EMNLP 2004), pages 388–395, Barcelona, Spain.
Shankar Kumar and William Byrne. 2004. Minimum Bayes-risk decoding for statistical machine transla-tion. InProceedings of the 4th International Con-ference on Human Language Technology Research and 5th Annual Meeting of the NAACL (HLT-NAACL 2004), pages 169–176, Boston, USA.
Gregor Leusch, Nicola Ueffing, and Hermann Ney. 2003. A novel string-to-string distance measure with applications to machine translation evaluation. In Proceedings 9th Machine Translation Summit (MT Summit IX), pages 240–247, New Orleans, USA.
Matouˇs Mach´aˇcek and Ondˇrej Bojar. 2011. Approx-imating a deep-syntactic metric for MT evaluation and tuning. InProceedings of the Sixth Workshop on Statistical Machine Translation, pages 92–98, Edin-burgh, UK.
Dan Melamed, Ryan Green, and Joseph Turian. 2003. Precision and recall of machine translation. In Pro-ceedings of the 2003 Conference of the North Amer-ican Chapter of the Association for Computational Linguistics on Human Language Technology (HLT-NAACL 2003) — Short Papers, pages 61–63, Ed-monton, Canada.
Franz Josef Och. 2003. Minimum error rate train-ing in statistical machine translation. In Proceed-ings of the 41st Annual Meeting of the Association for Computational Linguistics, pages 160–167, Sap-poro, Japan.
Kishore Papineni, Salim Roukos, Todd Ward, and Wei-Jing Zhu. 2001. BLEU: A method for automatic evaluation of machine translation. Technical Report RC22176 (W0109-022), IBM Research, Thomas J. Watson Research Center.
Maja Popovic. 2012. Class error rates for evaluation of machine translation output. InProceedings of the Seventh Workshop on Statistical Machine Transla-tion, pages 71–75, Montr´eal, Canada.
Stefan Riezler and John T. Maxwell. 2005. On some pitfalls in automatic evaluation and significance test-ing for mt. In Proceedings of the ACL Workshop on Intrinsic and Extrinsic Evaluation Measures for Machine Translation and/or Summarization, pages 57–64, Ann Arbor, USA.
James H. Steiger. 1980. Tests for comparing ele-ments of a correlation matrix. Psychological Bul-letin, 87(2):245.