ISSN Online: 2327-5227 ISSN Print: 2327-5219
DOI: 10.4236/jcc.2018.61005 Dec. 29, 2017 42 Journal of Computer and Communications
Laser-Based Guided Wave Propagation and
Mode Decomposition in Detecting the
Integrity of Structural I-Beams
Peter Tse, Faeez Masurkar
Smart Engineering Asset Management Laboratory (SEAM) and Croucher Optical Non-Destructive Testing and Quality Inspection Laboratory (CNDT), Department of Systems Engineering and Engineering Management,
City University of Hong Kong, Hong Kong, China
Abstract
This paper addresses the studies carried out on an I-beam to reveal the wave propagation characteristics and tackle the multi-mode propagation of Lamb waves. The experimental setup consisted of a new 3D Scanning Laser Doppler Vibrometer manufactured by Polytec (3D-SLDV) and was used to acquire high resolution time-space Lamb waves that were propagating in the I-beam. A high power and pulsed Nd:YAG laser was used to emit the required Lamb waves. The emission and sensing of the waves were carried out simultaneous-ly. The wave propagation data was recorded by scanning the surface of the I-beam in a sequential manner. The measured data was used to construct the wave patterns that were propagating in the I-beams at different time instants. Furthermore, as the waves in an I-Beam propagate with multiple modes even at low frequency range, filtering was carried out in the frequency-wavenum- ber domain in order to decompose the modes. The results presented thereby confirm that the new 3D-SLDV possesses tremendous capability in revealing the wave propagation characteristics and its interaction with defect. The re-sults could be the first time that the waves propagating in a real I-beam can be visually observed, whilst in the past, it can only be visualized through simula-tion. The capability of using such totally laser-based 3D inspection system to reveal the characteristics of Lamb wave and its interaction with defects are substantial.
Keywords
Laser System, I-Beam, Lamb Waves, Mode Decomposition, Surface Defect
How to cite this paper: Tse, P. and Ma-surkar, F. (2018) Laser-Based Guided Wave Propagation and Mode Decomposition in Detecting the Integrity of Structural I-Beams. Journal of Computer and Communications, 6, 42-55.
https://doi.org/10.4236/jcc.2018.61005
DOI: 10.4236/jcc.2018.61005 43 Journal of Computer and Communications
1. Introduction
The maintenance of all the transport and civil infrastructure is important to en-sure safety and also minimize the cost of repairs and ownership. Effective main-tenance involves testing of these structures for presence of defects at different times of service. The testing is carried out using the non-destructive testing me-thods such as visual inspection, liquid penetrant, Eddy current, magnetic par-ticles or the ultrasonic testing methods [1].
Out of these, Ultrasonic testing is widely adopted because of its capabilities in identifying the defects over a sufficiently large area as these waves of an elastic type can propagate sufficiently long distances because of less attenuation. Ultra-sonic testing can be carried out by two ways: contact and non-contact. In the contact based methods, transducers are permanently attached on the area of in-vestigation and the ultrasonic waves are generated and sensed either using the pulse-echo or pitch-catch technique [1]. These contact methods have been proven to be useful for non-destructive testing by various researchers over the past few decades. However, these methods may not be suitable for high temper-ature applications, constantly changing environmental conditions and if there is less access to the inspection area. On the contrary, the non-contact methods in-clude Electro-magnetic Acoustic Transducer (EMAT), an air coupled transducer and Laser-ultrasonics. However, due to high acoustic impedance mismatch be-tween the solid-air interfaces, Laser-based methods can be considered as an ideal tool in the future for most of the Non-destructive testing applications.
The non-contact methods have been used by many researchers for inspection of aircraft panel [2], stiffened composite panels [3], aluminum plate structures [4], elbow [5], anisotropic carbon fiber reinforced plastic panel [6], a cantilever steel pipe [7], an aluminium [8] and steel H-Beam [9]. The specimens tested in these works are comparatively simple and therefore more complex structures need to be evaluated. To the authors best knowledge and extensive literature survey, the investigations on an I-beam with different thicknesses of flanges and web, which is one of the most important structure used in commercial and resi-dential applications is missing.
In this study, we investigate the wave propagation characteristics, mode de-composition and wave-damage interaction in an I-beam using a novel and a ful-ly non-contact laser system capable of generating and sensing the guided waves. In order to validate the feasibility of this experimental setup, the results obtained through the experiments are compared with the simulations carried out in COMSOL© Multiphysics. Furthermore, an advanced frequency-wavenumber
fil-tering technique is proposed to selectively extract a single mode and reconstruct the time domain data of the extracted mode. The filtered response consists of single mode and can be easily interpreted. The experimental setup used in the present study is discussed in the following section.
2. Experimental Setup
DOI: 10.4236/jcc.2018.61005 44 Journal of Computer and Communications
following section gives the graphic view of the specimen used for the study.
2.1. The Specimen
The specimen under investigation is an I-section beam as shown in Figure 1. The length of the beam is 625 mm with a top and bottom webs of 152 mm width and 10 mm in thickness. The length of the middle web is 139 mm with a thick-ness of 7 mm.
2.2. Pulsed Nd-YAG Laser System
The high peak optical power associated with pulsed Nd: YAG laser system as shown in Figure 2 can be utilized to provide spatially localized source in sam-ples, which in turn serves as a source of broadband elastic stress waves.
[image:3.595.211.539.279.568.2]A wavelength of 532 nm from Q-switched Nd: YAG pulsed laser system is
Figure 1. Cross-sectional view of the I-Beam (All dimensions are in mm).
[image:3.595.212.540.602.706.2]DOI: 10.4236/jcc.2018.61005 45 Journal of Computer and Communications
used to generate guided waves, whilst the pulse laser system emits the pulses of energy.
2.3. 3D-SLDV
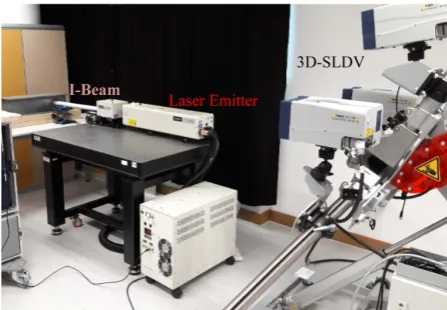
The 3D-SLDV system comprises of three scanning heads (Top with inbuilt camera, left and right), a junction box and a computer as shown in Figure 3.
The SLDV system measures the surface particle motion using the Doppler shift phenomenon in order to obtain the velocity of surface vibrations.
3. Experimental Study
[image:4.595.261.485.298.453.2] [image:4.595.270.478.510.706.2]The domain of investigation encompassing the surface defect is discretized into 29 points along the direction of wave propagation (x-direction) and 43 points along the direction perpendicular to wave propagation (y-direction) as shown in Figure 4.
Figure 3. The experimental setup with the 3D-SLDV system for mea-suring the wave propagation motions in 3D, the Nd:YAG laser as the wave emitter and the I-beam specimen.
DOI: 10.4236/jcc.2018.61005 46 Journal of Computer and Communications
The scan points along x-direction has a spacing of 0.37 mm which is sufficient as per Nyquist criterion to capture the wave propagation phenomena and about 1.09 mm along the y-direction. At each grid point, 30 measurements are aver-aged, to yield a better and clearer signal with high Signal to Noise ratio (SNR). Data is collected at the 1.28 MHz sample rate of the scanning vibrometer. For each measurement, 2048 samples are collected, resulting in 1.6 ms of time win-dow. The velocity range is typically set to 1250 mm/s and the 3D alignment error is always less than 0.1 mm. A bandpass filter with high quality is used to measure frequencies from 50 - 80 kHz for the specimen. The time required for a complete scan depends on the averaging, number of scan points and video triangulation during scan. The actual specimen with defect is shown in Figure 4 with the size of defect being 2 × 20 mm.
4. Dispersion Curves for an I-Beam Using COMSOL
Multiphysics
In order to get the dispersion curves for a complex geometry specimen like an I-Beam, COMSOL© Multiphysics is used in the present study. There are no
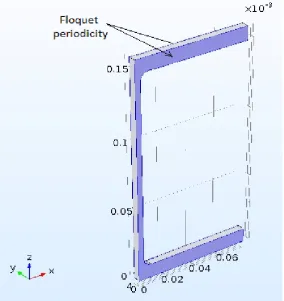
[image:5.595.232.517.402.704.2]di-rect equations describing the dispersion relations for an I-beam specimen [9]. In case of dispersion curves, only the cross-section needs to be modelled. In our case, we modelled only the half part of the cross-section (Right half) as shown in the Figure 5.
DOI: 10.4236/jcc.2018.61005 47 Journal of Computer and Communications
All the dimensions in Figure 5 are in meters. The Floquet periodicity is as-signed on both the faces (called source and destination) along the y-direction (length of the beam) as shown in the Figure 5. These boundary conditions are based on the Floquet theory which can be applied to the problems of small-amp- litude vibrations of spatially periodic structures. The Floquet periodicity condi-tions at the corresponding boundaries of the periodicity cell can be expressed as,
( )
f dst src
ik
dst s
r c
r r
u =u ⋅e− ⋅ − (1)
where the abbreviation “dst” refers to destination, “src” refers to source, u is a vector of dependent variables, r is the position and the vector kfrepresents the
spatial periodicity of the excitation.
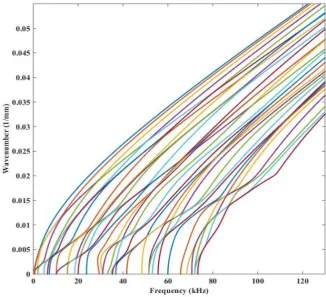
The following Figure 6, show the wavenumber dispersion curves for the steel I-Beam under study.
It can be concluded that, the propagation of guided waves is very complicated in an I-Beam structure as compared to the simple structures. Furthermore, large number of modes are present even at the low frequency range. In the present study, we use these dispersion curves obtained through the simulation as a guideline to verify the experimental results obtained through the novel 3D-SLDV measurement setup which is discussed in the following sections.
[image:6.595.210.537.411.708.2]5. Dispersion Curves from the Measured Experimental Data
The previous section discussed about the dispersion curves obtained through theDOI: 10.4236/jcc.2018.61005 48 Journal of Computer and Communications
simulations for the I-beam under study. In this section, the time-space wavefield data obtained at discrete points through the 3D-SLDV setup is used to obtain the dispersion curves. This is facilitated by taking a 2D Fast Fourier transform (2D-FFT) of a series of waveforms recorded at various positions on the specimen and is discussed in the following subsection.
2D Fast Fourier Transform
For a harmonic wave propagating along a plate in certain direction (x-axis), the displacement on the surface can be described by a general analytic expression [10],
( )
( ), ( ) j t kx
e
u t x =A
ω
ω− (2)where A( )ω is a frequency-dependent amplitude and ω=2πf . The spa-tial-temporal wavefield u(t,x) can be transformed to the frequency–wave num-ber domain by using 2D-FFT, which is defined as,
( )
( )2
( , ) D[ ( , )] , j t kx
U
ω
k =F u t x =∫ ∫
−∞ −∞∞ ∞u t x e− ω− dtdx (3)and the inverse 2D-FFT is defined as,
(
)
( ) 1 2 2 1 ( , ) [ ( , )] , (2 )j t kx D
u t x F U ω k U ω k e ω d dkω
π
∞ ∞ −
−
−∞ −∞
= =
∫ ∫
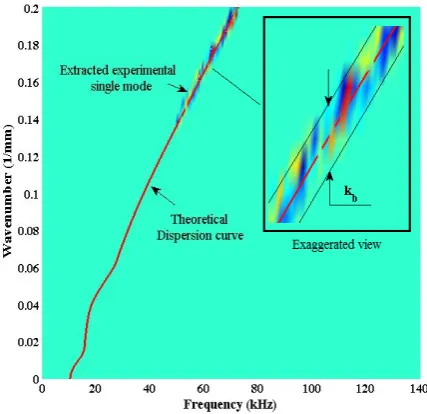
(4)The dispersion curves obtained through the experiments ([f-k]exp) will be
overlapped with those obtained through the simulations ([f-k]simulation). The main
reason for such a comparison is that the laser source has a broadband excitation feature which facilitates the generation of multiple modes. Secondly, as the I-beam specimen has a complicated geometry, from Figure 6, it is quite evident that, many modes are present even at low frequency. The resulting plots in the frequency-wavenumber domain for the I-Beam specimen are presented in the following section. The results are very encouraging.
6. Comparison and Discussions for the Dispersion
Curves in I-Beam Specimen
In this section, we present the comparison of dispersion curves obtained expe-rimentally and numerically for the I-Beam specimen. The results are presented in Figure 7 and Figure 8 for the symmetric and antisymmetric particle motions respectively. As there are many modes propagating well below 80 kHz (Figure 6), the authors have overlapped the two different class of modes separately in order to have a better interpretation of the results. The results thereby confirm that, there is good agreement between the experimental and simulation results for I-beam under study.
DOI: 10.4236/jcc.2018.61005 49 Journal of Computer and Communications
[image:8.595.215.535.73.359.2]Figure 7. Frequency wavenumber analysis for particle motion along Z-direction (out-of-plane) in I-Beam (Black lines are the theoretical symmetric modes).
[image:8.595.211.535.402.695.2]DOI: 10.4236/jcc.2018.61005 50 Journal of Computer and Communications
7. Decomposition and Demonstration of Extracting
Single Mode for a Defect Free Specimen
The dispersion curves for an I-Beam show that, even at low frequencies, multiple modes with different velocity propagate. This is due to the fact that, guided waves will experience multiple reflections and scattering when they encounter any geometrical discontinuity such as change in thickness, cross-section, fillet etc and may generate new modes. This will add more complexity to the signal.
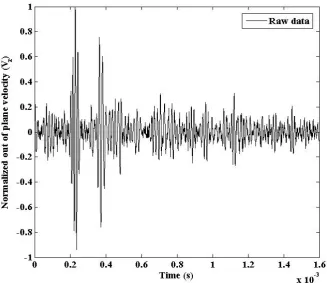
Figure 9 shows the raw out-of-plane vibrational velocity data recorded for the I-beam. As various modes are propagating, the signal looks very complicated and difficult to interpret. Although, all the modes are not generated as the laser excitation is in the thermoelastic regime, still the response looks convoluted. In order to inspect such complicated structures with guided waves in real time, it is very important to tackle the multimodal propagation of the waves especially in complicated geometries, extract a single mode of interest and study its interac-tion with the defect.
Thus, in the present study, we have decompose the waves through filtering in the f-k domain and reconstructed the corresponding time-domain wave-forms which consisted of only one mode and is discussed in the following subsection.
The f-k Filtering for 1-D Wave Propagation
[image:9.595.210.538.422.705.2]The f-k filtering process can be mathematically expressed as the product of the original spectrum U(f, k) and a designed f-k filter function Z(f, k) as,
DOI: 10.4236/jcc.2018.61005 51 Journal of Computer and Communications
( , ) ( , ) ( , ) f
U f k =U f k ×Z f k (5)
where Z(f, k) denotes the 2-D filter in the f-k domain and Uf(f, k) is the filtered
spectrum. The filtered spectrum is then back transformed using the inverse 2D FFT algorithm to reconstruct the time domain waveforms as,
1 2
( , ) D[ ( , )]
f f
u t x =F− U f k (6)
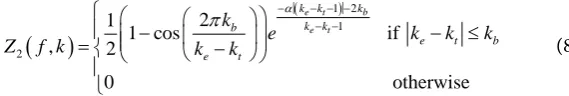
In order to obtain a single mode, the f-k filter can be designed as a 2D band-pass filter to keep the desired mode in the spectrum. The center of the 2D filter is set and moved along the theoretical dispersion curve of the mode to be ex-tracted for the desired frequencies of interest. This process can extract the mode in such a way that, most of the energy of the mode can be retained. The 2D bandpass filter can be expressed as,
1 2
( , ) ( ) ( , )
Z f k =Z f ×Z f k (7)
Here, Z1(f) can be designed as a raised cosine filter in frequency domain,
cor-responding to the desired frequency component to be extracted and Z2(f, k) is
designed as an Hann-poisson 2D filter centered at the theoretical dispersion curve (k-f)t of the wave mode to be extracted and can be mathematically
ex-pressed as,
(
)
( ) 1 2 1 2 2 11 cos if
2
ot ,
0 herwise
e t b e t
k k k
k k
b
e t b
e t
k
e k k k
k k k
Z f
α
π − − − −− −
− − ≤ − = │ │ (8)
where ke, kt and kb are the experimental and theoretical wavenumbers and
wa-venumber bandwidth respectively and α is a parameter that controls the shape
of the exponential. The Hann-Poisson window function is used as a filter be-cause it has less side lobes which be-causes less energy leakage and maximum ener-gy of the mode can be extracted. The variation of parameter α has negligible
effect on the reconstructed signal and is equal to 2 in the present paper.
The results after filtering the original spectrum are shown in Figure 10. It can be seen that the mode extracted is almost non-dispersive within the measured frequency bandwidth of 50 - 80 kHz which makes it suitable for identifying the location of defect (if any), by measuring the time of flight of the reflected wave.
[image:10.595.248.533.355.403.2]It can be seen from Figure 6, that the velocity of various modes will converge to a single velocity at high frequencies and they all may arrive at one time. Al-though, this can be seen as an alternative solution, but high frequencies may not yield a clearer signal and interpretation will still be challenging.
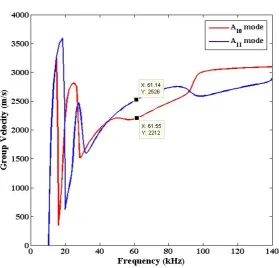
Figure 11 and Figure 12 shows the sample time waveforms after f-k filtering. A comparison of Figure 12 with Figure 9 shows that the filtering process re-duces the complexity of signal to a great extent. The experimental group velocity is calculated from the filtered time waveforms and found to be 2165 m/s and 2553 m/s for the A10 and A11 modes respectively whereas the theoretical group
DOI: 10.4236/jcc.2018.61005 52 Journal of Computer and Communications
[image:11.595.266.478.309.497.2]Figure 10.Extracted single mode (A10) frequency-wavenumber domain.
Figure 11. Filtered single mode waveform for A10 mode.
[image:11.595.265.479.525.703.2]DOI: 10.4236/jcc.2018.61005 53 Journal of Computer and Communications
Figure 13.Group velocity profile of mode to be extracted.
and Figure 12 may be due to small numerical errors during the reconstruction procedure and can be eliminated using further signal processing. An observation from Figure 11 and Figure 12 shows that the various modes (for e.g. A10 and
A11) arrive roughly at the same time as expected. The next section deals with
de-tection of defect discussed in section 3 based on the wave propagation character-istics and is discussed in the following section.
8. Results Presentation and Discussions on the
Detection of Defect
In the present study, several experiments have been carried out by the authors to visualize the propagation of waves for the healthy state as well as damage state of the specimens. For brevity, the wave propagation for healthy state is not pre-sented here. However, we present the first ever experiments carried out in a fully non-contact manner on a real damaged I-beam and the wave propagation in the form of animation.
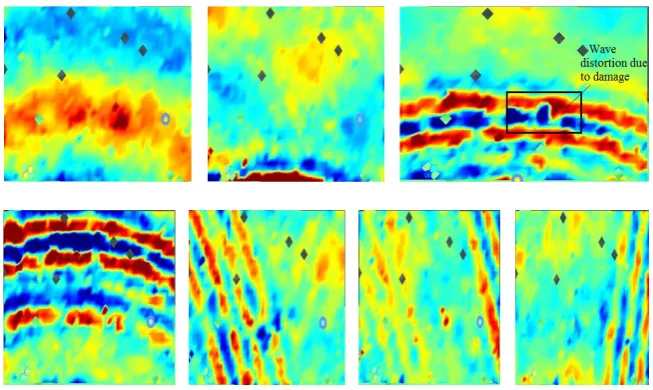
The time-domain waveforms recorded at each scan point are used to con-struct the wave patterns which is presented in Figure 14. The wave damage in-teraction can be clearly visualized in the Figure 14. Such results are very impor-tant in order to understand the behavior of different waves with different types of defects.
DOI: 10.4236/jcc.2018.61005 54 Journal of Computer and Communications
Figure 14. Out-of-plane component at 50, 150, 186.7, 223.4, 442.2, 532, 796.1 µs (the sequence is started from the top-left diagram and end at the lowest right diagram).
In order to support the experimental results, simulations were carried out in COMSOL© Multiphysics and the results were compared. Good agreement was
observed between the experiments and simulations.
The following conclusions have been drawn from the study:
The current experimental setup has tremendous capability for non-contact
generation and sensing of guided waves in complicated structures.
The guided waves generated in the I-beam interact with the damage and this
wave-damage interaction can be easily visualized. Such results are very im-portant for understanding the behavior of waves with different types of de-fects.
The proposed filtering technique can be used to extract a single mode. The
reconstructed signal becomes quite clean and easy to interpret. This will make the interpretation of signal easy, even for a complicated geometry with defect.
Acknowledgements
The work described in this paper was fully supported by a grant from the Re-search Grants Council (Project No. City U 11201315) and a grant from the In-novation and Technology Commission (ITC) (Project No. ITS/061/14FP) of the Government of the Hong Kong Special Administrative Region (HKSAR), China. Any opinions, findings, conclusions or recommendations expressed in this ma-terial/event (or by members of the project team) do not reflect the views of the Government of the HKSAR, the ITC or the Panel of Assessors for the Innovation and Technology Support Programme of the Innovation and Technology Fund.
References
Ap-DOI: 10.4236/jcc.2018.61005 55 Journal of Computer and Communications
plied Acoustics, 120, 98-110. https://doi.org/10.1016/j.apacoust.2017.01.014 [2] Ostachowicz, W., Wandowski, T. and Malinowski, P. (2010) Damage Detection
Using Laser Vibrometry. 2ndInternational Symposium on NDT in Aerospace.
[3] David, B., Staszewski, W., Jochen, S. and Patrick, P. (2013) Damage Detection in Reusable Launch Vehicle Components Using Guided Ultrasonic Waves and 3-D Laser Vibrometry. Health Monitoring of Structural and Biological Systems, Proc. of SPIE, 8695:86950D. https://doi.org/10.1117/12.2009846
[4] Staszewski, W., Lee, B., Mallet, L. and Scarpa, F. (2004) Structural Health Monitor-ing UsMonitor-ing ScannMonitor-ing Laser Vibrometry: I. Lamb Wave SensMonitor-ing. Smart Mater. Struct, 13, 251-260. https://doi.org/10.1088/0964-1726/13/2/002
[5] Doyoun, K., Younho, C. and Joonhyun, L. (2010) Assessment of Wall-Thinning in Carbon Steel Pipe by Using Laser-Generated Guided Wave. Nuclear Engineering and Technology, 42, 5.
[6] Marco, F., Jochen, S., Wolfgang, O., Mirko, N. and Rolf, L. (2012) 3D Scanning La-ser Doppler Vibrometry for Structural Health Monitoring Using Ultrasonic Surface Waves. Proceedings of the 15th International Conference on Experimental Mechan-ics.
[7] Davood, R. and Farid, T. (2010) A Novel Application of a Laser Doppler Vibrome-ter in a Health Monitoring System. Journal of Mechanics of Materials and Struc-tures, 2, 289-304.
[8] Kazuyuki, N., Tatsunao, T. and Naka, S. (2016) Guided Wave Testing for Structural Component by Multipoint Sensing with Wireless Accelerometers. Proceedings of the 19th World Conference on Non-Destructive Testing.
[9] Fucai, L., Hongguang, L., Jianxi, Q. and Guang, M. (2016) Guided Wave Propaga-tion in H-Beam and Probability-Based Damage LocalizaPropaga-tion. Structural Control and Health Monitoring.