Biodegradation of Natural Estrogens by Biofilms from
Biological Activated Carbon: Effect of Temperature
Xuan Guo1*, Fusheng Li2, Denny Helard1, Toshiyuki Kawaguchi2
1Graduate School of Engineering, Gifu University, Gifu, Japan 2River Basin Research Center, Gifu University, Gifu, Japan
Email: *p3812102@edu.gifu-u.ac.jp
Received August 16, 2012; revised September 13, 2012; accepted October 5,2012
ABSTRACT
In order to obtain information on the biodegradation potential of biofilms involved in the removal of natural estrogens by biological activated carbon (BAC) columns, batch degradation of estrone (E1) and 17-estradiol (E2) at temperature of 5˚C, 20˚C and 35˚C by biofilms from four BAC columns (packed with activated carbon of particle size ranging from 0.5 - 0.59 mm and 1.0 - 1.19 mm into two bed depths) was studied. The results indicated that E2 was degraded faster by than E1 at all three temperatures and with the increasing of temperature, the amount of E1 converted from E2 increased. By fitting observed concentration data with a first-order rate expression, the bio-mass based degradation rate constants (kVSS) for E1 and E2 under all experimental conditions were estimated and linear relationship between lnkVSS and 1/T (T = absolute temperature) was demonstrated, resulting that with the increasing of the experimental temperature, degrada- tion rate of biofilms for both E1 and E2 increased, and the increasing rate for E2 was higher than that for E1.
Keywords: Estrogens; Biofilms; Temperature; Biodegradation; BAC Columns
1. Introduction
Some chemicals that may disrupt the endocrine systems in humans and animals have received considerable atten- tion in the scientific and public community. Such chemi- cals are widely referred as endocrine disrupting chemi- cals (EDCs). Natural estrogen 17β-estradiol (E2) and its main metabolite estrone (E1) are among the most potent EDCs [1].In humans and mammalians, estrogens un- dergo various transformations mainly in the liver. Fre- quently, they are oxidized, hydroxylated, deoxidated and methylated prior to the final conjugation with glucuronic acid or sulphate. For instance, E2 is rapidly oxidized to E1 which can be further converted to estriol, the major excretion product in urine and faeces. They are excreted into wastewater by humans and mammals at ng/L level [2], but even this amount is often high enough to cause endocrine disrupting effects in some aquatic species such as trouts [3]. Many studies have shown that exposure to EDCs during early development induces abnormalities in peripheral reproductive organs and in reproductive be- haviors.
It has been generally observed that the sewage treat- ment plant (STP) with activated sludge can significantly reduce concentrations of estrogens [4], but leave fluctu- ating concentrations of estrogens in effluents. The dis-
charge of such effluents may be the main source for the wide distribution and occurrence of EDCs in surface wa- ter, groundwater, and even drinking water [5]. Even if certain percentages of discharged estrogens into natural water resource may get dissipated due to various phys- icochemical and biological reactions occurring therein [6] [7], the remaining percentages of them can enter drinking water treatment plants.
removed via a combination of adsorption and biodegra- dation by BAC columns. Biodegradation of E2 by the BAC columns was confirmed because of the detection of E1, which is the biotransformation byproduct of E2. In another recent study [12], removal of E2 from the drink- ing water in BAC reactors was obtained, showing that BAC had superior performance to GAC in removing estrogens due to the additional microbial degradation.
As mentioned above, adsorption and biodegradation are known to be the predominant processes contributing to estrogens removal during the BAC filtration. However, it is difficult to identify the relative significance of the two processes, and the development of mathematical models to simulate the removal efficiency of BAC col- umns requires understanding of the individual contribu- tion.
Unfortunately, information on the biodegradation be- havior of estrogens by biofilms from activated carbon adsorbers was insufficient. These biofilms were coated on the surface of GAC to generate BAC or gradually formed on the surface of GAC without intentional seed- ing. A previous study[11] has shown that the removal values of E2 in BAC columns were, by several percent- age points, lower than those in GAC columns. They pre- sumed that the blockage of the pore openings by bio- logical films composing of microbes and that some of their viscous metabolic macromolecular products may inhibit E2 access into pores where the adsorption takes place. However, the reason behind was still not clear. Thus, in order to know the biodegradation potential in- volved in the removal of estrogens by BAC columns, quantitative evaluation is necessary. In addition, it has been indicated that seasonal changes affected removal efficiency of estrogens in the sewage treatment plant [3], as biological growth may increase with ambient tem- perature [13]. For example, a previous study [14]on aerobic batch degradation of E2 by activated sludge has shown that temperature is a factor greatly affecting the removal of E2 by biodegradation, as larger removals were observed at higher temperatures. Therefore, it is inferable that biodegradation of estrogens by biofilms is affected by temperature. However, little was known about the temperature dependence of estrogens removals
by biofilms from BAC columns biodegradation removal of E1 and E2 by biofilms from BAC columns, and the temperature effect involved.
As the first study which examines the biodegradation behavior of estrogens by biofilms from BAC columns under different temperatures, the main objectives were to investigate the temperature effect on the biodegradation of E1 and E2 and provide biodegradation rate constant which need for modeling simulation of the estrogens removal efficiency by BAC columns.
2. Materials and Methods
2.1. Biological Activated Carbon Columns
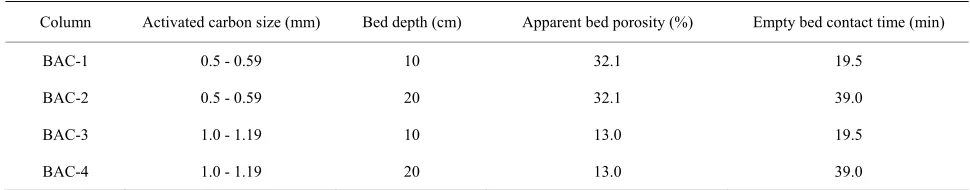
Biofilms used in this study were obtained from four BAC columns, which were packed with different particle sizes of activated carbon to two different bed depths. Fixed bed conditions for BAC columns are shown in Table 1. Filtrasorb 400 (Calgon Co., USA), a well-used granular activated carbon, was chosen as the adsorbent. BAC columns were generated by coating four packed GAC columns with microorganisms detached from the river- bed sediment of Nagara River. The coating of the micro- organisms for four BAC columns was achieved by circu- lating 500 mL of the detached riverbed suspension (the suspended solid concentration was 5100 mg/L) to each column at a flow rate of 9.0 mL/min for 48 hours.
[image:2.595.54.539.640.735.2]Adsorption experiments were conducted by using these BAC columns since November, 2005. After being filtered through 0.45 µm membrane filters (Tokyo Roshi, Japan), Nagara River water was supplied in the influent reservoir to all columns in a down-flow mode with pumps at a constant flow rate of 2.5 mL/min. All col- umns were operated at constant temperature of 20˚C. During experiments, E2 was intermittently spiked into the influent for several times in order to investigate the behavior of E2 in BAC columns where adsorbable NOM molecules contained in the river water were continuously adsorbed. After running for five and half years, the re- movals for NOM with the index of UV260 (UV-ab- sorbance at 260 nm) were –14%, –31%, 27% and 4% by BAC-1, BAC-2, BAC-3 and BAC-4, respectively, and no E2 was detected from the effluents of all BAC columns.
Table 1. Fixed bed conditions for BAC columns.
Column Activated carbon size (mm) Bed depth (cm) Apparent bed porosity (%) Empty bed contact time (min)
BAC-1 0.5 - 0.59 10 32.1 19.5
BAC-2 0.5 - 0.59 20 32.1 39.0
BAC-3 1.0 - 1.19 10 13.0 19.5
2.2. Biofilms Preparation
Biofilms were obtained by carefully backwashing each column with 3 L Milli-Q water. After one-day settlement (at 20˚C), the overlying water was pumped out. Then the settled substance in Milli-Q water was centrifuged at 3500 rpm for 10 min for further decreasing the water contained. The concentrated biofilms were sampled and subjected to observation by scanning electron micro- scope (SEM), no activated carbon particle was observed. Obtained biofilms were separate evenly to sterilized re- actors for experiments.
2.3. Stock Solution of Natural Estrogens
Pre-weighed amounts of E1 and E2 powders (Wako pure chemical Co., Osaka Japan) were separately added to glass bottles filled with 0.5 L of Milli-Q water to make initial suspension concentrations at about 0.04 g/L for each analyte. Organic solvent was not used in order to eliminate its effect on degradation of natural estrogens. After stirring for about 24 hours, the solutions were fil- tered using pre-washed 0.2 μm PTFE membrane filters, and the filtrate obtained was then used as the stock solu- tions of both compounds and refrigerated stored in dark at 5˚C prior to use. The concentration of E1 and E2 in each stock solution was about 600 and 1000 µg/L, re- spectively.
2.4. Batch Experiment Method
Two series of batch experiments were performed using biofilms from BAC columns based on the conditions
shown in Table 2. The first series were designed for in- vestigating the degradation behaviors of E2 at different temperatures by biofilms from BAC-1, BAC-2, BAC-3 and BAC-4. In the second series, biofilms from BAC-2 and BAC-4 were selected to study the degradation be-haviors of E1 under various temperatures. For each run, biofilms from the four columns were analyzed by meas-uring the suspended solids (SS), the volatile suspended solids (VSS) (Table 2) and the densities of general and heterotrophic bacteria. Organic content in the biofilms was described in the form of VSS/SS, VSS/SS values for biofilms from BAC-1, BAC-2, BAC-3 and BAC-4 fall into range of 0.77 - 0.79, 0.74 - 0.81, 0.82 - 0.84 and 0.79 - 0.91, respectively.
The densities of general and heterotrophic bacteria of the biofilms were determined by quantifying the bacteria number concentration in the suspension of the biofilms following the conventional plate culture method. For the culture method, after dilutions, 1 mL of each suspension was placed to a sterile plate and then poured with 10 mL of melted standard culture agar which consisted of weighted amount of peptone, yeast extract, glucose, agar powder and Milli-Q water.
[image:3.595.56.539.495.737.2]Batch experiments were performed using sterilized 500 mL-flasks which were placed on water-bath shakers with adjustable water temperature. For each reactor, after being filtered through 0.2 m PTFE membrane filters, 300 mL of Nagara River water was added with the col- lected biofilms. River water was filtered in order to ex- clude the possibility of effect from the bacteria exist there on the biodegradation behaviors of E1 and E2. Wa- ter quality of the used Nagara River water was investi-
Table 2. Batch experimental conditions.
Series Run No Column Temperature (˚C) Initial concentration (g/L) SS (g/L) VSS (g/L)
1 BAC-2 5 30 0.011 0.008
2 BAC-4 5 30 0.022 0.020
3 BAC-1 20 30 0.083 0.066
4 BAC-2 20 30 0.029 0.023
5 BAC-3 20 30 0.054 0.044
6 BAC-4 20 30 0.033 0.030
7 BAC-1 35 30 0.019 0.015
E2
8 BAC-3 35 30 0.008 0.007
9 5 30 0.040 0.030
10 BAC-2 20 30 0.038 0.029
11 35 30 0.024 0.018
12 5 30 0.014 0.012
13 BAC-4 20 30 0.028 0.022
E1
gated under the conditions: pH of 7.6, dissolved organic carbon (DOC) of 0.95 mg/L, UV260 of 1.09/m, electric- ity conductivity (EC) of 8.75 mS/m and dissolved oxy- gen (DO) of 5.37 mg/L. Bath water temperatures were adjusted in advance to desired levels at 5˚C, 20˚C, 35˚C, respectively. After the filtered river water was added to reactors with biofilms and reached desired temperatures (~5 min was needed), the stock solution of E1 or E2 was spiked to obtain initial concentration of 30 g/L. The reactors were shaken in the dark throughout the experi- mental period 200 h) to eliminate the possibility of photo degradation of estrogens inside. Intermittent monitoring of pH and DO in the reactors showed a small fluctuation at pH 7.6 and 6.2 mg/L DO. The sampling time intervals were designed as t = 0.08, 0.17, 0.5, 1, 2, 4, 8, 11, 24, 35, 48, 72, 96, 120, 140 and 196 h after spiking of E1 or E2. For each sampling, about 10 mL of the mixed suspension of biofilms and river water was taken into a 15 ml cen- trifuge tube after being filtered through 0.45 μm mem- brane filters and then subjected to analysis.
E1 and E2 were analyzed using an Agilent 1100 series liquid chromatography/mass spectrometry (LC/MS) sys- tem (HP1100MSD; CA, USA). The setting conditions of which are shown in Table 3. For every commencing of the analysis, calibration was performed using 10 and 50
g/L of both E1 and E2 standard solutions with a me- thanol content of 20% in v/v. To minimize measurement errors, two internal standards, namely 17-estradiol-C4 and estrone-C4 (Hayashi Pure Chemical Ind., Co., Ltd.), were added to all samples, and the identification and quantification were made in negative SIM mode by fol- lowing the well-used internal standard methodology [3, 15]. The target ions for E1 and E2 were 269 and 271, re- spectively. By adopting a large injection volume (i.e., 25
L), the detection limits reached a level of about 0.01
g/L for both targeted species.
Significant differences in the means of parameters between different treatments were tested based on one- way analysis of variance (ANOVA) with mean separa- tion by Tukey’s significant difference (HSD) test at 95% confidence level using the software of STATISTIC 8.0.
3. Results and Discussion
3.1. Degradation Behaviors of E1 and E2
[image:4.595.305.540.111.523.2]The concentration profiles of E1 and E2 spiked sepa- rately into respective reactors under various temperatures are illustrated in Figures 1 and 2. For all runs, the lower the temperature, the higher the residual concentration, thus indicating a significant impact of liquor temperature on the biodegradation of E1 and E2 from the aqueous phase over the studied rang of 5˚C - 35˚C, in agreement with those observed by Li et al. (2005) [14]. For instance, for runs where E1 was spiked into reactors with biofilms from BAC-4 (Figure 1), the spiked E1 (30 g/L) decreas-
Table 3. Major LC/MS parameters used for detection of E1 and E2.
Instrument HP1100MSD
Column Zorbax Eclipes
XDB-C8
(4.6Φ × 150 mm)
Eluent A: Acetonitrile/Methanol = 60:40
B: Methanol 5000
Flow-rate 0.4 mL·min–1
Column temperature 40˚C
LC
Injection volume 25 μL
Ion source ESI
Mode Negative (SIM)
Capillary voltage 3000 V
Fragmentor 70 V
Nebulizer pressure 35 psi
Drying gas flow (N2) 12 L·min–1
MS
Drying gas temperature 350˚C
0 5 10 15 20 25 30
0 50 100 150
Con
ce
nt
ra
tio
n (
μ
g/
L
)
Time (h) E1
200
Run 12 at 5℃ Run 13 at 20℃ Run 14 at 35℃
Figure 1. Concentration profiles of E1 observed when E1 was spiked.
ed to 22.9, 10.3 and 5.6 g/L after 48 h at 5˚C, 20˚C and 35˚C, respectively, with the residual concentration at 5˚C being about 4 times higher than that at 35˚C. A reduction in the removal by about 41.6% (from 65.3% to 23.7%) was obtained as the temperature decreased from 20 to 5˚C; and a further reduction by about 57.6 % (from 81.3% to 23.7%) was obtained as the temperature was lowered from 35 to 5˚C. After 196 h-operation, the spik- ed E1 decreased to 1.64 and 1.54 g/L from the aqueous phase at 20˚C and 35˚C, respectively. At 5˚C, however, its residual concentration was 13.38 g/L corresponding to a removal of 55.4%.
[image:4.595.306.539.117.516.2]0 5 10 15 20 25 30
0 50 100 150
C
on
cen
tr
at
io
n (
μ
g/
L)
Time (h) 20
Run 1 at 5℃
Run 4 at 20℃ E2
(a)
(a)
0 5 10 15 20 25 30
0 50 100 150 200
C
on
ce
nt
ra
tio
n (
μ
g/
L)
Time (h)
Run 1 at 5℃ Run 4 at 20℃
(b)
E1
[image:5.595.67.279.82.395.2](b)
Figure 2. Concentration profiles of (a) E2 observed when E2 was spiked, (b) E1 emerged when E2 was spiked.
were observed (comparisons of concentration profiles obtained under 20˚C and 35˚C were not shown). Never- theless, the spiked E2 (30 g/L) decreased to 11.37 and 3.08 g/L after 48 h at 5˚C and 20˚C, respectively. The value was less than 50% of the residual concentration of E1 at the same sampling time, indicating that biofilms can degrade E2 faster than E1 under the same tempera- ture conditions. It should be noted that E1 and E2 ad- sorbed on the biofilms were insignificant. This consid- eration is reasonable if referring to a recent study [4], in which the removal of E2 and 17-ethinylestradiol (EE2) in continuous flow biofilm reactors were mainly ascribed to the microbial degradation, as no E2 or EE2 were de- tected in the solid biofilms.
D’Ascenzo et al. (2003) [15] pointed out that E1 was probably the most important natural endocrine disrupting compound present in most natural water environments. This is probably true because that: 1) the quantities of E1 discharged from STPs into receiving water body are more than 10 times larger than those of E2; 2) E1 pos- sesses an estrogenic potency weaker than E2 but much stronger than nonylphenol and its precursors; and 3) some conjugated species of E1 may get disassociated after reaching receiving water bodies. Therefore, when the behavior of E2 degradation was investigated, the ap-
parent conversion from E2 to E1 under all experiment conditions was also examined. For all runs, E1 was de- tected during the biodegradation of the spiked E2. From the results of Run 1 and 4 (Figure 2(b)), E1 was firstly detected at sampling time of 24 and 8 h corresponding to a concentration of 2.32 and 2.38 g/L, respectively. After running for about another 96 and 40 h, it was clear that E1 reached its maximum level of 3.89 and 6.70 g/L, respectively. Based on the maximum concentrations of
E1 (CE1 max) and spiked concentrations of E2 (CE20), the
apparent conversion ratios from E2 to E1 were simply calculated using the ratios of CE1 max to CE20. The specific value for Run 1 and 4 was 12.9%, 22.3%, respectively. By increasing the experiment temperature, the conver- sion ratio increased, thus suggesting that the high tem- perature was responsible for more amount of E1 con- verted from E2. Similar trends of the increased E1 con- version ratio with the increasing temperature were ob- served from the results of other runs (data were not shown).
3.2. Degradation Rate Constants of E1 and E2
To further compare the degradation behavior of E1 and E2 at varied temperatures, the degradation rate constants of E1 and E2 spiked into relative reactors were derived by assuming a first-order reaction as described below
dC td =kC (1) where C is the concentration (μg/ L), t is the time (h) and
k is the apparent first-order degradation rate constant (/h).
k was approximated by fitting the experimental plots,
0
ln C C versus t, with the following rewritten linear format
0
ln C C kt (2)
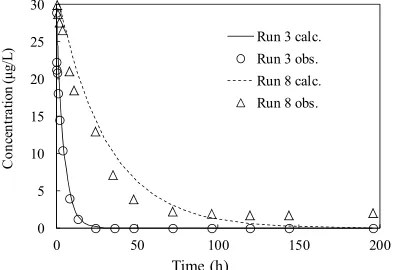
C0 is the initial concentration of targeted compound in- volved directly in the assumed first-order rate reactions. To prove the assumption that the decrease in concentra- tions of E1 and E2 in the presence of biofilms followed the first-order rate reaction, the concentrations calculated based on the first-order rate constants (from Run 3 and Run 8) were plotted against time in Figure 3. Clear visi-ble was that the calculated and observed data fitted well with high correlation coefficient (from R2 = 0.588 -
0.994), as shown in Table 4. Based on the estimated k value (data was not shown) and corresponding VSS lev- els, the biomass-based average degradation rate constants
changed from 5˚C to 35˚C. As compared to the kVSS val- ues of E1, which was ranged from 0.430 to 1.196 (h–1/g/L)
over the temperature of 5˚C - 35˚C observed from Run 9 - 14, the kVSSvalue of E2 was in the range of 0.437 to 3.900 (h–1/g/L) obtained from Run 1-6. These compari-
son results provided evidence that degradation of E2 ex- hibited a higher rate than the degradation of E1.Similar results were reportedin a study [3] concerning the be- havior and occurrence of estrogens in municipal STP. Average kVSS values of runs operated at the same tem- perature were calculated and the differences between degradation rates of E1 and E2 by biofilms at different temperatures were revealed in Figure 4. It was clear that under all temperature conditions the average kVSS value of E2 was higher than that of E1. For both E1 and E2, no significant difference was obtained for average kVSS value between 5˚C and 20˚C or 20˚C and 35˚C (p > 0.05). However, significant different of those value between 5˚C and 35˚C was obtained (E1: p < 0.02, E2: p < 0.03).
0.5 - 0.59 mm). It is probably because of the different activated carbon surface area between BAC-3 and BAC-1 or BAC-4 and BAC-2, surface area of large-size activated carbons in BAC-3 and BAC-4 was smaller than that of small-size ones in BAC-1 and BAC-2, biofilms formed on the surface of larger-size activated carbon was thicker than that formed on the surface of small-size ones, and more living bacteria could colonize in the thicker biofilms. On the contrary, the difference in the bacteria number among the biofilms from BAC columns with different bed depths was not significantly observed. Note that the higher microbial density did not correlate with higher biomass-based degradation rate constants kVSS
(Table 5), suggesting that the number of estrogen-de-
0 2 4 6
5℃ 20℃ 35℃
kVS
S
(h
-1/(
g/L
)
[image:6.595.338.506.265.393.2]E1 E2
[image:6.595.77.276.408.543.2]Figure 5 shows the microbial density of biofilms from BAC columns. It can be seen that for both general and heterotrophic bacteria, the bacteria number of biofilms obtained from BAC-3 and BAC-4 (packed with activated carbon having particle size ranging from 1.0 - 1.19 mm) were higher than those from BAC-1 and BAC-2 (packed with activated carbon having particle size ranging from
Figure 4. Comparison of average biomass-based degrada-tion rate constants from runs at same temperatures.
0 5 10 15 20 25 30
0 50 100 150 200
C
on
ce
nt
ra
tio
n (
μ
g/
L
)
Time (h)
Run 3 calc. Run 3 obs. Run 8 calc. Run 8 obs.
1.E+04 1.E+05 1.E+06 1.E+07 1.E+08
BAC-1 BAC-2 BAC-3 BAC-4
C
F
U
/m
g-dr
yb
io
film
Heterotrophic
General
Figure 3. Description of batch degradation of E2 by the
first-order reaction. Figure 5. Microbial density of biofilms from BAC columns.
Table 4. The biomass-based degradation rate constants estimated for all experimental runs at different temperatures.
5˚C 20˚C 35˚C
kVSS (h–1/g/L) R2 kVSS (h–1/g/L) R2 kVSS (h–1/g/L) R2
BAC-1 3.651 0.961 3.900 0.906
BAC-2 1.812 0.970 1.826 0.994
BAC-3 0.744 0.840 4.943 0.955
E2
BAC-4 0.437 0.951 2.792 0.990
BAC-2 0.430 0.894 0.678 0.588 1.196 0.647
E1
[image:6.595.322.513.434.556.2] [image:6.595.58.538.599.737.2]Table 5. Comparison of degradation rate constants of this study with previous studies.
Initial concentration (g/L) Matrix Temperature (˚C) kSS (h–1/g/L) kVSS (h–1/g/L) References
10 - 50 Activated sludge 5 0.851 0.796 Li et al. [14]
30 Biofilms 5 1.034 1.125 This study
10 - 50 Activated sludge 20 1.309 1.780 Li et al. [14]
30 Activated sludge 20 4.272 4.940 Li et al. [16]
1000 Aquifer material 20 0.003 - Ying et al. [17]
15 Sediment 20 0.042 - Desmiarti et al. [18]
30 Biofilms 20 1.963 2.253 This study
200 Nitrifying activated sludge 30 0.347 - Shi et al. [19]
10 - 50 Activated sludge 35 1.924 3.330 Li et al. [14]
E2
30 Biofilms 35 3.581 4.421 This study
44.4 Nitrifying activated sludge 4 0.049 - Ren et al. [20]
30 Biofilms 5 0.273 0.430 This study
30 Activated sludge 20 0.833 0.932 Li et al. [16]
100 Activated sludge 20 0.095 - Taro et al. [21]
30 Biofilms 20 0.532 0.686 This study
200 Nitrifying activated sludge 30 0.010 - Shi et al. [19]
E1
30 Biofilms 35 0.820 1.036 This study
-: data not available.
grading bacteria was not proportional to those of general and heterotrophic bacteria existing in biofilms.
In addition to the biomass-based degradation rate con- stants kVSS, the SS-based degradation rate constants (kSS) were also calculated and comparisons of the kSS and kVSS
values of E1 and E2 obtained in study with literature values are summarized in Table 5. The SS-based degra- dation rate constant of E2 obtained at 35˚C increased by 10.3 times as compared to that obtained at 30˚C in the literature [19].Moreover, The degradation rate constant of E1 (kSS) (0.273 and 0.820 h–1/g/L) at temperature 5
and 35˚C was 5.6 and 82 times higher than that estimated for a nitrified activated sludge at temperature of 4˚C and 30˚C [19,20],respectively, suggesting that both E1 and E2 can be degraded faster by biofilms from BAC col- umns than by nitrified activated sludge used in their studies.It was further noticed that the kSS value resulted from the degradation by biofilms was 1.2 - 5.6 times lar- ger than that associated with the activated sludge at tem- perature of 5˚C, 20˚C and 35˚C. However, Li et al. (2008) [16] reported higher kSS values, which might because more active bacteria available in the activated sludge used in that study for the degradation of E1 and E2.
3.3. Temperature Effect on the Biomass-Based Degradation Rate Constants of E1 and E2
Under all temperature conditions, the degradation rate of
E2 by biofilms was higher than that of E1. Similar result was observed from a study [19]using nitrifying activated sludge, showing that the degradation of estrogens fol- lowed the first-order reaction kinetics with the degrada- tion rate constant of 0.056 h–1 for E1 and 1.3 h–1 for E2.
To further compare the temperature effect on the bio- mass-based degradation rate constants of E1 and E2, a well-used expression was used. The relationship between the absolute experimental temperature Tand the average
kVSSvalue was established by the following equation:
2 VSS
dlnk dt E RT a (3)
where Eawas activation energy and Rwas the gas con-
y = -2709.5 x + 8.8 y = -4230.4 x + 15.2
-1 0 1 2
0.003 0.0034 0.0038
ln
kVS
S
1/T (K-1)
[image:8.595.90.256.85.220.2]E1 E2
Figure 6. Effect of temperature on the biomass-based deg-radation rate constants.
study [14] which showed that the removal of E2 in the aerobic sludge process was faster at higher temperature, with the role of sorption by biomass being less signify- cant.
4. Conclusion
Biodegradation of natural estrogens E1 and E2 by bio- films from different biological activated carbon columns were investigated by conducting batch degradation ex-periments under various temperature conditions. The results showed that biofilms can degrade both E1 and E2 under all experimental temperatures and performed better on the degradation of E2. The degradation rate constants for both E1 and E2 increased with the increase in the experimental temperature and the temperature effect was more pronounced for E2 degradation than for E1 degra- dation.
REFERENCES
[1] Z. Sebastian, D. Uwe and H. Thomas, “Determination of Estrogenic Steroids in Surface Water and Wastewater by Liquid Chromatography-Electrospray Tandem Mass Spec- trometry,” Journal of Separation Science, Vol. 28, No. 1, 2005, pp. 52-58. doi:10.1002/jssc.200301727
[2] A. C. Johnson and J. P. Sumpter, “Removal of Endocrine Disrupting Chemicals in Activated Sludge Treatment Works,” Environmental Science & Technology, Vol. 35, No. 24, 2001, pp. 4697-4703. doi:10.1021/es010171j [3] T. A. Ternes, P. Kreckel and J. Mueller, “Behavior and
Occurrence of Estrogens in Municipal Sewage Treatment Plant-II: Aerobic Batch Experiment with Activated Slu- dge,” Science of the Total Environment, Vol. 225, No. 1-2, 1999, pp. 91-99. doi:10.1016/S0048-9697(98)00335-0 [4] P. Christina and R. Wolfgang, “Investigation on the Re-
moval of Natural and Synthetic Estrogens Using Biofilms in Continuous Flow Biofilm Reactors and Batch Experi- ments Analysed by Gas Chromatography/Mass Spectro- metry,” Water Research,Vol. 45, No. 3, 2011, pp. 1105- 1114. doi:10.1016/j.watres.2010.10.034
[5] Z. H. Liu, K. Yoshinori and M. Satoshi, “Removal Me-
chanisms for Endocrine Disrupting Compounds (EDCs) in Wastewater Treatment-Physical Means, Biodegrada- tion, and Chemical Advanced Oxidation: A Review,” Sci- ence of the Total Environment,Vol. 407, No. 2, 2009, pp. 731-748. doi:10.1016/j.scitotenv.2008.08.039
[6] K. M. Lai, K. L. Johnson, M. D. Scrimshaw and J. N. Lester, “Binding of Waterborne Steroid Estrogens to So- lid Phase in River and Estuarine Systems,” Environmen- tal Science & Technology, Vol. 34, No. 18, 2000, pp. 3890- 3894. doi:10.1021/es9912729
[7] K. I. E. Holthaus, A. C. Johnson, M. D. Jurgens, R. J. Williams, J. J. L. Smith and J. E. Carter, “The Potential for Estradiol and Ethinylestradiol to Sorb to Suspended and Bed Sediments in Some English Rivers,” Environ- mental Toxicology and Chemistry, Vol. 21, No. 12, 2002, pp. 2526-2532. doi:10.1002/etc.5620211202
[8] M. J. Benotti, R. A. Trenholm, B. J. Vanderford, J. C. Holady, B. D. Stanford and S. A. Snyder, “Pharmaceuti- cals and Endocrine Disrupting Compounds in US Drink- ing Water,” Environmental Science & Technology, Vol. 43, No. 3, 2009, pp. 597-603. doi:10.1021/es801845a [9] T. Fukuhara, S. Iwasaki, M. Kawashima, O. Shinohara
and I. Abe, “Adsorbability of Estrone and 17 Beta-Es- trodiol in Water onto Activated Carbon,” Water Research, Vol. 40, No. 2, 2006, pp. 241-248.
doi:10.1016/j.watres.2005.10.042
[10] Y. P. Zhang and J. L. Zhou, “Removal of Estrone and 17 Beta Estradiol from Water by Adsorption,” Water Re- search,Vol. 39, No. 16, 2005, pp. 3991-4003.
doi:10.1016/j.watres.2005.07.019
[11] F. S. Li, A. Yuasa, H. Tanaka and Y. Katamine, “Adsorp- tion and Biotransformation of 17-Estradiol in Biological Activated Carbon Adsorbers,” Adsorption, Vol. 14, No. 2-3, 2008, pp. 389-398. doi:10.1007/s10450-008-9105-1 [12] Z. T. Li, B. Dvorak and X. Li, “Removing 17-Estradiol
from Drinking Water in a Biologically Activated Carbon (BAC) Reactor Modified from a Granular Activated Car- bon (GAC) Reactor,” Water Research, Vol. 46, No. 9, 2012, pp. 2828-2836. doi:10.1016/j.watres.2012.03.033 [13] M. P. Fernandez, I. D. Buchanan and M. G. Ikonomou,
“Seasonal Variability of the Reduction in Estrogenic Ac-tivity at a Municipal WWTP,” Water Research, Vol. 42, No. 12, 2008, pp. 3075-3081.
doi:10.1016/j.watres.2008.02.022
[14] F. S. Li, A. Yuasa, A. Obara and P. M. Alexander, “Aero- bic Batch Degradation of 17-Estradiol (E2) by Activated Sludge: Effects of Spiking E2 Concentrations, MLVSS and
Temperatures,” Water Research, Vol. 39, No. 10, 2005, pp. 2065-2075. doi:10.1016/j.watres.2005.02.009
[15] G. D’Ascenzo, A. D. Corcia, A. Gentili, R. Mancini, R. M. M. Nazzari and R. Samperi, “Fate of Natural Estrogen Conjugates in Municipal Sewage Transport and Treat-ment Facilities,” Science of the Total Environment, Vol. 302, No. 1-3, 2003, pp. 199-209.
doi:10.1016/S0048-9697(02)00342-X
doi:10.1016/j.biortech.2007.06.016
[17] G. G. Ying, R. S. Kookana and P. Dillon, “Sorption and Degradation of Selected Five Endocrine Disrupting Che- micals in Aquifer Material,” Water Research,Vol. 37, No. 15, 2003, pp. 3785-3791.
doi:10.1016/S0043-1354(03)00261-6
[18] R. Desmiarti, F. S. Li, T. Kawaguchi and C. Yoshimura, “Behavior of Natural Estrogens in Sediment: Column Studies and Model Evaluation,” Environmental Engi-neering Research,Vol. 45, 2008, pp. 535-545.
[19] J. H. Shi, S. Fujisawa, S. Nakai and M. Hosomi, “Bio- degradation of Natural and Synthetic Estrogens by Nitri- fying Activated Sludge and Ammonia-Oxidizing Bacte-
rium Nitrosomonas Europaea,” Water Research, Vol. 38, No. 9, 2004, pp. 2323-2330.
doi:10.1016/j.watres.2004.02.022
[20] Y. X. Ren, K. Nakano, M. Nomura, N. Chiba and O. Ni- shimura, “Effects of Bacterial Activity on Estrogen Re- moval in Nitrifying Activated Sludge,” Water Research, Vol. 41, No. 14, 2007, pp. 3089-3096.
doi:10.1016/j.watres.2007.04.028
[21] U. Taro and K. Tomoya, “Separate Estimation of Adsorp- tion and Degradation of Pharmaceutical Substances and Estrogens in the Activated Sludge Process,” Water Re- search, Vol. 39, No. 7, 2005, pp. 1289-1300.