Time-dependent analysis of K2PtBr6 binding to lysozyme
studied by protein powder and single crystal X-ray
analysis
HELLIWELL, John R., BELL, Anthony, BRYANT, P., FISHER, S., HABASH, J.,
HELLIWELL, Madeleine, MARGIOLAKI, I., KAENKET, S., WATIER, Y.,
WRIGHT, John P. and YALAMANCHILLI, S.
Available from Sheffield Hallam University Research Archive (SHURA) at:
http://shura.shu.ac.uk/12774/
This document is the author deposited version. You are advised to consult the
publisher's version if you wish to cite from it.
Published version
HELLIWELL, John R., BELL, Anthony, BRYANT, P., FISHER, S., HABASH, J.,
HELLIWELL, Madeleine, MARGIOLAKI, I., KAENKET, S., WATIER, Y., WRIGHT,
John P. and YALAMANCHILLI, S. (2010). Time-dependent analysis of K2PtBr6
binding to lysozyme studied by protein powder and single crystal X-ray analysis.
Zeitschrift fur Kristallographie, 225, 570-575.
Copyright and re-use policy
See
http://shura.shu.ac.uk/information.html
Time-dependent analysis of K
2
PtBr
6
binding to lysozyme studied
by protein powder and single crystal X-ray analysis
John R. Helliwell*, I, A. M. T. BellII,1, P. BryantIII, S. FisherI, IV, J. HabashI, Madeleine HelliwellI, I. MargiolakiV, VI, S. KaenketI, Y. WatierV, J. WrightVand S. YalamanchilliI
I School of Chemistry, University of Manchester, UK II STFC Daresbury Laboratory, UK
IIILife Sciences, University of Manchester, UK IVInstitut Laue Langevin, Grenoble, France V ESRF, Grenoble, France
VIDepartment of Biology, University of Patras, Greece
Received September 23, 2010; accepted October 5, 2010
zzzzzzzzzzzz/zzzzzzzzzzzzzzz/
zzzzzzzzzzzz/zzzzzzzzzzzzzzz/
Abstract. Multi heavy atom cluster compounds like K2PtBr6 offer a way forward to solve, de novo, unknown protein structures by powder diffraction involving disper-sive (measured at two X-ray wavelengths) and isomor-phous intensity differences as a complement to micro-crys-tallography or by using both approaches in combination. Towards this end, using the ESRF high resolution syn-chrotron X-ray powder diffraction beamline ID31, we have recorded high quality protein powder diffractograms at the platinum LIII and bromine K absorption edges, as well as reference wavelengths, for K2PtBr6 bound to lyso-zyme. These experiments were conducted at 80K to pro-tect the sample against X-radiation damage as much as possible and also to fix the K2PtBr6 bound state, which seemed to show instability at room temperature. With mul-tiple powder pattern analysis we extracted intensities and showed the PtBr6 bound in lysozyme using ‘omit electron density maps’. In addition the wavelength dispersive Four-ier around the Br K edge shows up the bromine signal at PtBr6 binding site 1 in one of the six samples tested. To better understand the chemical properties of this heavy atom compound we have elucidated the detailed binding behaviour using single crystal analyses with time-resolved freeze quenching after soak times of 10, 90 and 170 min-utes. Whilst the quick soaking of 10 to 30 minutes, used at ESRF ID31 shows clear binding there is increasing binding strength with increasing soak time. Thus, these time-resolved analytical chemistry results show that further heavy atom signal optimizations are possible. Prospects for extending our approach to the yet larger isomorphous and wavelength dispersive signal case of Ta6Br12bound to lysozyme are also described.
Introduction
Protein powder diffraction continues to excite strong inter-national interest; there are a variety of applications, includ-ing industrial protein characterization, such as polymorphs of insulin, as well as extending structure determination to yet smaller crystal samples, which would otherwise be outside the range of synchrotron X-ray data collection from a protein microcrystal [1–5]. Furthermore there are the upcoming X-ray Laser Facilities, with possibilities for protein nanocluster-crystallites’ diffraction and de novo structure determination. There are also both the MWatt spallation and enhanced instrumentation at reactor neutron sources for new powder diffraction opportunities with neu-trons as a neutral probe, to complement single crystal dies; the latter are used for specific protein structural stu-dies involving protonation states of titrateable amino acids or H/D exchange dynamics studies, and free of X-ray da-mage effects. The use of protein powders in neutron work would extend neutron studies to those cases where only smaller crystals can be grown.
Using X-rays, either with MIR [6] orDf0MAD for phas-ing, it is possible in principle to solve de novo a protein structure from powder diffraction data, even iff00anomalous differences are not measurable, since the Friedel pairs are overlapped in powder rings, by making use of solvent flat-tening to ‘resolve the inherent phase ambiguity’. To increase the isomorphous or dispersive differences by optimising the heavy atom binding is likely to be important however.
Methods
For the lysozyme powder samples used at ID31 (Supple-mentary Fig. S1) the soak concentrations were: 10 mM K2PtBr6 soaking for 10 minutes but could be as long as 30 minutes due to the time needed to fill a capillary in-cluding ‘centrifuge spin downs’. It was discovered that over a period of up to 12 hours or so the yellow brown of the soaked powder became white again, presumably due
# by Oldenbourg Wissenschaftsverlag, Mu¨nchen
* Correspondence author
(e-mail: [email protected])
1Present address: HASYLAB/DESY, Hamburg, Germany
to some type of decay of the K2PtBr6. Thus freezing con-ditions down to 80 K were determined and thereby six powder samples were frozen in 0.8 mm capillaries with an inner cylindrical portion removed so as to facilitate ‘low mosaicity increases’ by minimising freezing times from the outer to the inner surfaces of the protein powder.
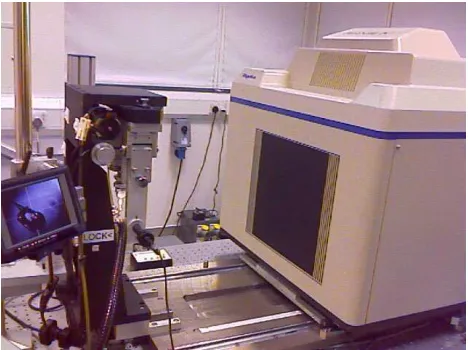
ID31 powder X-ray diffraction data were recorded at the wavelengths of thef0dips and ‘soft wavelength remotes’ of the Br K edge (respectively 0.9203A and 0.9501A) with calculated f0 values of 8.335 and 3.056 electrons and the Pt LIII edge (1.07245Aand 1.07331A) withf0 values from the Kramers Kronig transform, due to white line struc-ture, of 22 to 16 electrons, versus only 2 electrons dif-ference (calculated from [7]). The use of the inflection points as well as remote wavelengths on the soft energy side of each edge sought to maximise Df0whilst minimis-ing absorption changes or stimulation of X-ray fluores-cence background as much as possible. At ID31 multiple powder scans, and thereby the use of X-ray radiation da-mage creating anisotropic changes in unit cell parameters, proved effective in improving the powder data sets’ com-pleteness, since the separation and overlap of the powder lines were suitably varied (see Supplementary Fig. S2.)
ID31 was also used to collect high-resolution powder diffraction data on a sample of K2PtBr6 i.e. without the protein, at ambient temperature. The wavelength settings for the protein powder diffraction measurements were in fact calibrated using this powder sample, at both the plati-num LIII and bromine K absorption edges, via its X-ray fluorescence and whereby the f0 dip was determined as 1.07245A versus the tabulated value for a free metal atom of 1.0722A [7]. This represents an absorption edge shift of 3 eV, i.e. in the wrong direction for platinum in
oxi-dation state IV, but which is probably due to the relative rather than absolute angle encoder on the monochromator. Powder X-ray diffraction data were collected at X-ray ener-gies (wavelengths) of 11.58 keV (1.07064A), 11.5673 keV (1.07181A) and 11.5608 keV (1.07242A),i.e.close to and at the Pt LIII edge, and these data were used to determine Pt Df0 parameters for comparison with those determined for the lysozyme samples. The cif file has been deposited with FIZ with reference code ****.
For the freeze trap time-resolved single crystal evalua-tions (Supplementary Fig. S3) the following experimental conditions were used:11.5/9.4 mM K2PtBr6 19% glycer-ol for 10 minutes freeze trap 10/8 mM K2PtBr6 19% gly-cerol for 90 minutes freeze trap 10/8 mM K2PtBr6 19% glycerol for 170 minutes freeze trap Data collection was carried out on an in house CuKa rotating anode with
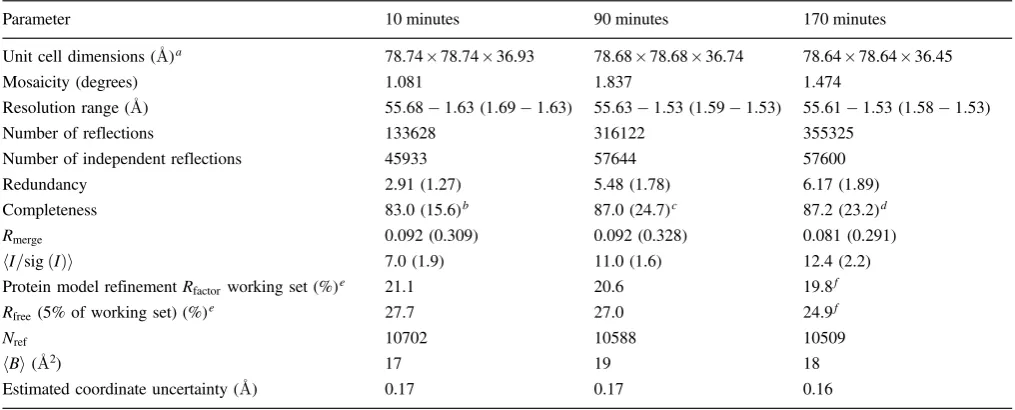
RAXIS IV Image Plate (Supplementary Fig. S4). The X-ray diffraction resolution limit was 1.6A and the crystal size in each experiment 0.3 mm. The detailed processed single crystal diffraction data statistics are given in Ta-ble 1. The single crystal data sets for the 10, 90 and 170 minutes soaks had good redundancy arising from use of total sweep angles of 180, 360 and 360 degrees with 1 de-gree oscillations and exposure times of between 2 to 3 minutes per image. These three data sets are of equiva-lent high quality and very high completeness to 1.8A, which is the diffraction resolution to which each of the three protein model refinements were conducted.
Table 1 summarises the protein single-crystal informa-tion, data collection and processing statistics and protein fi-nal model refinement (in CCP4 REFMAC5) details; the 170 minutes protein model with PtBr6 refined positions are de-posited with the PDB as code ****. The use of the
[image:3.595.49.557.496.701.2]refine-2 J. R. Helliwell, A. M. T. Bell, P. Bryantet al.
Table 1. Summary of the protein single-crystal information, X-ray data collection and processing statistics and protein final model refinement details.
Parameter 10 minutes 90 minutes 170 minutes
Unit cell dimensions (A)a 78.7478.7436.93 78.6878.6836.74 78.6478.6436.45
Mosaicity (degrees) 1.081 1.837 1.474
Resolution range (A) 55:681:63 (1:691:63) 55:631:53 (1:591:53) 55:611:53 (1:581:53)
Number of reflections 133628 316122 355325
Number of independent reflections 45933 57644 57600
Redundancy 2.91 (1.27) 5.48 (1.78) 6.17 (1.89)
Completeness 83.0 (15.6)b 87.0 (24.7)c 87.2 (23.2)d
Rmerge 0.092 (0.309) 0.092 (0.328) 0.081 (0.291)
hI=sigðIÞi 7.0 (1.9) 11.0 (1.6) 12.4 (2.2)
Protein model refinementRfactor working set (%)e 21.1 20.6 19.8f
Rfree(5% of working set) (%)e 27.7 27.0 24.9f
Nref 10702 10588 10509
hBi(A2) 17 19 18
Estimated coordinate uncertainty (A) 0.17 0.17 0.16
a: Protein crystal system tetragonal and space group P43212; data merge made in d*trek (courtesy Dr J. Pflugrath of Rigaku/MSC) in space
groupP4 (Iþand Itreated separately).
b: In the resolution shell 1.84–1.76Athe completeness is 73.7% and at lower resolution basically 100%. c: In the resolution shell 1.73–1.65Athe completeness is 88.5%and at lower resolution basically 100%. d: In the resolution shell 1.72–1.65Athe completeness is 89.2% and at lower resolution basically 100%.
e: The model refinements used data truncated to 1.8Aso as to ensure essentially identical data completeness at100%.
f: The Protein Data Bank deposition of this, best, final model of the 190 minutes soaked protein crystal structure with bound PtBr6 has PDB
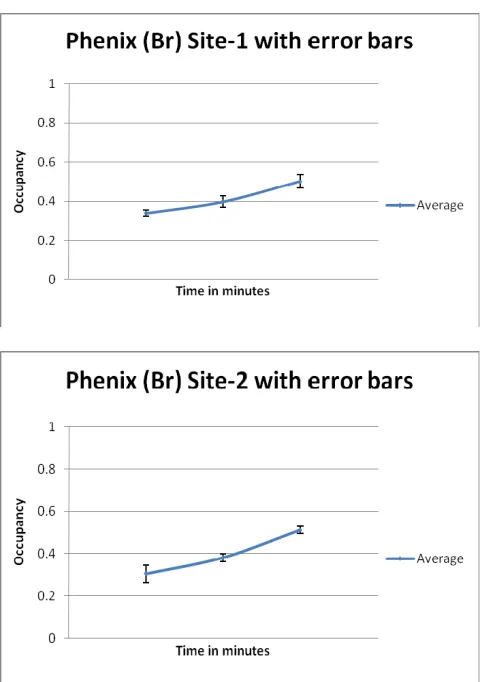
ment program PHENIX provided a quantification of the heavy atom occupancies and these are shown in Table 2 (and Supplementary Fig. S5); the advantage of this ap-proach is that the occupancies are derived from integrated electron density values rather than peak heights and also that the individual bromine atom values can be averaged and yield a spread of values indicative of errors of estimation.
Results
ESRF ID31 yielded high quality protein powder diffracto-grams from K2PtBr6bound to lysozyme; 80 K temperature
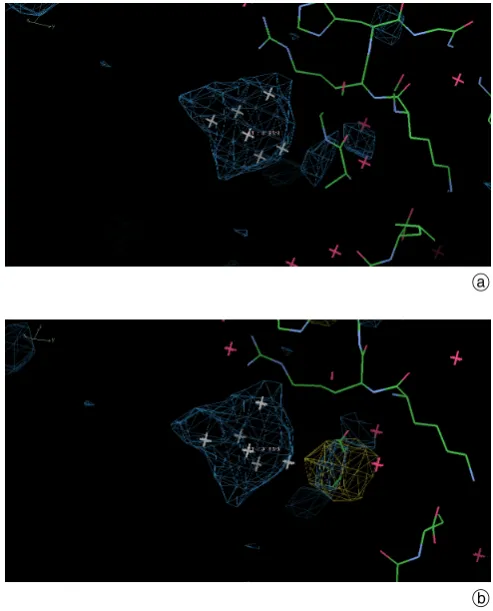
was used so as to protect against X-ray radiation damage as much as possible and also to trap i.e. fix the K2PtBr6 heavy atom compound bound state, which at room tem-perature showed a change from orange to white over ap-proximately 12 hours and which clearly had to be avoided. With multiple powder pattern analysis we have then ex-tracted individual reflection intensities using the Pawley method [8] and software PRODD [9, 10] and thus been able to show the presence of PtBr62bound in lysozyme in (FoFc) Fourier omit maps, based on calculated phases from the PDB model 1LZ8, at two binding sites (Fig. 1a, which is a close up of binding site 1). The equivalent wa-velength dispersive difference Fourier, derived by taking the differences in structure factor amplitudes at the two X-ray wavelengths Br on-edge and Br soft remote, put on a common scale using CCP4 program SCALEIT, for the ID31 data also shows up binding site 1 (at 3.9 sigma) (Fig. 1b). The equivalent dispersive difference Fourier map for the Pt LIII and Pt soft-remote was inconclusive i.e.
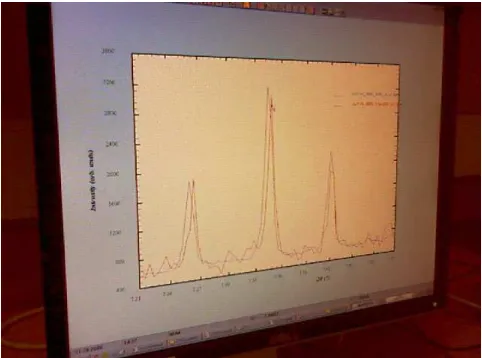
peaks did occur in a cluster close to the binding site 1 but only at 2 sigma. Figure 2 shows a typical PRODD intensity extraction difference plot, this one from data collected on a sample of K2PtBr6 bound to lysozyme with 40% glycerol held at 80 K temperature and with an X-ray energy of 11.5516 keV (1.07327A)i.e.just below the Pt LIII edge at 11.5608 keV (1.0724A). This shows the generally very good quality of the extracted powder intensity data that could be obtained. Figure 3 shows a plot of the correlation of structure factor amplitudes for ‘sample 4’ measured at the soft remote for the Pt LIII edge versus the single crystal observed structure factor amplitudes for the 90 minutes sin-gle crystal study; this shows a good correlation certainly to 6Aresolutioni.e.40% or better.
The detailed binding behaviour of this heavy atom compound, was then revealed in more detail via the single crystal analyses with time-resolved freeze quenching after lysozyme single crystal soak times in nearly 10 mM PtBr6 of 10, 90 and 170 minutes. Whilst the quick soaking of 10 to 30 minutes was used in these, our first powder ex-periments at ESRF ID31, the subsequent time-resolved single crystal characterisation studies show that there is a steady progression of increasing binding strength with
in-Table 2.Single crystal occupancy values for the Pt Sites at 10, 90 & 170 minutes soaking at 1.8A.
Pt occupancy at Site 1
Pt occupancy at Site 2
Pt occupancy at Site 3
[image:4.595.300.543.67.211.2]Soak time 10 Minutes 0.33 0.34 0.2 Soak time 90 Minutes 0.39 0.4 0.18 Soak time 170 Minutes 0.5 0.53 0.2
Fig. 1. (a)FoFc difference Fourier 3.25A electron density map contoured at 2.4s (blue) and superimposed are the positions of the
single crystal 170 minutes study refined Pt and Br positions (Pt is labelled) at site 1, the major site, which is proximal to amino acid residue Arg 14. (b) As (a) but with (in yellow) the 3.0ssoft remote
minus Br K edgef0dip map (i.e.between photon energies respectively of 13.4718 keV and 13.051 keV, i.e. wavelengths respectively of 0.9203Aand 0.95006A) from extracted powder diffraction structure amplitudes with calculated phases at 4A, which yields a ‘dispersive electron density map’ illustrated at site 1. The dispersive peak is to the right of the main envelope but very close to a single bromine site and can reasonably be taken to be the all-bromines dispersive signal (the peak height is 3.9 sigma).
a
b
Fig. 2. Intensity extraction from protein powder data. IðhklÞ values are variables in a profile fit. Black circles – Observed data. Grey line – Calculated Fit. Black line – Difference (Observed – Calculated). Sam-ple K2PtBr6 bound to lysozyme with 40% glycerol, data collected at
80 K and at 11.5516 keV.Rp¼0:970%,Rwp¼1:266%,Rexp¼1:0965,
c2¼1.3332.
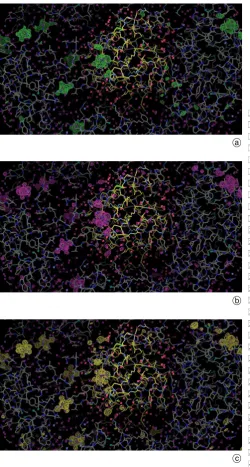
[image:4.595.38.282.91.166.2] [image:4.595.37.284.344.650.2]creasing soak time (Table 2 and Supplementary Fig. S5) and some further optimisation of the binding occupancy of this compound is possible in any future powder diffraction experiment. The single crystal experiments yielded elec-tron density difference map peak heights which also quan-tify a steady increase in binding strength (Figs. 4 a, b and c); binding site 1 increasing from 23 to 30 to 35 sigma for 10, 90 and 170 minutes soaking times respectively .
The ID31 powder data isomorphous difference Fourier protein rigid-body model refinement omit maps are en-couraging showing consistent heavy atom binding beha-viour in all our ID31 samples. A variation in diffraction resolution was seen however with the best being 3.25A
resolution. The comparison of the single crystal HEWL PtBr6 diffraction amplitudes with the extracted powder data for one example of the HEWL PtBr6 samples (sample number 4) shows that via CCP4 SCALEIT theRfactor onF rises from 15% at very low resolution up to 40% at 6A
and seems to assume near random values upto 3.2A i.e.
around 50%. The REFMAC5 rigid body refinement for sample 4 soft remote powder extracted structure factor am-plitudes against the HEWL model (1LZ8), for example, gives an overall Rfactor of 53%, which is relatively high but in a range adequate for starting molecular replace-ment; it yielded calculated phases capable of showing the two main binding sites from these extracted powder data.
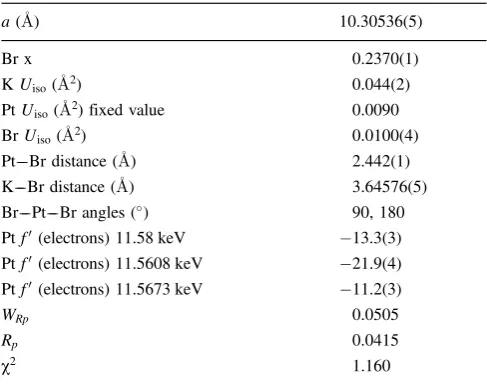
The K2PtBr6 powder diffraction data could be indexed as a single-phase structure with a lattice parameter close to the Fm33mstructure of K2PtBr6[11]. Figure 5 shows a plot of the K2PtBr6 powder diffraction data collected at the 3 different energies at and around the Pt LIII edge on ID31. Note the difference in relative intensities of some Bragg reflections due to the resonant scattering effects. A multi-wavelength Rietveld [12] refinement was done using GSAS [13]. Resonant scattering parameters were deter-mined using GSAS program FPRIME. The Fm33m struc-ture of K2PtBr6 was used as a starting model for this re-finement. Isotropic temperature factors were also refined
[image:5.595.313.564.65.533.2] [image:5.595.50.294.68.259.2]for K and Br. The temperature factor for Pt could not be refined to a sensible positive value so this was fixed at the value in Ref. [11]. Ptf0 parameters were refined for each of the three X-ray energies. Refined structural parameters for K2PtBr6 are given in Table 3. Figure 6 shows the Riet-veld fit for data collected with an example X-ray energy (11.5608 keV). These show reasonable agreement for the derived f0 values with those expected from theory [7]; possible improvements might accrue from starting values of f0, f00 obtained from CHOOCH [14] for each wave-length and then refined in GSAS. Such a detailed investi-gation is outside the scope of this paper but would take account of the stereochemical restraints used in GSAS and where similar studies to be used as examples are [15, 16].
4 J. R. Helliwell, A. M. T. Bell, P. Bryantet al.
Fig. 3. Correlation between extracted powder structure factor ampli-tudes for sample 4 ESRF ID31 Pt LIII edge soft remote data and the 90 minutes soaked PtBr6HEWL single crystal X-ray data. Thex-axis
shows the resolution limit (low resolution to the right and higher re-solution to the left). There is a high correlation, around 90% at 8A
which drops to just under 40% at 6A.
a b c
Fig. 4. Single crystal freeze-quench FoFc electron density differ-ence Fourier maps after REFMAC5 rigid body refinement at 1.8A
resolution (each map contoured at 3s). The steady progression of improved definition for each binding site of the PtBr6 is self evident
as a function of soak times of (a) 10 minutes (top), (b) 90 minutes (middle) and (c) 170 minutes (bottom). [Identical view in each case.]
Conclusions
The protein powder X-ray diffraction experiments on the ly-sozyme with bound K2PtBr6have established various experi-mental factors. We have been able to show that consistent
isomorphous binding of the K2PtBr6compound, as moni-tored by the extracted powder intensity data, has been achieved wavelength dispersive intensity differences around the bromine K edge are evident and led to chemically reason-able difference electron density ‘omit maps’, but so far only for one sample of the two studied at that absorption edge; this is probably due to variabilities of soaking the K2PtBr6, which we have investigated subsequently with the freeze trap single crystal studies the powder work further confirms the high quality of data from ESRF ID31 and of the utility of the intensity extraction procedures notably involving ani-sotropic cell parameter variation to move the intensities slightly in Bragg angle, but as well confirms the wavelength setting procedures are precise and reproduceable.
We seek a further derivative (lysozyme with Ta6Br12) to then embark on difference Patterson and de novo phasing analyses, either within and/or between data sets. The sin-gle crystal time-resolved analytical chemistry results show that further heavy atom signal optimizations, and reprodu-cible behaviour, are possible for improved protein powder diffraction experiments with the K2PtBr6 compound. The crystal structure of K2PtBr6 has also been refined from ID31 high-resolution synchrotron X-ray powder diffraction data recorded at three wavelengths and has usefully guided the protein powder multiple wavelength isomor-phous and dispersive experiments on lysozyme with bound PtBr6. We will soon be extending our approach to the yet larger isomorphous and wavelength dispersive sig-nal case of Ta6Br12bound to lysozyme for powder experi-ments on ESRF ID31.
Overall, such multi heavy atom cluster compounds like K2PtBr6and Ta6Br12offer a way forward to solve de novo unknown protein structures by powder diffraction as a complement to micro-crystallography or by using both ap-proaches in combination. With such an interesting focus for their application in such challenging experiments of de novo protein structure determination of the type described here these particular heavy atom coordination compounds could usefully be investigated in more detail with respect to their X-ray radiation damage sensitivity, which we are also now studying in detail (to be published).
Acknowledgments. We are grateful to ESRF for the provision of beamtime on ID31 and to the University of Manchester for general support. We thank Dr. Andy Fitch for help and encouragement. We wish to acknowledge the use of the EPSRC Chemical Database Ser-vice at Daresbury [17].
References
[1] I. Margiolaki, J. P. Wright, Acta Cryst. 2008, A64, 169–180. [2] J.R. Helliwell, M. Helliwell, R.H. Jones, Acta Cryst. 2005, A61,
568–574.
[3] B. Hedman, K.O. Hodgson, J.R. Helliwell, R. Liddington, M.Z. Papiz, PNAS, 1985, 82, 7604–7607
[4] J.P. Wright, C. Besnard, I. Margiolaki, S. Basso, F. Camus, A. N. Fitch, G. Fox, P. Pattison, M. Schiltz, J. Appl. Cryst. 2008, 41, 329–339.
[5] I. Collings, Y. Watier, M. Giffard, S. Dagogo, R. Kahn, F. Bon-nete´, J. P. Wright, A. N. Fitch, I. Margiolaki, Acta Cryst. 2010, D66, 539–48.
[image:6.595.38.282.66.214.2][6] S. Basso, C. Besnard, J. P. Wright, I. Margiolaki, A. N. Fitch, P. Pattison, M. Sciltz, Acta Cryst. 2010, D66, 756–761.
Table 3. RefinedFm33mstructural parameters for K2PtBr6. Kxyz
co-ordinates¼0.25, Ptxyzcoordinates and Bryzcoordinates¼0.0,i.e.
all special positions and not refined.
a(A) 10.30536(5)
Br x 0.2370(1)
KUiso(A2) 0.044(2)
PtUiso(A2) fixed value 0.0090
BrUiso(A2) 0.0100(4)
Pt––Br distance (A) 2.442(1) K––Br distance (A) 3.64576(5) Br––Pt––Br angles () 90, 180 Ptf0(electrons) 11.58 keV 13.3(3)
Ptf0(electrons) 11.5608 keV 21.9(4)
Ptf0(electrons) 11.5673 keV 11.2(3)
WRp 0.0505
Rp 0.0415
[image:6.595.37.284.272.420.2]c2 1.160
Fig. 5. Normalised X-ray powder diffraction data on K2PtBr6 (i.e.
without protein) collected at different X-ray energies at and near to the Pt LIII edge; note the relative changes of intensities as a function of photon energy.
Fig. 6. Rietveld difference plots for K2PtBr6with an X-ray energy of
11.5608 keV. Black circles are observed data points, grey lines are the calculated curve, black lines are the difference curve and black triangles indicate the positions of K2PtBr6Bragg reflections.
[image:6.595.39.283.509.701.2][7] S. Sasaki, KEK Report 83–22. National Laboratory for High Energy Physics, Tsukuba, Japan. 1984.
[8] G. S. Pawley, J. Appl. Cryst. 14, 1981, 357–361.
[9] J.P. Wright, J. B. F. Forsyth, Report RAL-TR-2000-012. Ruther-ford Appleton Laboratory, 2000.
[10] J.P. Wright, Z. Kristallogr. 2004, 219, 791–802.
[11] H.D. Grundy, I.D. Brown. Canadian Journal of Chemistry, 1970, 48, 1151–1154.
[12] H.M. Rietveld. J. Appl. Cryst., 2, 1969, 65–71.
[13] A.C. Larson, R.B. von Dreele. General Structure Analysis Sys-tem (GSAS), Report LAUR 86-748, Los Alamos National La-boratory. 2004.
[14] G. Evans, R. F. Pettifer J. Appl. Cryst. 2001, 34, 82–86. [15] I. Margiolaki, J. Wright, M. Wilmanns, A. Fitch, N. Pinotsis, J.
Am. Chem. Soc., 129, 2007, 11865–11871.;
[16] S. Basso, A. N. Fitch, G. C. Fox, I. Margiolaki, J. P. Wright. Acta Cryst., D61, 2005, 1612–1625.
[17] D.A. Fletcher, R.F. McMeeking, D.J. Parkin, Chem. Inf. Com-put. Sci. 36, 1996, 746–749.
6 J. R. Helliwell, A. M. T. Bell, P. Bryantet al.
1 1
2 2
3 3
4 4
5 5
6 6
7 7
8 8
9 9
10 10
11 11
12 12
13 13
14 14
15 15
16 16
17 17
18 18
19 19
20 20
21 21
22 22
23 23
24 24
25 25
26 26
27 27
28 28
29 29
30 30
31 31
32 32
33 33
34 34
35 35
36 36
37 37
38 38
39 39
40 40
41 41
42 42
43 43
44 44
45 45
46 46
47 47
48 48
49 49
50 50
51 51
52 52
53 53
54 54
55 55
56 56
57 57
58 58
59 59
60 60
Supplementary Material
Figure S1. The HEWL powder samples soaked in K2PtBr6 loaded into kapton capillaries
[image:8.595.56.297.330.509.2]Figure S3. Single crystals of hen egg white lysozyme after soaking in PtBr6 solution showing thereby, in the e-version of this figure, a yellow/orange colour. Typical crystal size 0.2 to 0.3 mm.
Figure S4. The local RAXIS IV single crystal image plate diffractometer running on a Rigaku rotating anode at CuKα
[image:9.595.56.290.340.515.2]