Combining Business Intelligence with Semantic
Technologies: The CUBIST Project
DAU, Frithjof and ANDREWS, Simon <http://orcid.org/0000-0003-2094-7456>
Available from Sheffield Hallam University Research Archive (SHURA) at:
http://shura.shu.ac.uk/8606/
This document is the author deposited version. You are advised to consult the
publisher's version if you wish to cite from it.
Published version
DAU, Frithjof and ANDREWS, Simon (2014). Combining Business Intelligence with
Semantic Technologies: The CUBIST Project. In: HERNANDEZ, Nathalie,
JÄSCHKE, Robert and CROITORU, Madalina, (eds.) Graph-Based Representation
and Reasoning. Lecture Notes in Computer Science (8577). Springer, 281-286.
Copyright and re-use policy
See
http://shura.shu.ac.uk/information.html
adfa, p. 1, 2011.
© Springer-Verlag Berlin Heidelberg 2011
Combining Business Intelligence with Semantic
Technologies: The CUBIST project
Frithjof Dau, Simon Andrews
SAP AG, Germany (Frithjof.dau@sap.com) Sheffield Hallam University (S.Andrews@shu.ac.uk)
Abstract. This paper describes the European Framework Seven CUBIST project, which ran from October 2010 to September 2013. The project aimed to combine the best elements of traditional BI with the newer, semantic, technolo-gies of the Sematic Web, in the form of RDF and FCA. CUBIST's purpose was to provide end-users with "conceptually relevant and user friendly visual analyt-ics" to allow them to explore their data in new ways, discovering hidden mean-ing and solvmean-ing hitherto difficult problems. To this end, three of the partners in CUBIST were use-cases: recruitment consultancy, computational biology and the space industry. Each use-case provided their own requirements and evaluat-ed how well the CUBIST outcomes addressevaluat-ed them.
1
Introduction
CUBIST - Combining and Uniting Business Intelligence and Semantic Technologies – is an EU-funded research project which ran from Oct. 2010 until Sept. 2013. This paper summarizes key achievements and results of CUBIST.
CUBIST is the joint effort of seven partners, namely SAP AG/SAP (Germany), Ontotext/ONTO (Bulgaria), Sheffield Hallam University/SHU (UK), Centrale Re-cherche S.A./CRSA (France), Heriot-Watt Universit/HWU (UK), Space Applications Services NV/SAS (Belgium), and Innovantage/INN (UK). SAP, ONTO, SHU and CRSA haven acted as technical partners, developing the CUBIST prototype. HWU, SAS and INN in turn have served as use-case partners.
The CUBIST project developed methodologies and a platform that combines es-sential features of Semantic Technologies and BI. The most-prominent deviations from traditional BI-platforms are:
• The data persistency layer in the CUBIST-prototype based on a BI enabled triple store, thus CUBIST enables a user to perform BI operations over semantic data.
• In addition to some traditional charts, CUBIST provides novel graph-based visu-alizations to analyse the data. Formal Concept Analysis is used as the mathemat-ical foundation for meaningfully clustering the data.
• Factual search: A semantic search that allows the user to query the data in order to retrieve entities which satisfy user-defined constraints.
• Explorative search: A graph-based view that allows the user to interactively ex-plore the data.
• Visual analytics: Clusters and aggregations of data can be visually analyzed using traditional charts or novel visualizations. The selection of the visualized data as well as the visualizations are highly interactive, thus CUBIST provides 'BI as a self-service'.
2
Architecture and Software Components
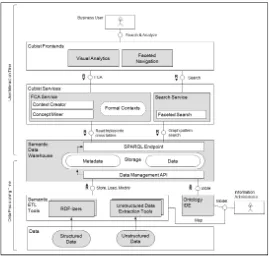
In the project, a reference architecture for a semantic BI-system has been defined. Figure 1 depicts this reference architecture. It consists of five layers:
• The Data Layer includes all structured and unstructured data sources relevant to the CUBIST system. Examples for such data are: structured relational databases and Excel files, unstructured web documents, semi-structured XML documents.
• The Semantic ETL Layer comprises different software products and components that help accessing, extracting and transforming data into a unified RDF data model so that the legacy data can be stored in the RDF data warehouse.
• The Semantic Data Warehouse is a persistence layer containing a high-performance RDF database, responsible for storing and querying semantically en-riched data and its related schema information (ontology). This is provided by OWLIM: a highly scalable triple store from ONTO. In addition, this layer con-tains a Data Management API which enabled the semantic ETL tools to store and update data in the RDF data warehouse; as well as a SPARQL endpoint provid-ing a data query and access interface (1).
• The CUBIST Services Layer includes the Search Service component (which offers application logic to navigate and search the semantic data warehouse) pro-vided by NowaSearch frontend and Search Service from SAP and the FCA Ser-vice component (which manages the formal context lifecycle) provided by SHU and is a new development within CUBIST. FCAService provides features of the standalone tools FcaBedrock (2) and In-Close2 (3) as web-services.
• Finally, the CUBIST Frontend Layer is comprised of all GUI tools used by the end users including CUBIX (4) by CRSA which is a standalone FCA visualiza-tion and analysis tool newly developed for CUBIST and which serves as the main visual analytics frontend.
Fig. 1. FMC1 diagram of the CUBIST reference architecture
3
User Workflow
The data schema of each use-case was modelled in RDFS. The start screen of the prototype is the “search and select view”, which follows the faceted search paradigm. The facets shown there correspond to the RDFS-classes in the backend. A facet of interest (FoI) is selected (later on, entities of this class will serve as formal objects in the FCA-based visual analytics). Attributes (datatype properties) can be chosen to be visualized and used for filtering. If the attribute is a nominal attribute, checkboxes of the attribute values are used to include only objects carrying the chosen value(s). If the attribute is ordinal, the user can select intervals of values for filtering. For exam-ple, a user can select a FoI and use attributes of other facets to filter down the result set, being a subset of his FoI. In the backend, the CUBIST query generator finds the first-found smallest subgraph where all needed types are included, and uses this sub-graph in its search engine. For the result-set, there is a listview where the found FoI-elements with their FoI-specific attributes are shown. A tabular view shows only the names of the FoI elements, but attributes of possibly different facets and can be visu-ally analyzed with traditional charts or graph- and FCA-based visualizations.
If the resultset consists of only a few entities, they can serve as starting point for exploring their neighborhood in the in graph-based data. The “graph-exploration
1
view” provides a node-edge visualization, where the nodes depict entities (instances) in the data and labelled edges depict the selected relations between the entities. Via different user interactions, nodes and edges can be added to or removed from the view. Zooming and panning, as well as restricting the displayed nodes to regions of interest allow the user to interactively explore the neighborhood of the result set.
Fig. 2. CUBIX prototype for VA-frontend
A result set defined in the search and select view can be visually analyzed with FCA methods. The result set consists of entities with selected attributes, which can be strings, numbers, or date-time-values. This result set has first to be converted into a formal context. This is done in the “conceptual scaling view”, where the use can scale many-valued attributes into binary formal attributes using a number of FCA tech-niques (5, 6). Conceptual scaling in CUBIST is the counterpart of data aggregation methods in traditional BI systems.
Finally, the scaled result set can be analyzed with FCA methods in the “analyze view”. In this view, several kinds of diagrams are provided. First of all, the well-known Hasse-diagrams are utilized, as well as Sankey diagrams. Via duplication of formal concepts, the concept lattice can be turned into a tree, and different tree visual-izations like sunburst-diagrams and a standard tree visualization can be used. Apart from the user-chosen main diagram, standard charts like bar charts or a graph visuali-zation are connected to the main diagram with linking-and-brushing show specific details. The analyze view provides functionalities to interactively filter and drill down the presented data. Finally, apart from visualizing the concept lattice, association rules can be displayed, filtered and explored.
4
Use Cases
The three use case partners HWU, SAS and INN provided three use cases with differ-ent needs to analyze the data.
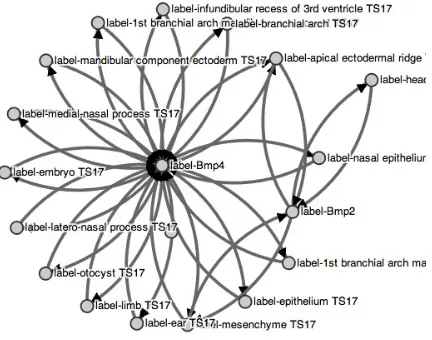
[image:6.595.190.406.308.478.2]HWU provided a biomedical informatics use case. In this use case, gene expression data of mouse embryos is analyzed (7) to explore the co-occurrence of genes in dif-ferent tissues (body parts of the mouse), and the change of level of expressiveness of a gene during the development of a mouse. Traditional BI tools fall short for these kind of questions, and in fact, before CUBIST there were no tools to analyze the gene expression data in this use case. The dataset of this use case contained six RDFS clas-ses and ~1.400.000 triples.
Fig. 3. Attribute implication
SAS provided a Control Center operations use case: In mission control rooms in space Control Centers very large volumes of data are obtained from heterogeneous sources. The CUBIST prototype was used to analyze telemetry data of solar equip-ment. This equipment logs ~200 attributes per second, and CUBIST was used to de-tect patterns of attributes and attribute values in this data which appear during failures of the equipment. Before CUBIST, SAS had no proper tools to conduct this task. The SAS dataset contains only one RDFS-class with ~200 properties and contained ~500.000.000 triples.
5
Evaluation and Conclusion
A detailed evaluation was carried out by end-users for each use-case, involving ques-tionnaires, walk-throughs and problem solving tests. Overall, CUBIST was more highly rated by the HWU and SAS users than the INN users. In other words: CUBIST is better suited for the novel ways to analyse information required by the HWU and SAS use-cases and less suited for the traditional BI approach required by INN (8). The CUBIST approach is not improving, but complementing traditional BI-means.
A main feature of CUBIST was the integration factual search, explorative search and visual analytics data (9). The evaluation showed that supporting these different types of information need was appreciated by the users, and each of the corresponding components was rated useful for specific information needs.
The visual analytics in CUBIST are dominated by novel visualizations which show clusters and dependencies, instead of numerical results, linked to some traditional visualizations. The visual analytic features target the more novel information needs. Having different types of visualizations integrated in one BI-tool was positively rated, even if some visualizations (such as an FCA lattice) are in the beginning hard to un-derstand. The ease of use and visual appeal were less well-rated, however, perhaps reflecting the still prototypical nature of the CUBIST components.
Finally, the users concluded that CUBIST was an expert tool. The novel approach-es taken in CUBIST need some learning effort in the beginning. Neverthelapproach-ess, CUBIST provided new insight into the users' data. The effort required to use the tools and read the FCA-based results was outweighed by the answers that they provided.
6
References
1. Dau F. Towards scalingless generation of formal contexts from an ontology in a triple store International Journal of Conceptual Structures and Smart Applications. 2013;1(1):18-37.
2. Andrews S, Orphanides C. FcaBedrock, a formal context creator. ICCS 2010; ; 2010.
3. Andrews S. In-Close2, a high performance formal concept miner. ; 2011.
4. Melo, C., Mikheev, A., Le-Grand, B., Aufaure,M.-A. Cubix: A visual analytics tool for conceptual and semantic data. Proceedings of the 12th international conference on data mining workshops; IEE; 2012.
5. Wolff KE. A first course in formal concept analysis: How to understand line dia-grams. Advances in Statistical Software. 1993;4:429-38.
6. Andrews S. Data conversion and interoperability for FCA. ; 2009.
7. Richardson L, Venkataraman S, Stevenson P, Yang YaB,N., Rao J, Fisher M, et al. EMAGE mouse embryo spatial gene expression database: 2010 update. Nucleic Acids Res. 2010;38(Database issue):D703-9.
8. Orphanides C. Exploring the applicability of formal concept analysis on market intelligence data. ; 2011.