against children in Egypt using Bayesian geospatial
modelling with multiple imputation
KHATAB, Khaled <http://orcid.org/0000-0002-8755-3964>, RAHEEM, Maruf
A., SARTORIUS, Benn and ISMAIL, Mubarak
<http://orcid.org/0000-0001-6601-9781>
Available from Sheffield Hallam University Research Archive (SHURA) at:
http://shura.shu.ac.uk/24648/
This document is the author deposited version. You are advised to consult the
publisher's version if you wish to cite from it.
Published version
KHATAB, Khaled, RAHEEM, Maruf A., SARTORIUS, Benn and ISMAIL, Mubarak
(2019). Prevalence and risk factors for child labour and violence against children in
Egypt using Bayesian geospatial modelling with multiple imputation. PLOS ONE, 14
(5), e0212715.
Copyright and re-use policy
See http://shura.shu.ac.uk/information.html
Prevalence and risk factors for child labour
and violence against children in Egypt using
Bayesian geospatial modelling with multiple
imputation
Khaled KhatabID1*, Maruf A. Raheem2, Benn Sartorius3, Mubarak Ismail1
1 Faculty of Health and Wellbeing, Sheffield Hallam University, Sheffield, United Kingdom, 2 Department of
Engineering and Mathematics, Sheffield Hallam University, Sheffield, United Kingdom, 3 Department of Disease Control, Faculty of Infectious and Tropical Diseases, London School of Hygiene and Tropical Medicine, London, United Kingdom
Abstract
Background
The incidence of child labour, especially across developing nations, is of global concern. The use of children in employment in developing economies constitutes a major threat to the soci-eties, and concerted efforts are made by the relevant stakeholders towards addressing some of the factors and issues responsible. Significant risk factors include socio-demographic and economic factors such as poverty, neglect, lack of adequate care, exposure of children to various grades of violence, parental education status, gender, place of residence, household size, residence type or size, wealth index, parental survivorship and household size. Egypt is the largest country in Africa by population. Although UNCIF 2017 reported that the worst forms of child labour in Egypt are concentrated in domestic work, forced begging and com-mercial sexual exploitation, the situation has received little attention. There are still very few studies initiated specifically to look at child labour in domestic service in Egypt and those that exist have been limited in the scope of their methodology. Geographical coverage and research for child labour in Egypt is also limited, as are accurate statistics and data. There was, therefore, a strong case for looking again at the domestic child labour phenomenon in Egypt, especially after the Demographic Health Survey (DHS) released the first data about child labour in Egypt in 2014. This study builds on the few findings of earlier work, and broad-ens coverage by including advanced methods and geographical effects of this problem.
Objectives
This study focuses on identifying socio-demographic, economic and geospatial factors associated with child labour participation.
Methods
We used the 2014 Egypt Demographic and Health Survey (EDHS) from the Ministry of Health and Population in Egypt, with the record of 20,560 never-married children aged 5–17
a1111111111 a1111111111 a1111111111 a1111111111 a1111111111 OPEN ACCESS
Citation: Khatab K, Raheem MA, Sartorius B, Ismail M (2019) Prevalence and risk factors for child labour and violence against children in Egypt using Bayesian geospatial modelling with multiple imputation. PLoS ONE 14(5): e0212715.https:// doi.org/10.1371/journal.pone.0212715
Editor: Aisha K. Yousafzai, Harvard TH Chan School of Public Health, UNITED STATES
Received: February 6, 2019
Accepted: May 2, 2019
Published: May 30, 2019
Copyright:©2019 Khatab et al. This is an open access article distributed under the terms of the
Creative Commons Attribution License, which permits unrestricted use, distribution, and reproduction in any medium, provided the original author and source are credited.
Data Availability Statement: Data underlying the study is available within the manuscript and its Supporting Information files.
Funding: The authors received no specific funding for this work.
years engaging in economic activities, in and out of their home. The data focused on demo-graphic and socio-economic characteristics of household members. Multivariate Bayesian geo-additive models were employed to examine the demographical and socio-economic factors for children working less than 16 hrs; between 16 and less 45 hrs; and over 45 hrs weekly.
Results
The results showed that at least 31.6% of the children in the age group from 5–10 were working, 68.5% of children aged 11–17 years were engaged in child labour for a wage, and 44.7% of the children in the age group from 5–10 were engaged in hazardous work. From the multivariate Bayesian geo-additive models, female children (with male children as refer-ence category) working at least 16 hrs (OR: 1.3; with 95% CI: 1.2–1.5) were more likely to be engaged in child labour than girls working 16 to 45 hrs (OR: 1; 95% CI: 0.3–1.5). Children born to women without formal education, in non-hazardous jobs, irrespective of the hours spent at work, were more likely to be involved in child labour (52.9%, 56.8%, 62.4%) com-pared to children of mothers with some level of education. Finally, children who have experi-enced psychological aggression and physical punishment are more likely to be used as child labour than those without such experience across the job types and hours spent. North-eastern Egypt has a higher likelihood of child labour than most other regions, while children who live in the Delta are more engaged in hazardous work.
Conclusion
This study revealed a significant influence of socio-demographic and economic factors on child labour and violence against children in Egypt. Poverty, neglect, lack of adequate care and exposure of children to various grades of violence are major drivers of child labour across the country. The spatial effect suggests the need to give more attention to some areas that have high rates of child labour, such as the Nile Delta, Upper Egypt, and North-eastern Egypt.
Introduction
In 1989, the General Assembly of the United Nations issued Resolution 44/25, the Convention on the Rights of the Child, which defines a child as a human being below 18 years of age. This convention emphasised the need to seek to protect children from performing any work that could be hazardous, interfere with their education, or damage their health or physical, mental, spiritual, moral or social development [1]. It also required Member States to take legislative, administrative, social and educational measures to ensure such protection. In addition, these states are obligated, according to this convention, to set a minimum age for employment, determine an adequate system of working hours and working conditions and impose appro-priate penalties to ensure the effective application of these conditions.
Statistics (2010) indicate that there are around 11 million children under 15 in Egypt, and around 1.6 million work in child labour (ages 6 to 15) [4]. In 2015, the World Food Program and the European Union reported that the number of employed minors in Egypt had jumped to at least 2.7 million. Most of them work six days a week, for an average of 12 hours a day. They constitute an additional source of income for their families, who depend on that income to provide for one-third of their expenditures. Approximately 78% of working children are employed in the countryside, and most of them are female. Between 1 and 1.5 million are employed in agricultural labour. Of all working children, 84% live in rural areas and 16% in urban areas. Some recent statistics indicate that children who were engaged in child labour have experienced punishment and abuse, largely physical or verbal [4,5].
Egypt has agreed to the ratification of the International Labour Treaty No. 138 of 1973 in addition to many international treaties which eliminate the criminal economic exploitation of children and aim in the long term for the total elimination of child labour. Egypt has also signed International Labour Treaty No. 182 of 1999, which is complimentary to Treaty No. 138, which urges the elimination of the worst forms of child labour initially, with the goal of eliminating all child labour. All forms of child labour are included in this agreement which also emphasises the importance of free basic education for children [4]. According to the UN, the child has the right to be protected from economic exploitation and from performing any work that is likely to be hazardous or to interfere with the child’s education or be harmful to the child’s health or physical, mental, spiritual, moral or social development [6]. The legal employment age in Egypt is 18, the age when children should finish secondary school, while 21–22 is the age when they should finish their first degree at university.
Child labour is a narrower concept than children in employment. It is defined by the ILO Minimum Age Convention, 1973 (No. 138) and the ILO Worst Forms of Child Labour Con-vention, 1999 (No. 182) [4]. The definition used here is also based on Ministerial Decree 118 of 2003 issued by the Minister of Manpower and Migration, the national legislation that defines the occupations that children under the age of 18 are not allowed to engage in [7]. Despite this, the distribution of the population by age is such that a relatively high percentage of the population is young: those below the age of 15 represent about 37.5% of the total popula-tion, and of this 37.5%, 7% of Egyptian children below the age of 15 were engaged in child labour in 2009 [8]. Egypt is the fourth highest country for child labour, according to the World Bank, 2015 [5].
The major contributing factors to child labour in Egypt are poverty, deteriorating economic conditions and increasing inflation, which means that the situation is likely to worsen [8]. The poverty index measures severe health deprivation by the ratio of individuals who are not esti-mated to live to age 40. The 2004 Human Development Report (HDR) states that 3.1% (2.2 million people) of the total population of Egypt lives on less than USD 1 per day [9].
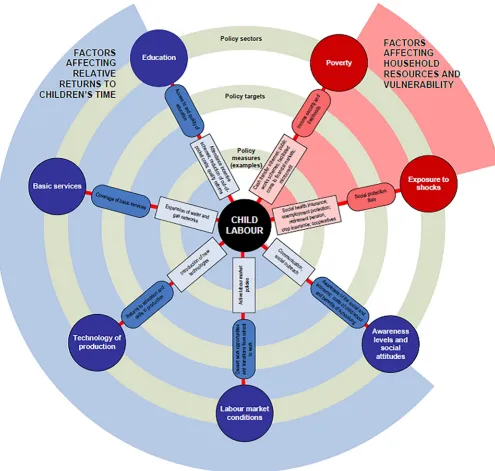
Fig 1shows the risk factors influencing households concerning child labour and factors affecting relative returns to children’s time. It shows that child labour is a symptom of poverty, but other factors also affect child labour [10]. These include work and schooling and how chil-dren or the household allocate time between schooling and work to increase household income.
poor while only 8% of those who finished university were poor. Among large households with more than 10 members, 67% are poor[11].
This outlines the main challenges that parents and their children are facing, which allows us to understand the link between poverty, population density, size of household, restrictions in access to goods and services and lack of education, and how all of these factors have contrib-uted to the increase of child labour in this region.
[image:5.612.76.571.75.546.2]It is difficult to find accurate statistics on child workers or accurate studies that have dis-cussed this problem properly. Therefore, there is an urgent need for a study that can describe this problem accurately, discuss the causes of it and provide some suggestions that may help
Fig 1. Factors influencing household concerning child labour (Source: Understanding child’s work, a joint LIO-UNICEF-the world bank report, 2017).
decision-makers to handle this issue. Due to the negative effect of this phenomenon on the society, it is important to precisely investigate this problem further and thoroughly, using the results to improve outcomes and the situations for children [13]. This study, therefore, focuses on identifying socio-demographic, economic and geospatial factors associated with child labour participation.
Materials and methods
The analysis in this work is based on data obtained from the 2014 Egypt Demographic and Health Survey (EDHS) (S1 Data) (Supporting Information) which is the most recent data on
child labour in Egypt. The Survey was conducted by Egypt’s Ministry of Health and Population and the National Population Council in collaboration with Macro International [8]. As this was a secondary data analysis of open access data, ethics approval was not required. The sam-ple for the 2014 EDHS was designed to provide estimates of population and health indicators, welfare indicators, and other indicator rates for the country as a whole and for six major subdi-visions (Urban Governorates, urban Lower Egypt, rural Lower Egypt, urban Upper Egypt, rural Upper Egypt, and the Frontier Governorates) [8]. The sample likewise allows for esti-mates of most key indicators at the governorate level.
To allow for separate estimates for the major geographic subdivisions and the governorates, the number of households selected from each of the major sectors and each governorate was disproportionate to the size of the population in the units [8]. Thus, the dataset was weighted before proceeding with the analysis.
Study area and data
The EDHS allows for an assessment of several key aspects of the welfare of Egypt’s children. Questions were included on birth registration and living arrangements and the survival status of parents. Data was also collected on the prevalence of injuries and accidents and disabilities among young children. A child’s access to education is critical, and the EDHS obtained infor-mation on both the level of pre-school education among young children and children’s partici-pation in primary and secondary school.
The survey also looked at the extent of child labour and at the practices used in disciplining children. In the 2014 EDHS, the first step in the administration of the child labour and child discipline modules involved the identification of a single child age 1–17 years for whom ques-tions in the modules would be asked depending on the child’s age. If the household included more than one child in the age range, the child for whom the modules were administered was selected using a Kish grid. The name of Leslie Kish, the Hungarian born American statistician who was one of the world’s leading experts on survey sampling. If the selected child was 5–17 years, the child discipline module was administered for the child. To account for the selection of one child per household, the child discipline data was weighted. The weight is based on the
de jurepopulation of children age 1–17 years [8].
Description of outcome variables
(USAID), the London School of Hygiene and Tropical Medicine, and the United States Cen-ters for Disease Control and Prevention (CDC). This study used the ILO classifications which are based on the number of hours worked per week, in three groups: A)�16 hrs a week; B)
>16<45 hrs a week; and C)�45 hrs a week.
The economic activities were classified into three groups: A) non-hazardous wage work; B) hazardous wage work; and C) household work. Work was considered hazardous if it involved carrying heavy loads, working with dangerous tools or operating heavy equipment, working at heights, working with chemicals or explosives, exposure to dust, fumes, gas, extreme heat or humidity, loud noise or vibrations, or any other working conditions considered to be bad for the child’s health and safety (EDHS, 2014)
Risk factors and covariates
We considered the following socio-demographic factors and the associated risk factors of child labour as explanatory variables: child’s age (5–17 years), sex, household size, place of residence, wealth index, mother’s education, father’s education, parental survivorship and violent disci-pline approaches against children. The wealth index was used as proxy for the socio-economic position of the household because EDHS did not collect information on household income and expenditure. Egypt comprises 27 governorates, which were categorised by EDHS into 7 areas: Urban governorates, Lower Egypt urban, Lower Egypt rural, Upper Egypt urban, Upper Egypt rural and Frontier governorates. However, in spatial analysis, we have used 27 governor-ates to investigate the spatial effects in the prevalence of overlap economic activities of children at the state level. This was achieved using a geo-additive semi-parametric multinomial model [15].Fig 2shows the multilevel risk factors of child labour that applied to this study and how these factors affected child labour on different levels.
Statistical methods
LetYijkandπijkrepresent the type of work and probability of working hours respectively. Let
working hours of at least 15 hrs (k= 1); working hours falling between 16 and 45 hrs a week be (k= 2), and the working hours of over 45 hrs a week be (k= 3).
Yij�MNðPij;NijÞ ð1Þ
We assume thatYijkis distributed as a multinomial distribution, such that:Yij~MN(1,πijk)
whereπijk= (πij1,πij2,πij3)0. Given some categorical covariates,Zij, metrical covariates,υikand
state-specific random effect,Sik, the probability can be modelled thus:
Pijk¼ Zijk .
SkZijk¼
expðZijkÞ
Pk
1expðZijkÞ
; 8k¼1;2;3 ð2Þ
The predictor,ηijkis given byηijk=zijβk+fk(υij)+Sikwhereηijkis a known response function
with a logit link function,βkwhich is the vector of the regression parameters (explanatory
vari-ables such as gender, place of residence, etc.) andfkis a smooth function for the metrical
covar-iates (child’s age) which were assumed to be nonlinear in some previous studies for each of the status categories, k [16–18]. We have included these variables as nonlinear metrical covariates in the early stage of this study; however, the pattern did not show exactly the significance level of each category. Therefore, we used these covariates as linear effects instead to assess the sig-nificance level of each category. We set the last category (over 45 hrs) as reference category.
The random effects,Sikare district or sub-district specific factors, which can be split into
that,Sik=θik+ϕik. P-spline priors were assigned to the functions;f1,f2,. . .fpwhereas, a Markov
random field prior was used for f(si) [19,20].
To estimate model parameters, we applied a fully integrated Bayesian approach. Though the estimation method with this model is difficult, the estimated posterior odds ratios (OR) that were produced could be understood as similar to those of normal logistic models. The analysis was carried out using version 2.1 of the BayesX software package, which certifies Bayesian inference based on Markov chain Monte Carlo (MCMC) simulation technique [19, 21–23].
Both the descriptive statistics and chi-square tests were carried out to examine the level of associations between predictors, confounders, and outcome variables using version 14 of STATA, and p-values of less than 0.05 were considered statistically significant. The multino-mial logistic regression model was used to determine the degree of associations between the outcome variables (a type of work indicators) and all the predictors. Posterior Odds Ratios (OR) and their 95% confidence intervals (CI) were estimated.
Multiple imputations analyses (missing data). This dataset has a significant proportion
[image:8.612.73.576.76.413.2]of missing data although the missingness is concentrated only in a few variables. At this stage, we will assess the monotone patterns and the joint probability of missing across variables; thereafter we will identify the potential predictors of each variable that requires modelling [24–27]. The patterns of missingness were obtained to investigate the monotone patterns of missing and to assess the appropriate modelling that can handle these missing values.
Fig 2. A multilevel risk factors of child labour that applied in this study.
One analytic option is to use only the dataset with complete observations, or we can replace the missing values through a process termed ‘imputation’. The simplest imputation replaces the missing value with mean or median value for that variable; however, this is not a desirable process, especially when one is examining the relationships between variables.
However, the more sophisticated method, termed ‘multiple imputations’, predicts missing values for a variable using existing values from other variables. The predicted values, called ‘imputes’, are substituted for the missing values, resulting in a full data set called an ‘imputed data set’ [27,28]. This method imputes dataset using standard procedures for complete data and combines the results from these analyses.
No matter which complete data analysis is used, the process of combining results from dif-ferent data sets is essentially the same. We use the data from units where both (Y,X) are observed to learn about the relationship between Y and X, then use this relationship to com-plete the data set by drawing the missing observations from,X|Y. This process is completed at least N = 5 times, giving rise to N complete data sets. Then each of these imputed data sets is analysed and we combine the results using specific rules. It does not attempt to estimate each missing value through simulated values but rather to represent a random sample of the missing values [29,30]. Multiple imputations inference involves three distinct phases as follows:
1. Create imputed data sets which are plausible representations of the data.
2. Perform the chosen statistical analysis on each of these imputed data sets by using standard procedures.
3. The results from the complete data sets are combined ‘average’ for the inference to produce one set of results.
Analyses based on multiple imputed data will avoid bias only if enough variables that dict the missing values are included in the imputation models. Thus, including as many pre-dictors as possible tends to make the missing-at-random assumption more plausible [31]. However, including more than 25 predictors will increase the variance explained in the predic-tion equapredic-tions [32].
Multiple imputations are a more appropriate choice as a solution to missing data problems as this method represents a good balance between quality of results and ease of use. It has been shown to perform favourably compared to other methods in a variety of missing data situa-tions [33]. It can also produce unbiased parameter estimates which reflect the uncertainty asso-ciated with estimating missing data, and has been shown to be robust to departures from normality assumptions and to provide adequate results in the presence of low sample size or high rate of missing data.
The results of some previous studies using the most commonly used multiple imputation methods, Expectation Maximization (EM-algorithm)[34] and the Monte Carlo Markov chain (MCMC) method, showed that there was no significant difference between EM algorithm and the MCMC method for item imputation, and that the number of items used for imputation has little impact.
However, in this study, we applied the MCMC method based on pseudo-random draws and this allowed us to obtain several imputed data. MCMC can be used with both arbitrary and monotone patterns of missing data. It is known as a collection of techniques for simulating random draws from difficult probability distributions via Markov chains. MCMC is also espe-cially useful in Bayesian statistical analyses and for solving difficult missing-data problems [28, 35,36].
Assumptions about missing data. If EDHS data contained observations that were
dataset. Multiple imputations assume that the observed variables are predictive of the missing values and that the data is missing at random. Missing data is said to be missing at random (MAR) if the probability that it is missing does not depend on unobserved data but may depend on observed data. MCAR can be viewed as a particular case of MAR.
If the subjects are withdrawn from the study for ethical reasons, missing would not be MAR. This type of missing-data mechanism is called missing not at random (MNAR). For such missing data, the reasons for its missingness must be accounted for in the model to obtain valid results. We looked at missing data patterns and also assessed the extent of missing in the variables that were included in the analysis. Nonlinear relationships were treated using semi-parametric models (e.g. generalised additive models (GAMs)) [22]. It was important to include the outcome variable (in this case, economic activities) as a predictor in the imputation model because failing to do so will dilute the associations between the outcome and the other vari-ables[37]
Results
Prevalence and sectoral distribution of child labour
[image:10.612.199.577.91.154.2]We used the 2014 Demographic and Health Survey (EDHS) from the Ministry of Health and Population in Egypt, with the record of 20,560 children aged 5–17 years engaging in economic activities, in and out of their home. The data focused on demographic and socio-economic characteristics of household members
Table 1shows statistics on child work and education in Egypt according to the UNESCO Institute for Statistics, 2015. WhileTable 2shows an overview of children’s work by sector and activity in Egypt according to the US Department of Labour report, 2016 [38]
Table 1shows that at least 6.7% of the children in the age group from 5–14 are working, 88.1% of children aged 6–14 years are attending school, and 6.3% engage in child labour while
Table 1. Statistics on child work and education in Egypt according to the UNESCO Institute for Statistics, 2015.
Children Age Per cent
Working (%) Population 5-14yrs 6.7(993,417)
Attending school (%) 6–14 88.1
Combining Work and school (%) 7–14 6.3
Primary Completion Rate (%) 10.8
[image:10.612.198.578.543.699.2]https://doi.org/10.1371/journal.pone.0212715.t001
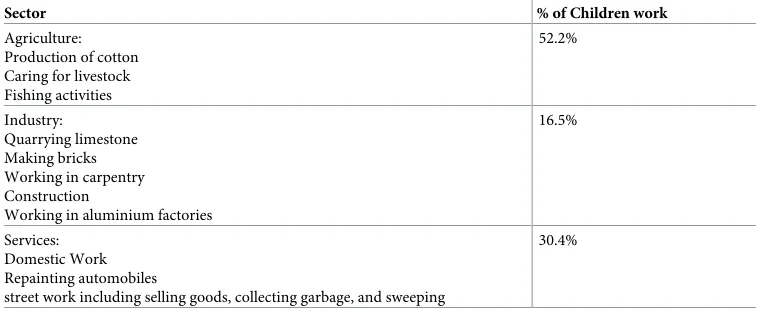
Table 2. An overview of children’s work by sector and activity in Egypt (Bureau of labour Statistics, 2016).
Sector % of Children work
Agriculture: Production of cotton Caring for livestock Fishing activities
52.2%
Industry:
Quarrying limestone Making bricks Working in carpentry Construction
Working in aluminium factories
16.5%
Services: Domestic Work Repainting automobiles
street work including selling goods, collecting garbage, and sweeping
30.4%
attending school. Only 10.8% complete primary school.Table 2provides an overview of chil-dren’s work by sector and activity in Egypt. It shows that over 52% of children are working in agriculture followed by 30.4% who are engaged in service sectors [38,39].
Table 3shows the distributions of the missing values among the risk factors.
Distribution of factors analysed in child labour in Egypt (DHS 2014)
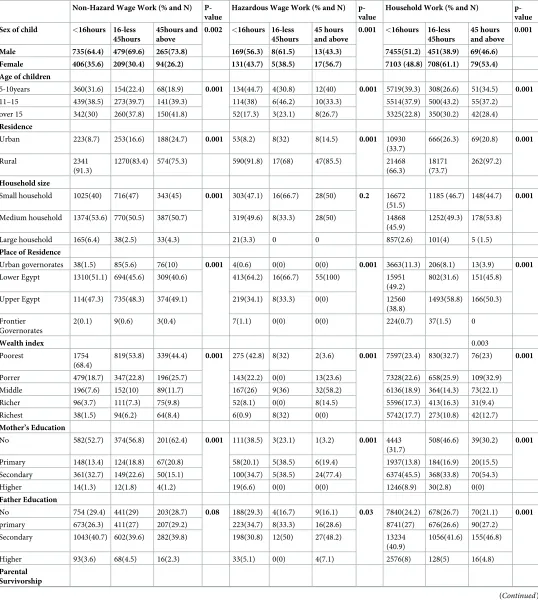
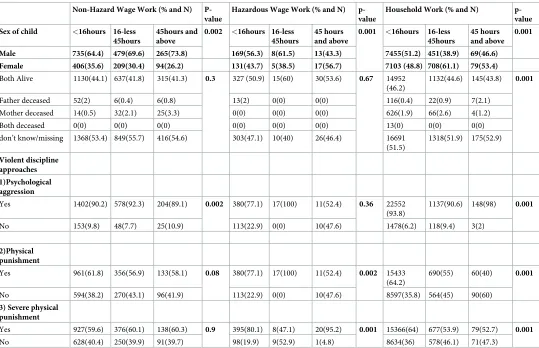
Table 4presents the distribution of socio-demographic factors relating to child labour includ-ing violence against children aged 5–17 years in Egypt with respect to the weekly length of working hours in jobs that are hazardous, non-hazardous and household-based.
The following factors were significantly associated with non-hazardous wage work (see Table 4): gender of a child (P = 0.002); residence type, household size, place of residence and
wealth indices (P = 0.001 each); violent discipline approach, especially: psychological aggres-sion (P = 0.002) and physical punishment (P = 0.08). However, the following factors were not significant in this category: parental education, parental survival and severe punishment. For the hazardous wage work, the non-significant factors were household size, parental survivor-ship, and psychological aggression against children. While, gender, the age of children, place of residence, wealth indicators, mother’s education, physical and severe punishments were sig-nificant (each with P = 0.001). Father’s education had a slight effect. For household work, all the factors were highly significant (each with P = 0.001).
The percentage of male children involved in child labour is higher than that of female chil-dren, irrespective of the job type (non-hazardous, hazardous and household-based work) and the length of job, except that female children in a household job who are working at least 16 hours weekly have a higher percentage (61.1%) than male children (53.4%). Also, children from rural communities are more likely to be used as child labour than their peers from urban cities, with higher percentages across the board of job type and hours spent at work.
Children living in a medium-sized household and involved in non-hazardous jobs appar-ently have the highest working rates (53.6%, 50.5% and 50.7%) compared to their peers in both small and large households, irrespective of the hours spent at work.
Children from Lower and Upper Egypt are engaged in non-hazardous and household jobs and they have the highest percentage across the three periods of a job. However, for hazardous jobs, children from the Lower Egypt area seem to have the highest percentage of exposure (64.7%, 66.7%, 100%).
For the wealth indicators, children from the poorest homes are more likely to be in non-hazardous jobs, with the following percentages (68.4%, 53.8% and 44.4%) respectively
Table 3. Distributions of the missing values among the risk factors.
Risk factors Valid cases Missing values
Sex of child 35756 84520(70%)
Age of eligible children under 20years 35756 84520(70%)
Residence 120276 0
Household size 120276 0
Wealth index 120276 0
Mother’s Education 31450 88826(73.9%)
Father Education 120263 13(0.001%)
Parental Survivorship 120276 0
Phsholoical punishments 79927 40349(33.5%)
Physical punishments 79923 40390(33.6%)
Severe Physical Punishments 79886 40390(33.6%)
Table 4. Distribution of factors analysed in child labour in Egypt (DHS 2014).
Non-Hazard Wage Work (% and N)
P-value
Hazardous Wage Work (% and N)
p-value
Household Work (% and N)
p-value
Sex of child <16hours 16-less
45hours
45hours and above
0.002 <16hours 16-less
45hours
45 hours and above
0.001 <16hours 16-less
45hours
45 hours and above
0.001
Male 735(64.4) 479(69.6) 265(73.8) 169(56.3) 8(61.5) 13(43.3) 7455(51.2) 451(38.9) 69(46.6)
Female 406(35.6) 209(30.4) 94(26.2) 131(43.7) 5(38.5) 17(56.7) 7103 (48.8) 708(61.1) 79(53.4)
Age of children
5-10years 360(31.6) 154(22.4) 68(18.9) 0.001 134(44.7) 4(30.8) 12(40) 0.001 5719(39.3) 308(26.6) 51(34.5) 0.001
11–15 439(38.5) 273(39.7) 141(39.3) 114(38) 6(46.2) 10(33.3) 5514(37.9) 500(43.2) 55(37.2)
over 15 342(30) 260(37.8) 150(41.8) 52(17.3) 3(23.1) 8(26.7) 3325(22.8) 350(30.2) 42(28.4)
Residence
Urban 223(8.7) 253(16.6) 188(24.7) 0.001 53(8.2) 8(32) 8(14.5) 0.001 10930
(33.7)
666(26.3) 69(20.8) 0.001
Rural 2341
(91.3)
1270(83.4) 574(75.3) 590(91.8) 17(68) 47(85.5) 21468
(66.3)
18171 (73.7)
262(97.2)
Household size
Small household 1025(40) 716(47) 343(45) 0.001 303(47.1) 16(66.7) 28(50) 0.2 16672
(51.5)
1185 (46.7) 148(44.7) 0.001
Medium household 1374(53.6) 770(50.5) 387(50.7) 319(49.6) 8(33.3) 28(50) 14868
(45.9)
1252(49.3) 178(53.8)
Large household 165(6.4) 38(2.5) 33(4.3) 21(3.3) 0 0 857(2.6) 101(4) 5 (1.5)
Place of Residence
Urban governorates 38(1.5) 85(5.6) 76(10) 0.001 4(0.6) 0(0) 0(0) 0.001 3663(11.3) 206(8.1) 13(3.9) 0.001
Lower Egypt 1310(51.1) 694(45.6) 309(40.6) 413(64.2) 16(66.7) 55(100) 15951
(49.2)
802(31.6) 151(45.8)
Upper Egypt 114(47.3) 735(48.3) 374(49.1) 219(34.1) 8(33.3) 0(0) 12560
(38.8)
1493(58.8) 166(50.3)
Frontier Governorates
2(0.1) 9(0.6) 3(0.4) 7(1.1) 0(0) 0(0) 224(0.7) 37(1.5) 0
Wealth index 0.003
Poorest 1754
(68.4)
819(53.8) 339(44.4) 0.001 275 (42.8) 8(32) 2(3.6) 0.001 7597(23.4) 830(32.7) 76(23) 0.001
Porrer 479(18.7) 347(22.8) 196(25.7) 143(22.2) 0(0) 13(23.6) 7328(22.6) 658(25.9) 109(32.9)
Middle 196(7.6) 152(10) 89(11.7) 167(26) 9(36) 32(58.2) 6136(18.9) 364(14.3) 73(22.1)
Richer 96(3.7) 111(7.3) 75(9.8) 52(8.1) 0(0) 8(14.5) 5596(17.3) 413(16.3) 31(9.4)
Richest 38(1.5) 94(6.2) 64(8.4) 6(0.9) 8(32) 0(0) 5742(17.7) 273(10.8) 42(12.7)
Mother’s Education
No 582(52.7) 374(56.8) 201(62.4) 0.001 111(38.5) 3(23.1) 1(3.2) 0.001 4443
(31.7)
508(46.6) 39(30.2) 0.001
Primary 148(13.4) 124(18.8) 67(20.8) 58(20.1) 5(38.5) 6(19.4) 1937(13.8) 184(16.9) 20(15.5)
Secondary 361(32.7) 149(22.6) 50(15.1) 100(34.7) 5(38.5) 24(77.4) 6374(45.5) 368(33.8) 70(54.3)
Higher 14(1.3) 12(1.8) 4(1.2) 19(6.6) 0(0) 0(0) 1246(8.9) 30(2.8) 0(0)
Father Education
No 754 (29.4) 441(29) 203(28.7) 0.08 188(29.3) 4(16.7) 9(16.1) 0.03 7840(24.2) 678(26.7) 70(21.1) 0.001
primary 673(26.3) 411(27) 207(29.2) 223(34.7) 8(33.3) 16(28.6) 8741(27) 676(26.6) 90(27.2)
Secondary 1043(40.7) 602(39.6) 282(39.8) 198(30.8) 12(50) 27(48.2) 13234
(40.9)
1056(41.6) 155(46.8)
Higher 93(3.6) 68(4.5) 16(2.3) 33(5.1) 0(0) 4(7.1) 2576(8) 128(5) 16(4.8)
Parental Survivorship
compared to their peers from wealthier homes. However, for the hazardous work category, there are relatively few participants working 16–45 hrs and also relatively few working>45 hrs. The poorest children, who work at least 45 hrs in both hazardous and household jobs, have a higher percentage of working as child labour than their peers.
Children born to women without formal education in non-hazardous jobs, irrespective of the hours spent at work, are mostly working as child labour with the following percentages: 52.7%, 56.8% 62.4%, compared to children of mothers with some level of education. Children whose parents are both alive seem to be more likely to work as child labour in household job conditions than their peers without living parents.
Finally, children who have experienced psychological aggression and physical punishment are more frequently working as child labour than those without such experience, across the job types and hours spent. The same with those who have experienced severe physical punish-ment compared to their counterparts who have not had such experiences.
Associated risk factors. Table 5displays the multinomial regression results for
socio-demographic factors relating to child labour among children aged 5–17 years in Egypt with respect to the weekly length of working hours in jobs that are hazardous, non-hazardous and household-based. The table presents the estimated effects of the categorical variables: sex of child, residence’s type, household size, place of residence, wealth index, parental education, parental survivorship and violent discipline approaches.
Table 4. (Continued)
Non-Hazard Wage Work (% and N)
P-value
Hazardous Wage Work (% and N)
p-value
Household Work (% and N)
p-value
Sex of child <16hours 16-less
45hours
45hours and above
0.002 <16hours 16-less
45hours
45 hours and above
0.001 <16hours 16-less
45hours
45 hours and above
0.001
Male 735(64.4) 479(69.6) 265(73.8) 169(56.3) 8(61.5) 13(43.3) 7455(51.2) 451(38.9) 69(46.6)
Female 406(35.6) 209(30.4) 94(26.2) 131(43.7) 5(38.5) 17(56.7) 7103 (48.8) 708(61.1) 79(53.4)
Both Alive 1130(44.1) 637(41.8) 315(41.3) 0.3 327 (50.9) 15(60) 30(53.6) 0.67 14952
(46.2)
1132(44.6) 145(43.8) 0.001
Father deceased 52(2) 6(0.4) 6(0.8) 13(2) 0(0) 0(0) 116(0.4) 22(0.9) 7(2.1)
Mother deceased 14(0.5) 32(2.1) 25(3.3) 0(0) 0(0) 0(0) 626(1.9) 66(2.6) 4(1.2)
Both deceased 0(0) 0(0) 0(0) 0(0) 0(0) 0(0) 13(0) 0(0) 0(0)
don’t know/missing 1368(53.4) 849(55.7) 416(54.6) 303(47.1) 10(40) 26(46.4) 16691
(51.5) 1318(51.9) 175(52.9) Violent discipline approaches 1)Psychological aggression
Yes 1402(90.2) 578(92.3) 204(89.1) 0.002 380(77.1) 17(100) 11(52.4) 0.36 22552
(93.8)
1137(90.6) 148(98) 0.001
No 153(9.8) 48(7.7) 25(10.9) 113(22.9) 0(0) 10(47.6) 1478(6.2) 118(9.4) 3(2)
2)Physical punishment
Yes 961(61.8) 356(56.9) 133(58.1) 0.08 380(77.1) 17(100) 11(52.4) 0.002 15433
(64.2)
690(55) 60(40) 0.001
No 594(38.2) 270(43.1) 96(41.9) 113(22.9) 0(0) 10(47.6) 8597(35.8) 564(45) 90(60)
3) Severe physical punishment
Yes 927(59.6) 376(60.1) 138(60.3) 0.9 395(80.1) 8(47.1) 20(95.2) 0.001 15366(64) 677(53.9) 79(52.7) 0.001
No 628(40.4) 250(39.9) 91(39.7) 98(19.9) 9(52.9) 1(4.8) 8634(36) 578(46.1) 71(47.3)
[image:13.612.37.576.87.435.2]Table 5. Associate risk factors with child labour in Egypt (DHS 2014).
Non Hazard Wage Work Hazardous Wage Work Household Work
Sex of child <16hours 16-less 45hours <16hours 16-less 45hours <16hours 16-less 45hours
Male 1 1 1 1 1 1
Female 1.3(1.2–1.5) 1(0.9–1.2) 0.6(0.3–1.5) 1.6(1.4–2.7) 1.2(0.7–2) 1.7(0.9–3.2)
Age of eligible children under 20years
5-10years 1 1 1 1 1 1
11–15 0.5(0.4–0.8) 0.8(0.5–1.2) 0.7(0.3–2.2) 1.6(0.3–8.9) 1.6(0.7–3.7) 2.3(0.9–5.6)
over 15 0.4(0.3–0.6) 0.7(0.5–1.035) 1.36(0.3–3.2) 1.3(0.8–1.1) 0.7(0.5–0.8) 0.35(-0.6–0.8)
Residence
Urban 1 1 1 1 1 1
Rural 0.15(0.11–0.2) 0.3(0.2–0.4) 0.8(0.2–2.9) 0.3(0.05–2.03) 0.95(0.4–2.6) 1.7(0.6–5.2)
Household Size
Small household 1 1 1 1 1 1
Medium household 0.86(0.7–0.9) 1.4(1.3–1.6) 1.12(0.5–2.8) 0.8(0.18–3.4) 0.9(0.5–1.6) 0.8(0.6–1)
Large household 0.01(0–0.03) 0.08(0–0.09) 1.6(0.5–2) 1.2(0–2.2) 0.96(0.5–1.8) 1.4(0.7–2.6)
Place of Residence
Urban governorates 1 1 1 1 1 1
Lower Egypt 0.53(0.09–3) 0.18 (0.01–2) 0.7(0.1–2) 0.2 (0–1.2) 2.5(0.9–6.8) 1.2(0.4–3.5)
Upper Egypt 0.6(0.1–3.2) 0.3(0.02–3) 0.8(0.3–1.8) 0.3(0.2–3.4) 2.3(0.8–6.5) 2.5(0.8–7.4)
Frontier Governorates 0.02(0.002–0.23) 0.16(0.01–2) 0.1(0–1.3) 0.4(0.01–2.3) 3.2(0.6–16) 4.9(0.9–26)
Wealth index
Poorest 1 1 1 1 1 1
Porrer 0.6(0.5–0.7) 0.8(0.4–1.6) 1.93(0.29–12.8) 0.2(0.1–2) 1.2(0.53–2.8) 0.9(0.4–2)
Middle 0.16(0.13–0.2) 0.3(0.13–0.9) 2.3(0.4–10.07) 0.3(0.8–1.2) 1.4(0.6–3.4) 0.8(0.3–2.1)
Richer 0.02(0.014.0.03) 0.24(0.09–0.6) 0.58(0.5–1.3) 0.15(0–1.3) 4(1.2–15) 3.4(0.8–13
Richest 0.014(0.09–0.02) 1(0.26–3.8) 1.46(1.2–6.2) 0.7(0.2–1.8) 2.6(0.7–9.5) 2(0.5–8)
Mother’s Education
No education or complete primary 1 1 1 1 1 1
Complete secondar or Higher 4.5(2.3–8.5) 2.2(1.2–4.5) 0.4(0.1–1.2) 0.01(0–0.9) 0.8(0.4–1.5) 0.7(0.4–1.6)
Father Education
No education or complete primary 1 1 1 1 1 1
Complete secondar or Higher 1.87 (1–3.4) 1.6(0.8–3) 0.4(0.1–1.5) 0.02(0–1.1) 0.8(0.3–1.9) 0.8(0.3–5.6)
Parental Survivorship
Both Alive 1 1 1 1 1 1
Father deceased 1.02(0.3–3.5) 0.54(0.5–2.3) 0 0 1.5(0.6–4.2) 2.1(0.8–5.8)
Mother deceased 0.5(0.2–1.2) 0.4(0.13–1.2) 1.64(0.2–22) 1.02(0–1.4) 0.2(0.08–0.5) 0.6(0.3–1.5)
Violent discipline approaches 1)Psychological aggression
Yes 1.53(0.7–3.3) 3.7(1.5–9.5) 0.012(0–0.4) 0.01(0–0.2) 1.3(0.6–3.3) 1.08(0.4–2.8)
No 1 1 1 1 1 1
2)Physical punishment
Yes 0.8(0.4–1.3) 0.6(0.3–1.06) 6.4(1.9–21) 1.43(0–1.5) 9.3(4.2–20.8) 7.9(3.4–17)
No 1 1 1 1 1 1
3) Severe physical punishment
Yes 0.8(0.4–1.3) 1.02(0.5–1.9) 0.4(0.1–1.3) 0.001(0–0.02) 0.9(0.5–1.7) 0.5(0.3–1)
No 1 1 1 1 1 1
Columns 1 & 2 present the odds of children working ‘less than 16 hours’ weekly as against those working ‘between 16 and 45 hours’ weekly, under non-hazardous working conditions. For example, the results show that female children (with male children as reference category) working less than 16 hrs (OR: 1.3; with 95% CI: 1.2–1.5) are less likely to be working as child labour than those working 16 to 45 hrs (OR: 1.6; 95% CI: 1.4–2.7). Also, for those in household jobs, female children working between 16 and 45 hrs (with OR: 1.7; 95% CI: 0.9–3.2) are more likely to be working as child labour than those working at less than 16 hrs weekly (OR: 1.2; 95% CI: 0.7–2). Finally, under the hazardous working condition, female children working 16– 45 hrs (OR: 1.6 and 95% CI of 1.4–2.7) are more at risk than those working less than 16 hrs weekly (OR: 0.6; 95% CI: 0.3–1.5).
Similarly, children aged 11–15 (OR: 0.5 and 95% CI: 0.4–0.8) are more likely to be at risk than those aged over 15 years (OR: 0.4; 95% CI: 0.3–0.6) under the non-hazardous working condition for less than 16 hrs and for 16–45 hrs, although, the OR does not seem significant in either age group. For children in a household job, 11–15 year-olds are more likely to be at risk of being used as child labour (OR: 2.3 and 95% CI: 0.9–5.6) compared to those who are over 15 and are in 16–45 hrs weekly job category. For hazardous jobs, children aged over 15 years who are working less than 16 hrs (OR: 1.36; 95% CI: 0.3–3.2) are more at risk of working as child labour compared to their counterparts who are under the age of 15.
Rural children under 16–45 hrs are more likely to be at risk of being used as child labour than the children working less than 16 hrs a week in non-hazardous jobs. Urban children in non-hazardous and hazardous jobs are more likely to be at risk of being used as child labour compared to rural children, regardless of the number of hours. Rural children under house-hold jobs are more likely to be affected by child labour compared to urban children.
Children living in medium-sized households who are working 16–45 hrs weekly (with OR: 1.4; 95% CI: 1.3–1.6) have an increased likelihood of being used as child labour in non-hazard-ous jobs than in hazardnon-hazard-ous and hnon-hazard-ousehold jobs. However, children in large hnon-hazard-ouseholds, and working less than 16 hrs a week under hazardous conditions (OR: 1.6; 95% CI: 0.5–2) are likely to have a higher risk compared to others in the two other working environments.
The poorer children working under the hazardous condition for less than 16 hrs weekly (OR: 1.93; 95%CI: 0.29–12.8) are likely to be most at risk compared to their colleagues subjected to the two other working conditions. The same experience goes for middle-class children (OR: 2.3; 95%CI: 0.4–10.07). However, for the children from the richer and the richest families, those in household jobs and working less than 16 hrs weekly, or 16–45 hrs are more likely to be at risk of child labour than other children who are in the other two working conditions.
Half-orphans whose fathers are dead tend to be more often working as child labour in non-hazardous and household-based jobs than those whose mothers are deceased, irrespective of the hours of labour. However, for hazardous jobs, children with deceased mothers are more likely to be at risk than those with deceased fathers.
Children who are exposed to psychological aggression and are working 16–45 hrs weekly (OR: 3.7; 95%CI: 1.5–9.5) in a non-hazardous job are more likely to be at risk of being used as child labour than their counterparts subjected to the two other working conditions. The same with children subjected to severe physical punishment. However, the risk likelihood is highest for children in household jobs who are subjected to physical punishments, especially those working less than 16 hrs weekly (OR: 9.3; 95%CI: 4.2–20.8).
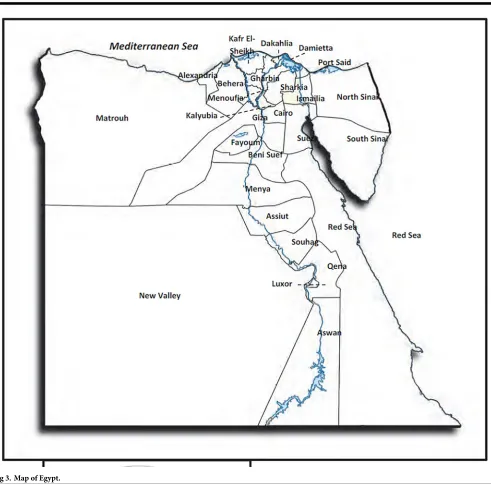
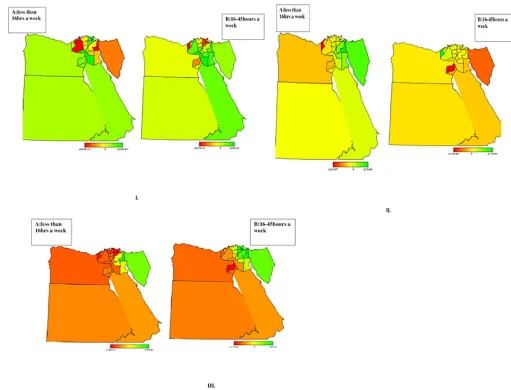
Spatial effects. Fig 3shows the map of Egypt (EDHS 2014).Fig 4shows the structured
rural Upper Egypt have the highest risk of working in all three employment types. Hazardous work is likely in Delta, Canal, Ismailia and other neighbouring cities; whilst lower and upper Egypt are more affected by household work. Similarly, the likelihood of being required to do non-hazardous work is higher in lower and upper Egypt.
Discussion
[image:16.612.79.570.96.581.2]This study emphasises the significance of seeking child protection against engaging in any job or task that could be hazardous, interfere with education or damage the health or physical,
Fig 3. Map of Egypt.
mental, spiritual, moral or social development of a child, in line with the UN convention. We reviewed how poverty, declining economic conditions and rising inflation continue to worsen the situation across various parts in Egypt.
We cross-classified the economic activities of the children aged 5–17, who are never-married and are of school age, based on the number of hours worked per week, subject to ILO classifica-tions against the socio-demographic and spatial factors to determine the level of association between these factors and the nature of jobs these children are working in. We went further to determine which of the socio-economic and spatial factors and the associated risk factors are likely to expose these children to the risks inherent in the various kinds of work they are engaged in.
From the results, we found that gender, age, household size, place of residence, region, vio-lent discipline method, parental education and survivorships and wealth status are all predis-posing factors for child labour in different working conditions.
[image:17.612.64.575.71.461.2]We found that the percentage of male children who were in non-hazardous jobs worked longer hours than female children. However, more than 61% of female children engaged in
Fig 4. Maps of Egypt showing the spatial effects (posterior OR) on child labour: Fig 4I. (A) less than 16 hrs a week Vs. (B) 16–45 hrs a week engagement in
Household work, Fig 4II. (A) less than 16 hrs a week vs. (B) 16–45 hrs a week engagement in wage work, Fig 4III. (A) less than 16 hrs a week Vs. (B)16-45 hrs a week engagement in Hazard work. The red area indicates a negligible effect for this child labour within these areas, while the green area reflects a strong effect of a child involved in different types of work in these regions and the yellow area indicates that there are almost no cases found in these regions.
household jobs working between 16 and 45 hrs a week compared to their male counterparts (39%). Likewise, female children spend more hours weekly (over 45 hrs) in household jobs compared to male children. Another study that used the National Child Labour Survey (2010) found that about 30% of employed children are working in hazardous industries (7.7%), such as mining and construction, or hazardous occupations (1.7%), or for long hours (20%) [7].
The percentage of children living in a medium-sized household and working over 16 hrs a week is higher compared to those both in the small and large households. Children living in Upper and Lower Egypt, those from the poorest homes, those born to women without formal education and those who have experienced both psychological and physical punishments have a higher percentage in all categories.
We found that children aged 11–15 are more at risk of being used as child labour than those aged over 15 years. Children between 11–15 are more at risk because they are more vulnerable, especially when they are not living with their parents, as is the case with most of these children in this dataset. Therefore, they are most likely to be sent to work to support themselves and their rela-tives, compared to their counterparts who are over 15, who are more mature and therefore less vulnerable to being used as child labour without their consent. However, children in the age group of 11–15 are more engaged in housework and non-hazardous work, compared to their counterparts who are over 15. The same goes for rural children, who have higher chances of work-ing than their urban colleagues. This is consistent with previous studies which used DHS data and found that children in rural areas are much more likely to work and less likely to be in school [40]. Children from poorer homes, those whose fathers are dead and those subjected to psycho-logical aggression and physical punishment are more likely to be sent into child labour. A previous study has found that the effect of household wealth on child labour is statistically significant, but the significant effects are almost always negative, as expected [40]. The main finding was how household wealth influences the decision between work and school for children.
The majority of children under the age of 17 and adults in rural areas of Upper-Egypt are living in great poverty. At least three-quarters of the 9.2 million children are living in great poverty in rural areas. However, recent years have seen a movement in poverty in urban cities, which replicates the ‘impact of the prolonged economic stagnation that started in 2011’ [7]. Regional inequalities continue to be part of the country’s landscape, with Upper Rural Egypt showing poverty rates three times as high as metropolitan Egypt [5]. The spatial effect suggests the need to contribute more to some areas that have high proportions of child labour, such as the Nile Delta, Upper Egypt, and North-eastern Egypt. The higher proportion of child labour in these areas compared with other areas is triggered by the high-density population and high rates of poverty [16].
From our findings, one could argue that there is considerable evidence of child labour in Egypt and that socio-demographic and spatial factors greatly predispose the majority of the children to engage in it.
Conclusion
We have presented Bayesian geospatial modelling with multiple imputation models for child labour and violence against child issues in Egypt. These types of epidemiological studies are relatively rare. Most of the previous studies were limited to exploratory analysis of child health only [9,16,41].
We have established evidence of the presence of child labour and the impacts of socio-demographics and their associated risk factors for child labour across Egypt.
significant influence of socio-demographic and economic factors on child labour and violence against children in Egypt. Significant is that poverty, neglect, lack of adequate care and expo-sure of children to various grades of violence are major drivers of child labour across the coun-try. North-eastern Egypt has a higher likelihood of child labour than most other regions, while children who live in the Delta are more engaged in hazardous work. The government is there-fore encouraged to work towards protecting the rights of children as enshrined in the United Nations conventions and to educate and empower children from less-privileged families.
Strength and limitations of this study
As far as we know, this is the first time a study of this kind has been undertaken in Egypt on geospatial factors affecting child labour and the first which implements advanced modelling whilst imputing the missing values that usually affect the data of the child labour in developing countries. Using geospatial mapping and statistical imputation to handle large quantities of missing data is an important contribution to the field.
The study is conducted in line with the 2014 EDHS, which promotes the assessment of sev-eral key aspects of the welfare of Egypt’s children. However, the level of missing observations in the data is a major challenge in this study. Only a few studies have discussed child labour in Egypt due to the lack of the accurate data and statistics, and most of these did not use DHS data, neglected the spatial effects, and did not use the advanced statistical methods that we have used in this study. This is why it was difficult to compare our results with the previous studies. As the number of observations increases (20,560 observations were used), the power of the chi-square test increases. Obviously, as we have more data, we can be more certain about our effect size not being attributable to noise. Increasing the sample size tends to result in a smaller P-value only if the null hypothesis is false, which is not the case. For hazardous work, there are fewer observations, and that could also affect the analysis of this outcome vari-able. According to the EDHS, it was difficult to collect more data about such sensitive eco-nomic activities.
Supporting information
S1 Data. EDHS data 2014 on child labour.
(SAV)
Author Contributions
Conceptualization: Khaled Khatab.
Formal analysis: Khaled Khatab.
Investigation: Khaled Khatab.
Methodology: Khaled Khatab.
Project administration: Khaled Khatab.
Software: Khaled Khatab.
Supervision: Khaled Khatab.
Validation: Khaled Khatab.
Visualization: Khaled Khatab.
Writing – review & editing: Khaled Khatab, Maruf A. Raheem, Benn Sartorius, Mubarak
Ismail.
References
1. Ross-Larson CMaB. Human Development Report. United Nations Development Programme. 2004;0-19-522146-X.
2. Khatab K. The Arab Spring: Where is Egypt Now? Royal Statistical Society & American Association Society Significance. 2012; 9(1):32–4.
3. CAPMAS. Egypt’s population to reach 87 million by Tuesday: CAMPAS. The Cairo Post. Retrieved from http://www.thecairopost.com/news/122276/news/egypts-population-to-reach-87-million-by-tuesday-capmas. 2014.
4. Egypt CBo. Annual Report 2011/2012. Central Bank of Egypt 2012.
5. Bank W. World Development idicators data catalogue world bank organisation 2015.
6. McGoldrick D. The United Nations convention on the rights of the child. International Journal of Law, Policy and the Family. 1991; 5(2):132–69.
7. ILO and Central Agency for Public Mobilization and Statistics (CAPMAS). Working Children in Egypt: Results of the 2010 National Child Labour Survey. International Labour Organization; ILO International Programme on the Elimination of Child Labour; Central, International Labour Organization and the Egyptian Central Agency for Public Mobilization and Statistics (CAPMAS) 2012Agency for Public Mobi-lisation and Statistics (CAPMAS). 2012.
8. Ministry of Health and Population Cairo EE-ZaAC, Egypt The DHS Program, ICF International Rock-ville, Maryland, USA. Demographic and Health Survey for Egypt. USAID & UNICEF. 2014.
9. Khatab K, Adegboye O, Mohammed TI. Social and Demographic Factors Associated with Morbidities in Young Children in Egypt: A Bayesian Geo-Additive Semi-Parametric Multinomial Model. PLoS One. 2016; 11(7):e0159173. Epub 2016/07/22.https://doi.org/10.1371/journal.pone.0159173PMID: 27442018; PubMed Central PMCID: PMCPMC4956117.
10. report AjI-U-TWB. UNDERSTANDING TRENDS IN CHILD LABOUR UNICEF. 2017.
11. Statistics CAfPMa. The most important results of Income,Expenditure and Consumption Survey 2012/ 2013. Cairo, Egypt CAPMAS. 2013.
12. Benova L, Campbell OM, Sholkamy H, Ploubidis GB. Socio-economic factors associated with maternal health-seeking behaviours among women from poor households in rural Egypt. International journal for equity in health. 2014; 13(1):111.
13. Khatab K. Bayesian Geoadditive Mixed Latent Variable Models with Applications to Child Health Prob-lems in Egypt and Nigeria-,’Advanced Techniques for Modelling Maternal and Child Health in Africa’. 2013.
14. UNICEF G. Multiple indicator cluster survey (MICS). 2015.https://doi.org/10.12669/pjms.316.8181
15. Kneib T, Baumgartner B, Steiner WJ. Semiparametric multinomial logit models for analysing consumer choice behaviour. AStA Advances in Statistical Analysis. 2007; 91(3):225–44.
16. Khatab K, Fahrmeir L. Analysis of childhood morbidity with geoadditive probit and latent variable model: a case study for Egypt. Am J Trop Med Hyg. 2009; 81(1):116–28. Epub 2009/06/27. 81/1/116 [pii]. PMID:19556576.
17. Khatab K. Childhood malnutrition in Egypt using geoadditive Gaussian and latent variable models. Am J Trop Med Hyg. 2010; 82(4):653–63. Epub 2010/03/30. 82/4/653 [pii]https://doi.org/10.4269/ajtmh. 2010.09-0501PMID:20348515.
18. Khatab K, Kandala N-B. Latent variable modelling of risk factors associated with childhood diseases: Case study for Nigeria. Asian Pacific Journal of Tropical Disease. 2011; 1(3):169–76.
19. Fahrmeir L aLS. Bayesian Inference for Generalised Additive Mixed Models Based on Markov Random Field Priors. Applied Statistics 2001; 50:201–20.
20. Brezger A KT, Lang S. BayesX—Software for Bayesian Inference based on Markov Chain Monte Carlo simulation Techniques. Available at:http://wwwstatuni-uenchende/lang/BayesX. 2005; 1.4.
21. Fahrmeir L, Lang S. Bayesian inference for generalised additive mixed models based on Markov ran-dom field priors. Journal of the Royal Statistical Society: Series C (Applied Statistics). 2001; 50(2):201– 20.
23. Gilks WR, Richardson S, Spiegelhalter D. Markov chain Monte Carlo in practice: Chapman and Hall/ CRC; 1995.
24. Binder DA, Sun W, editors. Frequency valid multiple imputation for surveys with a complex design. Pro-ceedings of the Section on Survey Research Methods; 1996: ASA.
25. Schafer JL, Olsen MK. Multiple imputation for multivariate missing-data problems: A data analyst’s per-spective. Multivariate behavioral research. 1998; 33(4):545–71.https://doi.org/10.1207/
s15327906mbr3304_5PMID:26753828
26. Van Buuren S, Boshuizen HC, Knook DL. Multiple imputation of missing blood pressure covariates in survival analysis. Statistics in medicine. 1999; 18(6):681–94. PMID:10204197
27. Cattle BA, Baxter PD, Greenwood DC, Gale CP, West RM. Multiple imputation for completion of a national clinical audit dataset. Statistics in medicine. 2011; 30(22):2736–53.https://doi.org/10.1002/ sim.4314PMID:21786284
28. Lin TH. A comparison of multiple imputation with EM algorithm and MCMC method for quality of life missing data. Quality & quantity. 2010; 44(2):277–87.
29. White IR, Royston P, Wood AM. Multiple imputation using chained equations: issues and guidance for practice. Statistics in medicine. 2011; 30(4):377–99.https://doi.org/10.1002/sim.4067PMID:21225900
30. Van Buure S BH, Knook DL. Multiple imputations of missing blood pressure covariates in survival analy-sis. Stat Med. 1999; 18:681–94. PMID:10204197
31. Graham JW, Cumsille PE, Shevock AE. Methods for handling missing data. Handbook of Psychology, Second Edition. 2012; 2.
32. Graham JW, Schafer JL. On the performance of multiple imputation for multivariate data with small sample size. Statistical strategies for small sample research. 1999; 50:1–27.
33. Schafer JL, Graham JW. Missing data: our view of the state of the art. Psychological methods. 2002; 7 (2):147. PMID:12090408
34. McLachlan G, Thriyambakam K. The EM algorithm and extensions New York Wiley. 1997.
35. Rubin DB. Nested multiple imputation of NMES via partially incompatible MCMC. Statistica Neerlan-dica. 2003; 57(1):3–18.
36. Yuan YC, editor Multiple imputation for missing data: Concepts and new development. Proceedings of the Twenty-Fifth Annual SAS Users Group International Conference; 2000.
37. Zhang P. Multiple imputation: theory and method. International Statistical Review. 2003; 71(3):581–92.
38. Statistics UIf. Summary Report of the 2015 UIS Innovation Data Collection. Montreal: UNESCO Insti-tute for Statistics. http://uisunescoorg/sites/default/files/documents/ip37-summary-report-of-the-2015-uis-innovation-data-collection-2017-enpdf. 2017.
39. Bureau of labour Statistics. Child labourhttps://wwwblsgov/opub/mlr/2016/. 2016.
40. Huebler F, editor Child labour and school attendance: Evidence from MICS and DHS surveys. Seminar on Child Labour, Education and Youth Employment, Understanding Children’s Work Project, Madrid; 2008.