doi:10.4236/jep.2011.22020 Published Online April 2011 (http://www.SciRP.org/journal/jep)
Removal of Nitrogen Dioxide and Sulfur Dioxide
from Air Streams by Absorption in Urea Solution
Mahmood M. Barbooti1*, Neran K. Ibraheem2, Awni H. Ankosh2
1School of Applied Sciences, Baghdad, Iraq; 2Department of Chemical Engineering, University of Technology, Baghdad, Iraq.
Email: [email protected], [email protected], [email protected]
Received November 25th, 2010; revised January 13th, 2011; accepted March 16th, 2011.
ABSTRACT
The study focuses on the absorption rates of NO2, SO2 and a mixture of these two acid gases into urea solution in
packed bed column. The absorption rate was studied as a function of absorbent temperature, urea concentration and acid gas concentration. The influence of liquid temperature between 10 - 40˚C, urea concentration between 0.1 - 0.5 M and acid gas concentration NO2between 100 - 1000 ppm (191 - 1910 mg/m3), SO2 between 500 - 2500 ppm (1310 - 6530 mg/m3) were investigated. The mass gas flow rate of 20.646(kg/m2.min) at 25˚C and the absorption rate were
determined by measuring the NO2 andSO2 concentrations in the inlet and outlet streams of the absorptioncolumn. The
absorption rate of SO2 increases with the decrease of temperature of absorbent (urea solution) and with the increase of
the urea concentration. The presence of NO2 in the effluent gas stream lowers the absorption rate of SO2 in urea
solu-tion due to the fast reacsolu-tion of NO2 with urea as compared with SO2. The absorption rate of NO2 decreases as the urea
concentration exceeds 0.4 mol/l and for NO2 gas concentration of 100 ppm due to the decrease the diffusivity of the gas.
The experimental data were analyzed using dimensionless analysis to find the correlation of mass transfer coefficient in the packed column Sh (H/dp)1.2=4.19*10–2*(G' dp/μ
g)0.87 (μg/ρg DAB)0.60The results confirmed the hypothesis that the
absorption is accompanied with chemical reaction. Also it is found the increasing the temperature of absorbent solution the absorption rate of two gases is decreases. The mass transfer coefficient models are in good agreements with the Kramer’s equation.
Keywords: Sulfur Dioxide Removal, Nitrogen Dioxide Removal, Column Absorption, Removal of Acid Gases, Air
Pollution Prevention
1. Introduction
The harmful effects of the sulfur dioxide, SOx and nitrto-gen dioxide,NOx, gases emissions in dense industrial and urban areas receive increasing attention especially where their production exceeds neutralization and dispersion forces [1]. Of the major contributors nitric acid plants contribute the most NO2 to the environment [2]. The re-lease of SOx can be controlled by ammonia injection which relies solely on gas phase reaction in the presence of moisture to produce ammonium sulfate solid particles that can be captured by any other particulate collection device [3]. Heterogeneous reduction process of SOx by hydrogen sulfide into sulfur can be done in the presence of suitable solid phase catalysts. Methane can be used for the reduction of SOx into hydrogen sulfide on alumina as the catalyst. The hydrogen sulfide produced by this method is captured by amine scrubbing of the reduced gas stream. The higher concentration of sulfide obtained
by heating the amine salt may then be easily and eco-nomically converted to elemental sulfur via the Claus process [4].
capture SO2. Uncomplexed citric acid can be regenerated thermally to obtain stripped citrate solution and stream of up to 90% SO2 at this stage [8].
The SO2gas may be entrapped in molten alkali car- bonate at about 425˚C [9]. Limestone or lime slurry in water is used in a suitably designed scrubber in an effec- tive and relatively low cost SO2removal method. The affinity of the activated carbon for the acid gases is, in increasing order, CO2 < SO2 < NO2, [10]. The use of powdered limestone injection is applied to remove SO2 from flue gases from coal burning. The SO2 reacts with solidlimeto form solid particles of calcium sulfite and calcium sulfate which are captured in electrostatic pre- cipitators [11].
Three methods are used to control and reduce NOx emission, namely: absorption, selective catalytic reduc- tion and non-sélective catalytic reduction [12]. For methane reduction, the polluted gas stream is preheated to about 400˚C and then blended with the appropriate proportion of methane before passage over platinum or palladium catalytic surface for reduction [13]. Selective catalytic abatement uses a catalyst and ammonia fuel to reduce NOx in preference to combustion with the much higher levels of oxygen in the gas at temperatures in the range 210 - 410˚C. Slight excess of ammonia may be used to leave 5 - 20 (ppmv) in the treated gas stream. Zhang et al., 2008 [14], studied the NOx removal from
simulated flue gas by chemical absorption-biological reduction integrated approach in a biofilter. They con-cluded that maximum elimination capacity (18.78 g·NO m−3 h−1) was achieved at a loading rate of 28.68 g·NO m−3 h−1 and maintained 5 h operation at the steady state.
The aim of the present work is at studying the effects of the operation parameters on the absorption of SO2 and NO2 from air streams using dilute urea solution. The op- erating variables studied are: concentration of the two gases in air, concentration of absorbent (urea) solution and temperature of absorbent solution
2. Materials and Methods
[image:2.595.319.528.412.701.2]2.1. Experimental Set up
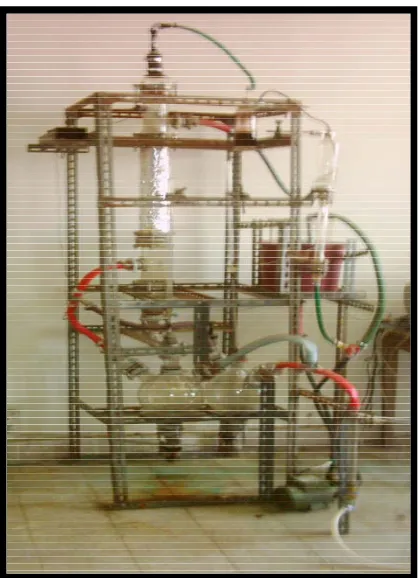
Figure 1 shows a photograph of the bench scale system
designed for the absorption of gases. The rig consisted of three sections: generation, absorption and analysis sec- tions.
For the generation of the gases a three neck QVF 5 L-flask is connected at its upper part to a glass burette (100 ml) capacity which contains sulfuric acid or nitric acid. The inlet of the generation section was connected to a compressed air source.
The absorption section was a packed column of 7.5 cm inside diameter and 50 cm height, which is packed with glass Rashig rings (6 mm inside diameter). The height of
packing is (45 cm). Counter current flow of the gas mix- ture was maintained at a mass flux of gases (G' = 20.64 kg/m2·min), and the mass flux of absorbent liquid down- ward = 188 kg/m2·min. The used values for the gas flow rate and liquid flow rate was checked with loading, flooding and pressure drop calculation in the column. Calculations are given in appendix C. The pump is used to rises the absorbent solution from the 15 liter capacity (QVF) vessel supported at the middle of column. The rig was insulated with glass wool to maintain the absorbent temperature nearly constant.
Calibrated rotameters were used to measure the air and solvent flow rates.
2.2. Chemicals
For the generation and detection of SO2, Sodium sulfite, Na2SO3 was supplied from Merck, Germany. Sulfuric acid, H2SO4, iodine, I2, Iodine ampoule, 0.1 N, potassium iodide, KI, starch and Sodium thiosulfate ampoule, 0.1 N were analytical grade reagents from BDH, England. Urea was an industrial grade product from a local fertilizer factory.
For the generation and detection of NO2, nitric acid, sodium hydroxide, phenolphthalein and copper were supplied from BDH, England; Hydrogen peroxide, H2O2 was a local product.
2.3. Procedures
SO2 Generation was carried out by the reaction of so-dium sulfite solution with sulfuric acid using various acid concentrations (5 - 23 wt%). An air stream at constant mass flux of (20.64 kg/m2·min) was then passed through the reaction vessel to transport the generated SO2 gas towards the packed bed absorber. Urea solution was al-lowed to move downward from the top of the column at constant mass flux (188 kg/m2·min).
NO2 was generated by the reaction of copper with ni-tric acid of various concentrations (5 - 35 wt%). An air stream at constant mass flux of (20.64 kg/m2·min) was then passed through the reaction vessel to transport the generated NO2 gas towards the packed bed absorber. Urea solution was allowed to move downward from the top of the column at constant mass flux (188 kg/m2·min).
Generation of SO2 and NO2 mixture:
Two reaction vessels were used simultaneously to generate the two gases as in the procedure above and the gases were directed at the same time by the same air stream towards the absorption column. The outlet of the column was connected to two different traps containing the detection reagents of residual gases sequentially, where the first absorber trap contains iodine solution for SO2 and the second contains hydrogen peroxide for NO2.
2.4. Measurements of Absorption Rate
The weight of SO2 Absorbed was determined by measur- ing the residual amount by its quantitative reaction with iodine and titrating excess iodine with sodium thiosulfate. The number of iodine equivalents is equal to the residual SO2in the trap.
The weight of NO2 absorbed by the quantitative
reaction with hydrogen peroxide to form nitric acid
which can be determined by titration with 0.01 N NaOH solution using phenolphthalein as an indicator [15].
2.5. Experimental Design
Variables acting together may have greater or smaller effect than individual variables acting alone. A response surface can be most efficient fitted if proper attention is given to the choice of experimental design [16]. Box- Wilson, composite rotatable design is common type of statistical experiments, especially applicable to optimiza- tion analysis.
Theeffect of three variables for each acid gas such as, liquid temperature, liquid concentration and concentra- tion of SO2 and NO2 on the absorption rates were inves- tigated and analyzed. The number of experiments needed according to design are 15 plus 5 experiments at the cen- ter point to estimate the experimental error.
For SO2 gas, the ranges of the operating variables are:
1) SO2 concentration, 500 - 2500 ppm (1310 - 6550 mg/m3) = X
1
2) Urea concentration, 0.1 - 0.5 mol/L = X2 3) Liquid temperature, 10 to 40˚C = X3
According to Equation (1) the relationships between the coded levels and the corresponding real variables as follows 2 1 1500 577 35 coded conc.SO X .
(10)
2
0 3 0 1154
coded
Urea.conc mol l . X
.
(11)
3 C 25 8 66 coded Tempofsolution X . (12)For NO2 gas,the ranges of the operating variables are: 1) NO2 concentration, 100 - 1000 ppm (191 - 1910 mg/m3) = X
1
2) Urea concentration, 0.1 - 0.5 mol/L = X2 3) Liquid temperature, 10 to 40˚C = X3
According to Equation (1) the relationships between the coded levels and the corresponding real variables are as follows 2 1 550 260 Coded Conc.NO
X (13)
2 0 3 0 1154 coded Conc.urea . X .
(14)
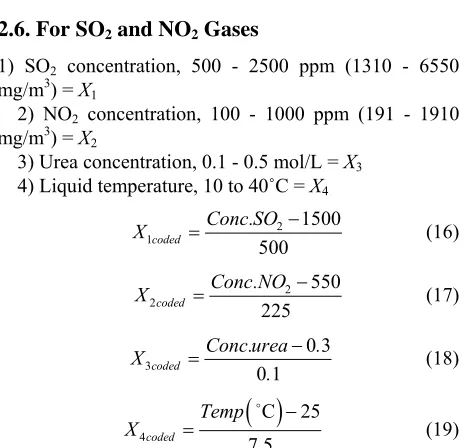
3 C 25 8 66 Coded Temp X . (15)2.6. For SO2 and NO2 Gases
1) SO2 concentration, 500 - 2500 ppm (1310 - 6550 mg/m3) = X
1
2) NO2 concentration, 100 - 1000 ppm (191 - 1910 mg/m3) = X
2
3) Urea concentration, 0.1 - 0.5 mol/L = X3 4) Liquid temperature, 10 to 40˚C = X4
2 1 1500 500 coded Conc.SO
X (16)
2 2 550 225 coded Conc.NO
X (17)
3 0 3 0 1 coded Conc.urea . X .
(18)
4 C 25 7 5 coded Temp X . (19) [image:3.595.309.543.454.678.2]The values of the coded and real variables for the ab-sorption experiments of SO2/NO2 mixtures are given in
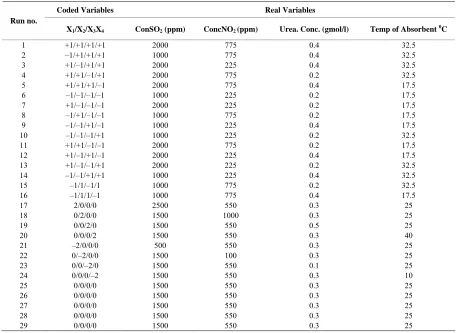
Table 1. Coded and real variables for SO2 and NO2 absorption experiments.
Coded Variables Real Variables
Run no.
X1/X2/X3X4 ConSO2 (ppm) ConcNO2 (ppm) Urea. Conc. (gmol/l) Temp of Absorbent 0C
1 +1/+1/+1/+1 2000 775 0.4 32.5
2 –1/+1/+1/+1 1000 775 0.4 32.5
3 +1/–1/+1/+1 2000 225 0.4 32.5
4 +1/+1/–1/+1 2000 775 0.2 32.5
5 +1/+1/+1/–1 2000 775 0.4 17.5
6 –1/–1/–1/–1 1000 225 0.2 17.5
7 +1/–1/–1/–1 2000 225 0.2 17.5
8 –1/+1/–1/–1 1000 775 0.2 17.5
9 –1/–1/+1/–1 1000 225 0.4 17.5
10 –1/–1/–1/+1 1000 225 0.2 32.5
11 +1/+1/–1/–1 2000 775 0.2 17.5
12 +1/–1/+1/–1 2000 225 0.4 17.5
13 +1/–1/–1/+1 2000 225 0.2 32.5
14 –1/–1/+1/+1 1000 225 0.4 32.5
15 –1/1/–1/1 1000 775 0.2 32.5
16 –1/1/1/–1 1000 775 0.4 17.5
17 2/0/0/0 2500 550 0.3 25
18 0/2/0/0 1500 1000 0.3 25
19 0/0/2/0 1500 550 0.5 25
20 0/0/0/2 1500 550 0.3 40
21 –2/0/0/0 500 550 0.3 25
22 0/–2/0/0 1500 100 0.3 25
23 0/0/–2/0 1500 550 0.1 25
24 0/0/0/–2 1500 550 0.3 10
25 0/0/0/0 1500 550 0.3 25
26 0/0/0/0 1500 550 0.3 25
27 0/0/0/0 1500 550 0.3 25
28 0/0/0/0 1500 550 0.3 25
29 0/0/0/0 1500 550 0.3 25
3. Results and Discussion
The measurement concerned the study of the effect of the operation variables such as SO2 and NO2 level, urea concentration and operating temperature on the absorp- tion rate of acid gas and consequently their removal.
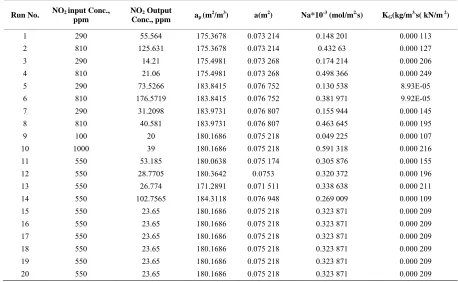
The absorption rate of an acid gas (NO2 or SO2) is ex- pressed as the equivalent moles of NO2 or SO2 that react with urea solution per unit interface area per unit time. This absorption rates were calculated in accordance with the expressions of Weisweiler and Dieb [17]. The ab- sorption rates values for SO2 and NO2 are listed in the
Tables 2 and 3, respectively. The mass transfer coeffi-
cient for the packed bed column was estimated by using the design equation for dilute gas mixture [18].
3.1. Effect of Operating Variables
3.1.1. Effect of Acid Gas Concentration
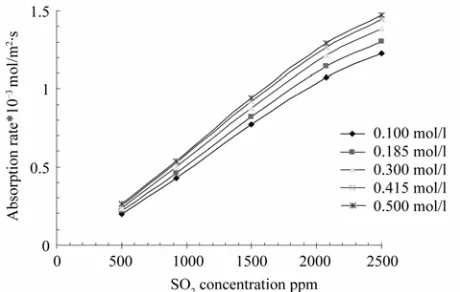
Figure 2 shows the effect of SO2 concentrations on the absorption rate for various urea concentrations (0.1 - 0.5 mol/L at fixed absorbent solution temperature of 25˚C. For NO2 the results are shown in Figure 3. The results indicate that the absorption rate increases as the SO2
concentration increases. This can be attributed to the greater driving force available as the SO2 concentration increased and consequently higher absorption rate are more easily attained. These results agree with published report of Basu et al. [19], where the rate of absorption increased directly with the driving force during the SO2 absorption in caustic soda and dimethylaniline solution.
The results of NO2 indicated that the absorption rate increases sharply as the concentration of the gasincreases. This behavior may be expected because the reaction be- tween NO2 and urea solutions in the liquid phase is very fast. These results confirm the findings of Lefer et al. [20].
Table 2. Experimental results of SO2 absorptionand values of interfacial area of packing.
Run No. SO2 input Conc.,
ppm
SO2 Output
Conc., ppm ap (m2/m3) a(m2) Na *10-3 (mol/m2.s) KG (kg/m3s (kN/m2)
1 922.6 156.842 175.3678 0.073 214 0.476 972 0.000 168 352 2 2077.6 276.3208 175.3678 0.073 214 1.121 972 0.000 191 671 3 922.6 52.957 24 175.4981 0.073 268 0.541 277 0.000 271 306 4 2077.6 49.654 64 175.4981 0.073 268 1.262 219 0.000 354 488 5 922.6 204.7618 183.8415 0.076 752 0.426 515 0.000 136 429 6 2077.6 386.2051 183.8415 0.076 752 1.004 968 0.000 152 494 7 922.6 107.0216 183.9731 0.076 807 0.484 242 0.000 195 092 8 2077.6 120.5008 183.9731 0.076 807 1.162 009 0.000 257 866 9 500 130 180.1686 0.075 218 0.224 323 0.000 124 574 10 2500 162.5 180.1686 0.075 218 1.417 175 0.000 252 774 11 1500 170.835 180.0638 0.075 174 0.806 313 0.000 201 026 12 1500 58.695 180.3642 0.075 3 0.872 884 0.000 299 381 13 1500 17.952 171.2891 0.071 511 0.945 113 0.000 430 476 14 1500 280.245 184.3118 0.076 948 0.722 887 0.000 151 648 15 1500 111 180.1686 0.075 218 0.842 12 0.000 240 782 16 1500 111 180.1686 0.075 218 0.842 12 0.000 240 782 17 1500 111 180.1686 0.075 218 0.842 12 0.000 240 782 18 1500 111 180.1686 0.075 218 0.842 12 0.000 240 782 19 1500 111 180.1686 0.075 218 0.842 12 0.000 240 782 20 1500 111 180.1686 0.075 218 0.842 12 0.000 240 782
Table 3. Experimental results of NO2 absorptionand values of interfacial area of packing.
Run No. NO2 input Conc.,
ppm
NO2 Output
Conc., ppm ap (m2/m3) a(m2) Na*10-3 (mol/m2.s) KG(kg/m3.s( kN/m2)
[image:5.595.67.525.440.722.2]3.1.2. Effect of Urea Concentration
Figure 5 shows the effect of urea concentration on the
absorption rate of SO2 at various concentrations in the range (500 - 2500 ppm) and fixed absorbent temperature (25˚C). It is clear that as the urea concentration increased, the absorption rate increases regularly. Also, a similar effect is obtained at various working temperature (10 - 40˚C) and fixed SO2 concentration (1500 ppm). When the urea concentration increased, the absorption rate in-creases, this agrees with the findings in the cases of using dimethylaniline as an absorbent as reported by Basu et al.
[27]. The activity of urea solution towards the removal of sulfur dioxide may be due to the possible bonding of two SO2 molecules to each urea molecule [21].
The results of NO2 absorption at various concentra- tions (100 - 1000 ppm) and fixed absorbent temperature (25˚C) showed a clear increase in the absorption rate as the urea solution increases. However, beyond 0.4 mol/l of urea, the absorption rate decreases especially at lower acid gas concentration. This trend may be attributed to the decrease the diffusivity of gas.
The effect of urea concentration on the absorption rate of NO2 at different absorption temperature in the range (10 - 40˚C) and constant nitrogen dioxide concentration (500 ppm) is shown in Figure 6. It is clear that as the
urea concentration increased, the absorption rate in-creases. The activity of urea solution toward the removal of NO2 may be due to fast bonding of NO2 with urea molecules.
3.1.3. Effect of Temperature of Absorbent
The effect of the temperature of the absorbent on the absorption rate of SO2 is shown in Figure 7 at constant acid gas concentration and various urea concentrations in the range of (0.1 - 0.5) mol/l. The absorption rate is found to decrease considerably with increasing the temperature. At constant urea concentration and various NO2 concen-tration in the range of SO2 (500 - 2500) ppm and NO2 (100 - 1000) ppm, the increase of absorbent temperature lowers the absorption rate of the two acid gases. Such a slightly decreasing rate at higher temperatures may be attributed to the decrease of the solubility and diffusivity of aid gases in urea solution as the temperature increased.
[image:6.595.57.287.359.505.2]Figure 2. Absorption rate as a function SO2 concentration for various urea concentration.
[image:6.595.311.542.552.695.2]Figure 3. Absorption rate as a function NO2 concentration for different urea concentration.
[image:6.595.60.285.556.695.2]Figure 4. Absorption rate as a function NO2 concentration for different Temperatures of absorbent.
Figure 6. Absorption rate of NO2 as a function urea con-centration for various temperatures.
Figure 7. Absorption rate of SO2 as a function of tempera-ture of absorbent for various urea concentrations.
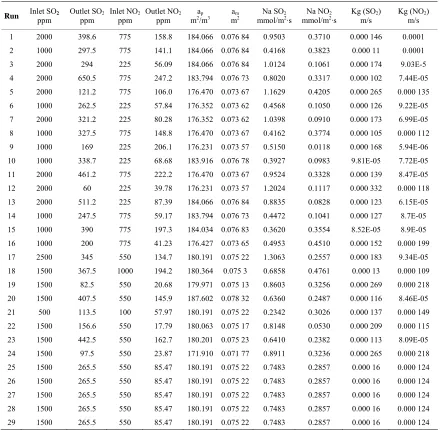
[image:7.595.310.538.89.245.2]3.1.4. Effect of NO2 on SO2 Absorption Rate
Figure 8 shows the absorption rate of SO2 in the pres- ence of various NO2 concentrations at fixed temperature and urea concentration. There existed a minor decrease in the absorption rate decrease with the increase of NO2 concentration. Table 4 shows the experimental data and
values of interfacial area of packing for NO2 and SO2. This slight decrease may be due to the fact that the rate of reaction of urea is faster with NO2 than that with SO2.
3.2. Mass Transfer Coefficient in Packed Tower
The majority of published results for mass transfer coef- ficients in packed towers are for rather small laboratory units of 50 - 250 mm diameter, and there is still some un- certainty in extending these data for use in industrial units. One of the great difficulties in correlating the per- formance of packed towers is the problem of assessing the effective wetted area for interface transfer. It is con- venient to consider separately the conditions where the gas film controls the process, and then where the liquid film controls [18].
3.2.1. Postulating the Model
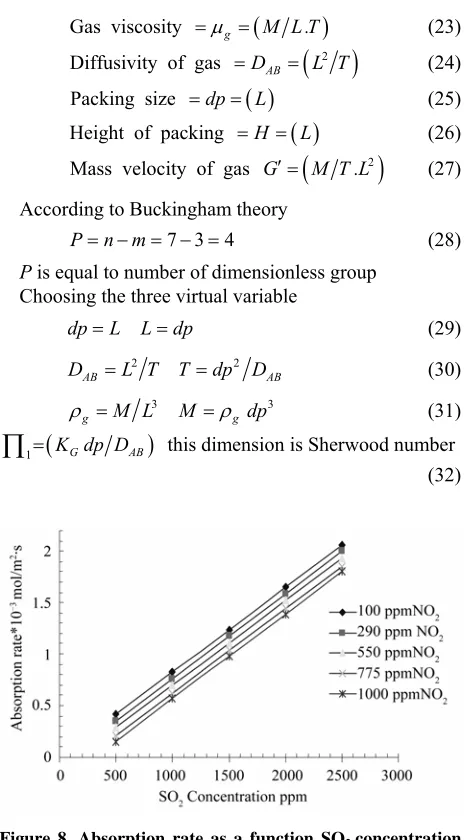
The mass transfer correlation is usually determined by using Buckingham method for dimensional analysis. The mass transfer coefficient is a function of more variable effect on this important parameter in packed bed column. The basic equation relating the variables is
G AB g g
K f dpD G H (20)
The variable and the dimensional constant believed to be involved and their dimensions in the engineering sys-tem are given below
Mass transfer coefficient KG L T (21)
Gas density g
Gas viscosity g
M L .T
(23) Diffusivity of gas
2AB
D L T
(24)Packing size dp
L (25) Height of packing H
L (26)Mass velocity of gas G
M T .L2
(27)According to Buckingham theory
7 3 4
P n m (28)
P is equal to number of dimensionless group Choosing the three virtual variable
dp L L dp (29)
2 2
AB AB
D L T T dp D (30)
3
g
3
g
M L M dp
(31)
1 K dp DG AB
this dimension is Sherwood number (32)Figure 8. Absorption rate as a function SO2 concentration for various NO2 concentrations.
M L
[image:7.595.308.542.286.706.2]Table 4. Experimental results of SO2 andNO2 absorptionand values of interfacial area of packing.
Run Inlet SO2
ppm
Outlet SO2
ppm
Inlet NO2
ppm
Outlet NO2
ppm ap
m2/m3 mam2 mmol/mNa SO22·s mmol/mNa NO22·s Kg (SOm/s 2) Kg (NOm/s 2)
1 2000 398.6 775 158.8 184.066 0.076 84 0.9503 0.3710 0.000 146 0.0001 2 1000 297.5 775 141.1 184.066 0.076 84 0.4168 0.3823 0.000 11 0.0001 3 2000 294 225 56.09 184.066 0.076 84 1.0124 0.1061 0.000 174 9.03E-5 4 2000 650.5 775 247.2 183.794 0.076 73 0.8020 0.3317 0.000 102 7.44E-05 5 2000 121.2 775 106.0 176.470 0.073 67 1.1629 0.4205 0.000 265 0.000 135 6 1000 262.5 225 57.84 176.352 0.073 62 0.4568 0.1050 0.000 126 9.22E-05 7 2000 321.2 225 80.28 176.352 0.073 62 1.0398 0.0910 0.000 173 6.99E-05 8 1000 327.5 775 148.8 176.470 0.073 67 0.4162 0.3774 0.000 105 0.000 112 9 1000 169 225 206.1 176.231 0.073 57 0.5150 0.0118 0.000 168 5.94E-06 10 1000 338.7 225 68.68 183.916 0.076 78 0.3927 0.0983 9.81E-05 7.72E-05 11 2000 461.2 775 222.2 176.470 0.073 67 0.9524 0.3328 0.000 139 8.47E-05 12 2000 60 225 39.78 176.231 0.073 57 1.2024 0.1117 0.000 332 0.000 118 13 2000 511.2 225 87.39 184.066 0.076 84 0.8835 0.0828 0.000 123 6.15E-05 14 1000 247.5 775 59.17 183.794 0.076 73 0.4472 0.1041 0.000 127 8.7E-05 15 1000 390 775 197.3 184.034 0.076 83 0.3620 0.3554 8.52E-05 8.9E-05 16 1000 200 775 41.23 176.427 0.073 65 0.4953 0.4510 0.000 152 0.000 199 17 2500 345 550 134.7 180.191 0.075 22 1.3063 0.2557 0.000 183 9.34E-05 18 1500 367.5 1000 194.2 180.364 0.075 3 0.6858 0.4761 0.000 13 0.000 109 19 1500 82.5 550 20.68 179.971 0.075 13 0.8603 0.3256 0.000 269 0.000 218 20 1500 407.5 550 145.9 187.602 0.078 32 0.6360 0.2487 0.000 116 8.46E-05 21 500 113.5 100 57.97 180.191 0.075 22 0.2342 0.3026 0.000 137 0.000 149 22 1500 156.6 550 17.79 180.063 0.075 17 0.8148 0.0530 0.000 209 0.000 115 23 1500 442.5 550 162.7 180.201 0.075 23 0.6410 0.2382 0.000 113 8.09E-05 24 1500 97.5 550 23.87 171.910 0.071 77 0.8911 0.3236 0.000 265 0.000 218 25 1500 265.5 550 85.47 180.191 0.075 22 0.7483 0.2857 0.000 16 0.000 124 26 1500 265.5 550 85.47 180.191 0.075 22 0.7483 0.2857 0.000 16 0.000 124 27 1500 265.5 550 85.47 180.191 0.075 22 0.7483 0.2857 0.000 16 0.000 124 28 1500 265.5 550 85.47 180.191 0.075 22 0.7483 0.2857 0.000 16 0.000 124 29 1500 265.5 550 85.47 180.191 0.075 22 0.7483 0.2857 0.000 16 0.000 124
2 g g DAB
this dimension is Schmidt number (33)
3 G dp g
this dimension is Reynolds number (34)
4 dp H
(35) These four dimensionless groups are frequently used in mass transfer coefficient correlation. Functionally, their relation may be expressed as
Sh Re Sc dp H, , , 0
(36)
1
Or as Sh Re Sc dp H, ,
It has been found that these dimensionless groups may be correlated well by equation of the type
a
b
cG AB g g g AB
K dp D K G dp D dp H
(38) In which K, a, b, c are experimentally determined by using Statistical- software Windows version 5.5.
0 866
0 599
0 8502
4 19 10 g . g g AB . .
Sh . G dp D dp H
(39) Finally the model can be expressed as in the equation:
1 2. 4 19 102 0 87. 0 6.Sh H dp . Re Sc 0 (40)
. Correlation coefficient, R2 = 0.9838 Variance explained, S = 96.789%
3.2.2. Comparison of the Model with Other Correlation
The proposed model expressed by Equation (40) is com-pared with Sherwood equation [22];
0 83. 0 44.
ShRe Sc (41) where the β' = 0.021 to 0.027 a mean value of 0.023 is used; The Kramer’s equation [23]:
0 59 0 33
0 069 .
Sh . Re Sc (42)
and Weisweiler, et al. [32] equation:
0 8 1 3 0 3 .
Sh . Re Sc dp H
(43)These equations were applied for the operating vari- ables of the present work for acid gas concentration be- tween (100 - 2500) ppm and temperature range (10 - 40)˚C. The comparison indicated a reasonable agreement
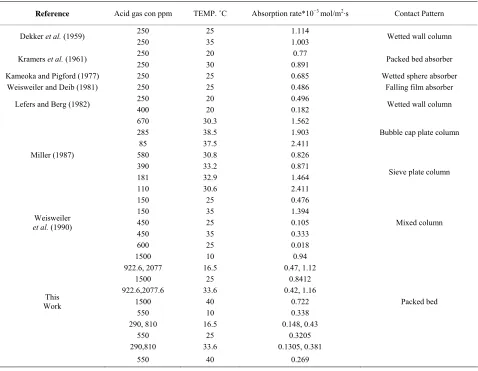
with Kramer’s equation while deviated strongly with those obtained by Weisweiler using the Sherwood Equa-tion (41).The absorption rate values obtained in the pre-sent work for various acid gases concentrations and tem-pera- tures were in the range of 0.320 × 10⁻³ - 1.16 × 10⁻³ mol/m2·s. These values compares well with the published data from several investigators using various absorption designs [17,20,24-27]. The details of the comparison can be seen in Table 5.
4. Conclusions
The following conclusions can be drawn from the present work:
1) The absorption rate of SO2 increases when the tem-perature of absorbent (urea solution) decreases and in-creases as the concentration of absorbent solution.
[image:9.595.59.537.355.726.2]2) The presence of NO2 in the effluent gas stream in addition to SO2 decreases the absorption rate of SO2 in urea solution this may be due to the fast reaction of NO2 with urea as compared with SO2.
Table 5. Comparison of absorption rate values with some published results.
Reference Acid gas con ppm TEMP. ˚C Absorption rate*10−3 mol/m2·s Contact Pattern
250 25 1.114
Dekker et al. (1959)
250 35 1.003 Wetted wall column
250 20 0.77
Kramers et al. (1961)
250 30 0.891 Packed bed absorber
Kameoka and Pigford (1977) 250 25 0.685 Wetted sphere absorber Weisweiler and Deib (1981) 250 25 0.486 Falling film absorber
250 20 0.496
Lefers and Berg (1982)
400 20 0.182 Wetted wall column
670 30.3 1.562
285 38.5 1.903
85 37.5 2.411
Bubble cap plate column
580 30.8 0.826
390 33.2 0.871
181 32.9 1.464
Miller (1987)
110 30.6 2.411
Sieve plate column
150 25 0.476
150 35 1.394
450 25 0.105
450 35 0.333
Weisweiler
et al. (1990)
600 25 0.018
Mixed column
1500 10 0.94
922.6, 2077 16.5 0.47, 1.12
1500 25 0.8412
922.6,2077.6 33.6 0.42, 1.16
1500 40 0.722
550 10 0.338
290, 810 16.5 0.148, 0.43
550 25 0.3205
This Work
290,810 33.6 0.1305, 0.381
Packed bed
3) The absorption rate of NO2 decreases at higher urea concentration 0.4 mol/l for low gas concentration ppm due to the decrease the diffusivity of gas.
4) The variables that affect the absorption rates of SO2 and NO2 in urea solution can be formulated using the dimensionless group analysis and may be expressed by the following equation
Sh (H/dp)1.2 = 4.19*10−2 Re0.87 Sc0.56
This model agrees well with Kramer’s Equation (42) with a correlation coefficient, R, of 0.9838.
5. Acknowledgements
One of us (M.M.B.) is grateful for the Institute of Inter- national Education, IIE, for granting him a scholarship as a visiting Professor at Montclair State University in New Jersey.
REFERENCES
[1] T. Denmead, B. Macdonald, I. White, G. Bryant, D. Grif-fith, A. Kinsela and M. Melville, “Links between Emis-sions of Nitrogen and Sulfur Gases from Acid Sulfate Soils: Field Evidence,” 19th World Congress of Soil Sci-ence, Soil Solutions for a Changing World, Brisbane, 2010.
[2] P. G. Cheremisionff and R. A. Young, “Air Pollution Control and Design Hand Book,” Marcel Dekker, Inc. New York, 1977.
[3] C. M. Hansen, “Control of Sox Emission,” Industrial and Engineering Chemistry Product Research and Develop-ment, Vol. 16, 1977, p. 266.doi:10.1021/i360063a016
[4] V. S. Soldatov, A. V. Kashinskii, T. A. Korshunova and V. I. Martinovich, “Removal of Nitrogen Dioxide from Air Using Aqueous Carbamide on a Fibrous Ion Ex- changer,” Chemistry and Material Science, Vol. 41, No. (Suppl. 2), 2005, pp. 760-763.
[5] U.S.DOE, “Advance Technology for the Control of Sul-fur Dioxide Emission from Coal-Fired Boilers,” Clean Coal Technology Conference, Knoxville, 1999.
[6] B. H. Potter and T. L. Craig, “Control Sulfur Oxide,” Chemical Engineering Programme, Vol. 68, No. 8, 1972, p. 53.
[7] F. S. Chalmer, “Evaluation of Regenerable FGD Proc-ess,” AIChE Journal, Vol. 23, No. 4, 1977, pp. 538-544. [8] E. Bekassy-Molnar, E. Marki and J. G. Majeed, “Sulphur
Dioxide Absorption in Air-Lift-Tube Absorbers by So-dium Citrate Buffer Solution,” Chemical Engineering and Processing, Vol. 44, No. 9, 2005, pp. 1039-1046.
doi:10.1016/j.cep.2005.02.001
[9] J. H. Russel, J. I. Paige and D. L. Paulson, “Evaluation of Some Solid Oxides as Sorbent of SOx,” Rep Invest-U.S
Bur. Mines R1 7582, 1971.
[10] P. G. Gray, “A Fundamental Study on the Removal of Air Pollutants (Sulfur Dioxide, Nitrogen Dioxide and Carbon Dioxide) by Adsorption on Activated Carbon,” Gas
Separation & Purification, Vol. 7, No. 4, 1993, pp. 213- 224. doi:10.1016/0950-4214(93)80020-W
[11] P. Daniell, A. Soltani-Ahmadi and H. O. Kono, “Reaction Kinetics of the SO2-CaO System-Pore Closure Model,”
Powder Technology, Vol. 55, 1988, pp. 75-78.
doi:10.1016/0032-5910(88)80090-1
[12] EPAU.S Environmental Protection Agency, “Alternative Control Techniques Document-Nitric and Adipic Acid,” EPA Publication, No. 450/3-91-026, 1991.
[13] European Commission, “Technical Note on Best Avail-able Technologies Not Entailing Excessive Costs for Heavy Metal Emissions from Non-Ferrous Industrial Plants,” Final Report - May 1991, ECSC-EC-EAEC, Brussels Luxembourg, 1994.
[14] S. H. Zhang, L. L. Cai, X. H. Mi, J. L. Jiang and W. Li, “NOx Removal from Simulated Flue Gas by Chemical
Absorption - Biological Reduction Integrated Approach in a Biofilter,” Environment Science and Technology, Vol. 42, No. 10, 2008, pp. 3814-3820.
doi:10.1021/es800200g
[15] G. A. Streuli and P. R. Averell, “The Analytical Chemis-try of Nitrogen and It Is Compound, Part I,” John Wiley and Sons. Inc, New York, 1970.
[16] D. G. Montgomery, “Design and Analysis of Industrial Experiments,” John Wiley and Sons, New York, 1976. [17] W. Weisweiler and K. H. Deib, “Measurement of
Ab-sorption Rate of NO2 and SO2 in Water in a Falling Film
Absorber,” Chemistry Engineering, Vol. 4, 1981, p. 79. [18] J. M. Coulson and J. F. Richardson, “Chemical
Engi-neering,” Vol. 2, 4th Edition, Pergamon Press, Oxford, 1991.
[19] R. K. Basu and B. K. Dutta, “Kinetic of Absorption of Sulfur Dioxide in Dimethylaniline Solution,” Canadian Journal of Chemistry Engineering, Vol. 65, No. 1, 1987, pp. 27-35.doi:10.1002/cjce.5450650106
[20] J. B. Lefers and P. I. Berg, “Absorption of NO2-N2O4 –
SO2 in to Dilute and Concentrated Aqueous Solution,”
Chemistry Engineering Journal, Vol. 23, 1981, p. 211. [21] R. E. Khoma, M. I. Gavrilenko and V. I. Nikitin,
“Interaction of Sulfur Dioxide with Aqueous Solutions of Amides,” Zhurnal Obshchei Khimii, Vol. 75, No. 5, 2005, pp. 771-777.
[22] T. K. Sherwood, R. L. Pigford and R. L. Wilke, “Mass Transfer,” McGraw-Hill, New York, 1975.
[23] H. Kramers, M. P. Blind and E. Sneck, “Absorption of NO2, SO2, N2O4 by Water Jet,” Chemistry Engineering
Science, Vol. 14, No. 1, 1961, pp. 115-123.
doi:10.1016/0009-2509(61)85062-8
[24] W. Weisweiler, K. Eidam, M. Thiemann and K. W. Wie-gand, “Absorption of NO2/N2O4 in Nitric Acid, Gas,”
Chemistry Engineering and Technology, Vol. 13, No. 3, 1990, pp. 97-101. doi:10.1002/ceat.270130113
[25] W. A. A. Dekker, E. Snoeck and Kramer’s. “The Rate of Absorption of Acid Gas in Water and Aqueous Solution,” Chemistry Engineering Science, Vol. 11, 1951, p. 61.
[26] Y. Kameoka and R. L. Pigford, “Absorption of NO2 in
Water Sulfuric Acid, Sodium Hydroxide and Alkaline So-dium Sulfite Aqueous Solution,” Industrial & Engineering Chemistry Fundamentals, Vol. 16, No. 4, 1977, p. 153.
[27] D. N. Miller, “Mass Transfer in Nitric Acid,” AIChE Journal, Vol. 33, No. 8, 1987, p. 1351.