ISSN Online: 2327-5227 ISSN Print: 2327-5219
DOI: 10.4236/jcc.2019.77006 Jul. 10, 2019 53 Journal of Computer and Communications
Semantic Segmentation Based Remote Sensing
Data Fusion on Crops Detection
Jose Pena
1,2, Yumin Tan
1, Wuttichai Boonpook
11School of Transportation Science and Engineering, Beihang University, Beijing, China 2Venezuela Space Agency (ABAE), Caracas, Venezuela
Abstract
Data fusion is usually an important process in multi-sensor remotely sensed imagery integration environments with the aim of enriching features lacking in the sensors involved in the fusion process. This technique has attracted much interest in many researches especially in the field of agriculture. On the other hand, deep learning (DL) based semantic segmentation shows high performance in remote sensing classification, and it requires large datasets in a supervised learning way. In the paper, a method of fusing multi-source re-mote sensing images with convolution neural networks (CNN) for semantic segmentation is proposed and applied to identify crops. Venezuelan Remote Sensing Satellite-2 (VRSS-2) and the high-resolution of Google Earth (GE) imageries have been used and more than 1000 sample sets have been collected for supervised learning process. The experiment results show that the crops extraction with an average overall accuracy more than 93% has been ob-tained, which demonstrates that data fusion combined with DL is highly feasible to crops extraction from satellite images and GE imagery, and it shows that deep learning techniques can serve as an invaluable tools for larger remote sensing data fusion frameworks, specifically for the applications in precision farming.
Keywords
Data Fusion, Crops Detection, Semantic Segmentation, VRSS-2
1. Introduction
At present RS technology has received great attention in the agriculture com-munity due to its ability to provide periodic and regional information for crop monitoring and thematic mapping [1] [2]. Modern RS to identify any features How to cite this paper: Pena, J., Tan, Y.M.
and Boonpook, W. (2019) Semantic Seg-mentation Based Remote Sensing Data Fusion on Crops Detection. Journal of Computer and Communications, 7, 53-64. https://doi.org/10.4236/jcc.2019.77006
DOI: 10.4236/jcc.2019.77006 54 Journal of Computer and Communications on the surface is no longer considered as a processing of a one-source single date image. It has shifted to multi-source fusion of multi-temporal images. Several spectral indices have been proven to be valuable tools in describing crop spatial variability. In this context, the images of high spatial and spectral resolution have already proved their potential and effectiveness in crop detection. However, when we are considering to identify the types of crops with multispectral image-ries, RS becomes more challenging. The main challenge of satellite based remote sensing application in agricultural field at present is that there is no suitable sensors with very high spatial resolution like below 50 centimeters and with a good temporal resolution and spectral resolution at the same time.
Indeed, novel approaches and algorithms using Unmanned Aerial Vehicle (UAV) or satellite based multispectral imaging have been developed for vegeta-tion classificavegeta-tion [3]. But, the acquisivegeta-tion of UAV images or images of other platform such as GeoEye-1, WorldView-4 and KompSat 3a can be difficult to acquire considering the high cost, and their availability only in the specific small region. Google Earth (GE) provides an open data source with very high spatial resolution, which represents a very good alternative for crops detection. Very few studies have been undertaken to use GE images as the direct data source for land use/cover mapping [4]. Numerous methods based on DL have been pro-posed recently for agricultural applications over specific RS data, especially fo-cusing on high resolution and hyperspectral images [5], plant phenotyping [6] or weed scouting [7] and early disease detection [8]. However, some recent ap-proaches have tried to directly adopt deep architectures designed to identify other aspects related to the vegetation or the diseased plants, the results, al-though very encouraging, appeared coarse [9].
DOI: 10.4236/jcc.2019.77006 55 Journal of Computer and Communications
2. Materials and Methods
2.1. Study Area
The study area is located in the north-central region of Venezuela, Aragua State, Palo Negro Sector-Venezuela. The most important agricultural production is concentrated in this area and the main crops produced are banana, pasture, pa-paya and coco. Banana and pasture production have greater importance in the study area, because they represent 65% of the economy of that region of Vene-zuela. In recent years their production and thereby, the source of employment have been declined considerably. Reasonably, the state has taken steps to identify and quantify the possible reasons and overcome the problems. ‘Bare land’ comes into this issue as one of the solutions to increase their production using that lands which are in plenty. In this study, different training zones and testing zone are used.
2.2. Data Sets Construction
The design of the training dataset is the key to the performance of a good CNN classification model, and the construction of dataset is described below. All three datasets used in this research are contained the RGB image set from VRSS-2 image, Google earth mapping, and data fusion images which are composed of the multispectral bands including RGB bands, Near-infrared (NIR), and norma-lized difference vegetation index (NDVI).
2.2.1. VRSS-2 Image
VRSS-2 was launched on October 09, 2017, and owned by the Bolivarian Agency for Space Activities (ABAE). It contains two different cameras, High Resolution Camera (panchromatic and multispectral sensors) and Infrared Camera. VRSS-2 data has a total of 10 bands including a panchromatic band (band 1) which has 1 meter of spatial resolution, nine multispectral bands (band 2 - 10) which has the spatial resolution in 3 meter (band 2 - 5), 30 m (band 6 - 8) and 60m (band 9 - 10) respectively. However, in this research, only five bands are selected (bands 1 - 5).
The radiometric calibration procedure is first applied to selected VRSS-2 im-ages to generate a consistent output imim-ages. To obtain the high-quality fusion data, it is important to apply the data corrections for various lighting conditions such as overcast skies and partial cloud coverage. To correct for this aspect, we utilize sunlight sensors measuring the sun’s orientation and sun irradiance, as shown in Figure 1.
The obtained data are stored as quantized and calibrated Digital Numbers (DN). The DN are converted to surface reflectance value using the Equation (1) with coefficients provided in metadata file and ABAE.
( )
(
)
2/ cos
TOA
sum s
L d E
ρ = × ×π × θ (1)
where,
ρ
TOA is surface reflectance of the earth at the top of the atmosphere, L isDOI: 10.4236/jcc.2019.77006 56 Journal of Computer and Communications Figure 1. Radiometric calibration pattern samples. (a) Image without calibration and (b) image after calibration.
micrometers, d2 is average distance between the earth and the sun in
atmos-pheric units (UT), Esum is ex-atmospheric irradiation in watt/m2/micrometers
and cos
( )
θ
s is cosine of the angle of the solar elevation. Once the Top ofAt-mosphere (TOA) reflectance of required bands are calculated, they are stacked to get one single image.
2.2.2. Google Earth Imagery
Google Earth provides open and highly spatially resolved images. This platform contains petabyte-scale data for scientific analysis and visualization, easily ac-cessible and user-friendly, and a convenient environment for interactive data or algorithm development. However, GE images have rarely been used as the main data source to identify crops. GE images are limited to a three-band color code (R, G, B), which is expected to lower the classification performance due to its poor spectral signature [10]. Actually, the potential for the classification of spa-tial characteristics by Google Maps has been underestimated [11].
2.2.3. Data Fusion
The purpose of data fusion is to obtain more accurate and more abundant in-formation than any single dataset by processing multi-source redundant data in space and time according to certain algorithms, and then generate combination images with new space, spectrum, and time characteristics [12]. In this study, the first implementation of data fusion is done between band 1 and band 2 - 5 of VRSS-2 which were captured under 0% cloud cover on 16 December 2018. The multispectral bands have a native spatial resolution of 3m, but they are pan sharpened to 1m by using the panchromatic band. The Gram Schmidt (GS) pan-sharpen method was used in this process. In the second implementation of data fusion, the Google earth images which have the high resolution up to 50 cm were fused with the infrared band of above fused VRSS-2 images. The result of data fusion is multispectral bands (R, G, B, NIR). After the two fusions, crop recognition accuracy could be increased to some degree, but it is still hard to differentiate similar crops by traditional classification. Therefore, to improve the crop detection precision, Normalized Difference Vegetation Index (NDVI) is computed and used, which could enhance the spectral information and increas-ing the separability of the interested classes.
2.3. Methods
di-DOI: 10.4236/jcc.2019.77006 57 Journal of Computer and Communications vided into three steps: First, fusion between two selected remote sensing image-ries are made and NDVI band is computed, and then these newly produced im-ages are used as input in the training dataset labeling. Second, we have employed a self-designed data sets and semantic segmentation network to provide a per pixel semantic labeling of the input data. Finally, the accuracy assessment is conducted. Two experiments are designed and implemented in this research ac-cording to the different datasets used.
2.3.1. Data Preparation
SegNet architecture cannot directly deal with one scene of VRSS-2 image, due to the limitation of GPU memory and other factors. Resizing images to a proper size is a common idea, but it will result in the loss of large amounts of informa-tion. In this paper, we propose a patch-wise to deal with this problem. Firstly, the VRSS-2 image was resized into 120 scenes of 3200 × 2400 pixels which are at the same amount and size as the Google scenes, which are subsequently merged. Secondly the image was split into many local patches with an appropriate size according to the dataset and the GPU capacity (the size of a local patch for our dataset was 480 x 480 pixels). Sample datasets can be seen in Figure 2.
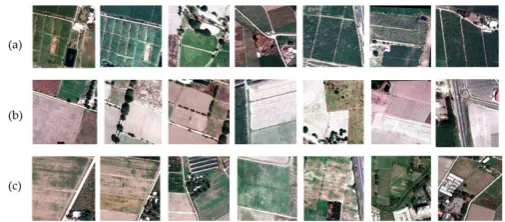
[image:5.595.211.539.447.524.2]As to the dataset production, we first separated all images used for training into three semantic classes and labeled them as banana, pasture and bare land separately. The challenges in creating such datasets lie in that there are so many patterns, different shapes and colors, confusing details caused by low attitude, and complex land cover types in the object area. The sample dataset is show in Figure 3. In our experiment, we divide these annotated datasets into three sets:
Figure 2. Samples with different size, band combination. (a) Image bands with 3200 x 2400 pixels and from left to right: true color, color-infrared, NDVI, GNDVI and SPEAR Vegetation Delineation, (b) according bands with 480 × 480 pixels.
[image:5.595.248.501.584.695.2]DOI: 10.4236/jcc.2019.77006 58 Journal of Computer and Communications 750 sets for training, 20% of randomly selected from the training set for validat-ing, and 50 sets for testing. The testing set is captured from different areas com-pared to the training sample set.
Figure 3(a) shows some scenes with banana plantation where you can see different levels of growth, even within the plantations there are irregular areas without crops. Figure 3(b) shows the bare lands with various color and some sample observations of different types of land conversions. The Figure 3(c) shows diverse kinds of pasture with mixed colors, managed with agricultural practices of seeding, irrigation and with practices like controlled burning and regulated intensity of grazing. In order to annotate the crop types, Labelme software is selected in this research to label and design a preprocessor for build-ing labeled dataset. By artificial labelbuild-ing, a large number of annotations for dif-ferent crops classes was created. All data are classified into four datasets. The first dataset bases on the data fusion of VRSS-2 satellite images between pan-sharpening image with multispectral bands (R, G, B), which is called VRSS-2 dataset here. The second dataset as named GI is the RGB image from Google earth imagery which consists of RGB bands. The third dataset is the data fusion of VRSS-2 with Google earth images, which is called data fusion dataset. Lastly, the fourth dataset is the combination of data fusion dataset and addition-al feature bands which comprise the RGB image, NIR, and NDVI image. The four datasets will be evaluated the performance on crop extraction following the experiment design.
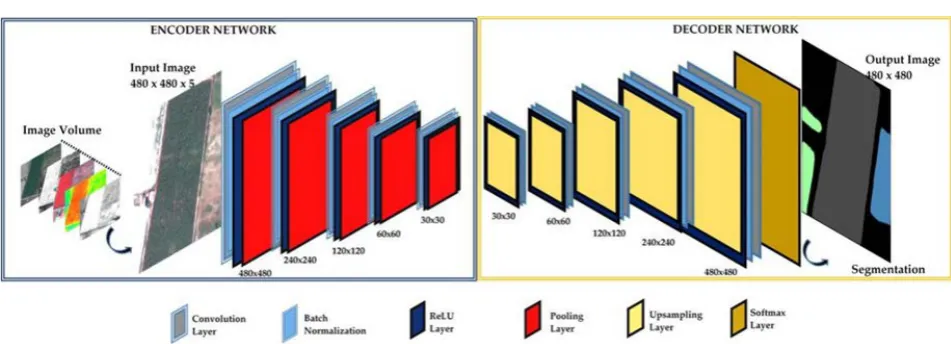
2.3.2. SegNet-Based Semantic Segmentation
DOI: 10.4236/jcc.2019.77006 59 Journal of Computer and Communications Figure 4. SegNet is composed of: the encoder (left) and the decoder (right). The input is an RGB image and the output is a segmentation image.
difference is that they do not have a non-linearity, and they up sample their in-put, using indices stored from the encoding stage. After the final decoder, the output is fed to a softmax classifier that gives the final prediction. SegNet is clearly structured and it is easy to understand the convolutional network of the model. In the model, dropout and batch normalization layers are introduced in the architecture, and dropout is applied at the fully connected layer, while batch normalization is used at every convolution. Furthermore, it was employed the ReLU function after all convolution layers. The max-pooling is applied with a stride of two in order to subsequently reduce the spatial dimension of the patch and focusing on the central pixel.
2.4. Accuracy Assessment
The semantic image segmentation challenge is evaluated using the mean Inter-section over Union (mIoU) metric. The mIoU is a standard measure metric that represents the ratio of intersection to union between the prediction and ground truth. For evaluate the classification models was used overall accuracy (OA). In addition, the overall F1 score for all the classes in each data sets was computed.
3. Results
3.1. Experiment: Crops Extraction Based on Google Imagery,
VRSS-2 and Finally Data Fusion (RGB)
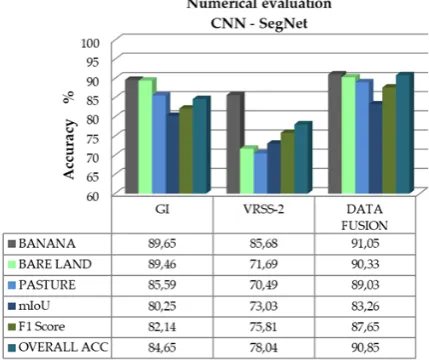
[image:7.595.59.535.63.235.2]DOI: 10.4236/jcc.2019.77006 60 Journal of Computer and Communications Figure 5. Cross validation overall accuracy of different data sets: only Google Imagery (GI), only VSRR-2 and data fusion only RGB images.
differentiate accurately the different types of crops which makes it more errors for SegNet to locate the common features, because of its structure containing a single convolutional network.
In the case of the pasture and bare land classes the model is able to distinguish some plantation with a low level of accuracy below to 75%. The GI results show how large fields of different crops are properly mapped especially banana and bare land zones. Comparing the GI and VRSS-2 results, we see that GI yielded has 6% increasing in overall accuracy and 7% in F1 score. It demonstrates that crops extraction can boost classification performance for high-resolution im-agery. However, the results present problems on pixels closer to the pasture area. Visual comparisons show that the segmentation results of SegNet architecture are more accurate in data fusion. Figure 6 shows different banana, bare land and pasture crops, but visually the samples grouped in left side they are a bit differ-ent with respect to the samples displayed in right side, because they have others patterns, color and shape, also shows diverse kind of pasture with mixed colors, managed through more intensive agricultural practices of seeding, even within the banana plantations there are irregular areas without crops, also the sunlit and shaded banana plant leaves and torn banana plant leaves and the bare lands with various color and some sample observations of different types of land con-versions.
3.2. Experiment 2: Crops Extraction Based on Data Fusion (RGB)
and Additional Feature Bands
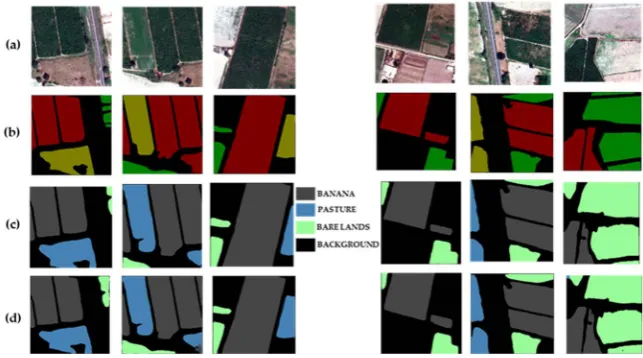
DOI: 10.4236/jcc.2019.77006 61 Journal of Computer and Communications Figure 6. Visual segmentation results on testing set which consist of input ground true image (a), label data (b), crops extraction result from Google imagery (c), crops extraction result VRSS-2 RGB images (d) and crops extraction result Data fusion RGB images (e).
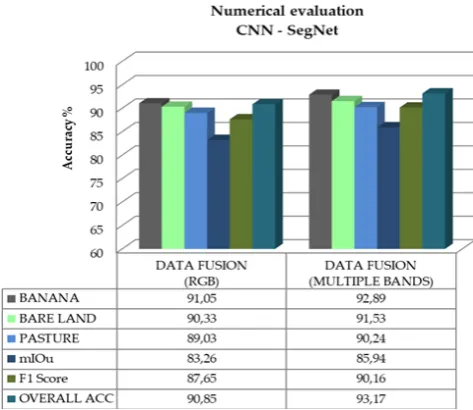
Figure 7. Cross validation overall accuracy between data fusion (RGB) and data fusion with multiple bands.
[image:9.595.253.490.369.574.2]DOI: 10.4236/jcc.2019.77006 62 Journal of Computer and Communications the use of each sensor individually.
The improvement of the results is due to the spectral fusion, spatial informa-tion and the vegetainforma-tion indices. Meanwhile, when is add multiple bands the clas-sification networks lead to higher overall accuracy, F1 score and mIoU for all three data sets. In addition, the proposed method achieves the highest accuracies on all classes. The results are also presented when the multiple bands are ap-plied, which provides an average improvement of almost 3% in accuracy. As it can be seen, the training data provided is limited with respect to public datasets. Nevertheless, the proposed network is able to produce smooth classification re-sults for all cases, considering the three classes involved and the different cha-racteristics of the images.
Comparing these results, we see that data fusion with multiple bands yielded a 2 percent increasing in overall accuracy. It demonstrates that VIs allowed the enhancing of the spectral information and increasing the separability of the in-teresting classes. Through the results, it is possible to verify that the datasets prepared with the data fusion with multiple bands are considerably better than the data from a single sensor such as Google imagery or VRSS-2. Visual com-parisons show that the segmentation results of SegNet architecture are more ac-curate in data fusion. See Figure 8. Our CNN learnt and performed better on higher resolution images with multiple bands. When the image spatial resolution is high, and it added more additional bands extracted from the Vis. the accuracy show a better result. This also implies that, if CNNs are trained on high-resolution images with NDVI, GNDVI, ENDVI or other bands the performance will be better.
4. Conclusion
[image:10.595.212.534.501.680.2]In this paper, we proposed a data fusion model based on SegNet architecture to
DOI: 10.4236/jcc.2019.77006 63 Journal of Computer and Communications perform crops detection with the remote sensing imagery of different sources. To build the training datasets, we selected two different area of the study area. The first one has been used to collect training data, and the second one was used for test data collection. Data fusion between VRSS-2 images and Google imagery was applied through the Gram Schmidt pan-sharpen method. Our study dem-onstrate that data fusion combined with DL is highly feasible to crop extraction from satellite images and GE imagery, as it has showed promising results for all the images have been studied, given that they are from different sources and distinct characteristics. It also proves that deep learning techniques can serve as invaluable tools for larger remote sensing data fusion frameworks. Moreover, data fusion model with the SegNet architecture allowed the full utilization of the strength of the convolution in the extraction of spatial semantics and made ap-propriate use of the rich information contained in the pixels of the remote sensing images, thus achieving a more accurate segmentation. The model pre-sented in this paper provides a solution for the crop’s extraction or the segmen-tation of the crop’s plansegmen-tation using VRSS-2 images and GI. The future work should include a deeper study on the data fusion level integrating lidar informa-tion with radar and hyper spectral images.
Conflicts of Interest
The authors declare no conflicts of interest regarding the publication of this pa-per.
References
[1] Lee, J., Seo, J. and Kang, S. (2018) Development of a Biophysical Rice Yield Model Using All-Weather Climate Data. Korean J. Remote Sens, 33, 721-732.
[2] Kim, Y., Park, N. and Lee, K.D. (2018) Self-Learning Based Land-Cover Classifica-tion Using Sequential Class Patterns from Past Land-Cover Maps. Remote Sens, 9, 921. https://doi.org/10.3390/rs9090921
[3] Senthilnath, J., Kandukuri, M., Dokania, A. and Ramesh, K.N. (2017) Application of UAV Imaging Platform for Vegetation Analysis Based on Spectral-Spatial Methods. Comput. Electron. Agric., 140, 8-24.https://doi.org/10.1016/j.compag.2017.05.027
[4] Hu, Q., et al. (2013) Exploring the Use of Google Earth Imagery and Object-Based Methods in Land Use/Cover Mapping. Remote Sens., 5, 6026-6042.
https://doi.org/10.3390/rs5116026
[5] Hou, F., Lei, W., Li, H. and Xi, J. (2018) FMRSS Net: Fast Matrix Representa-tion-Based Spectral-Spatial Feature Learning Convolutional Neural Network for Hyperspectral Image Classification. Math. Probl. Eng., 2018, Article ID: 9218092.
https://doi.org/10.1155/2018/9218092
[6] Pound, M., et al. (2016) Deep Machine Learning Provides State-of-the-Art Perfor-mance in Image-Based Plant Phenotyping. bioRxiv, 053033.
[7] Di Cicco, M., Potena, C., Grisetti, G. and Pretto, A. (2016) Automatic Model Based Dataset Generation for Fast and Accurate Crop and Weeds Detection. 2017 IEEE/RSJ International Conference on Intelligent Robots and Systems (IROS), Vancouver, BC, 24-28 Sept. 2017. https://doi.org/10.1109/IROS.2017.8206408
DOI: 10.4236/jcc.2019.77006 64 Journal of Computer and Communications Devices, Applied on a Wheat Use Case. Comput. Electron. Agric, 138, 200-209.
https://doi.org/10.1016/j.compag.2017.04.013
[9] Liang-Chieh, C., Papandreou, G., Kokkinos, I., Murphy, K. and Yuille, A. (2015) Semantic Image Segmentation with Deep Convolutional Nets and Fully Connected CRFs. Proc. Int. Conf. Learn., Representations.
[10] Yu, L. and Gong, P. (2011) Google Earth as a Virtual Globe Tool for Earth Science Applications at the Global Scale: Progress and Perspectives. Int. J. Remote Sens, 33, 3966-3986.https://doi.org/10.1080/01431161.2011.636081
[11] Dragut, L., Tiede, D. and Levick, S. (2010) ESP: A Tool to Estimate Scale Parameter for Multiresolution Image Segmentation of Remotely Sensed Data. Int. J. Geogr. Inf. Sci, 24, 859-871.https://doi.org/10.1080/13658810903174803
[12] Li, H., Ding, W., Cao, X. and Liu, C. (2017) Image Registration and Fusion of Visi-ble and Infrared Integrated Camera for Medium-Altitude Unmanned Aerial Vehicle Remote Sensing. Remote Sens, 9, 441.https://doi.org/10.3390/rs9050441
[13] Boonpook, W., et al. (2018) A Deep Learning Approach on Building Detection from Unmanned Aerial Vehicle-Based Images in Riverbank Monitoring. Sensors, 18, 3921.https://doi.org/10.3390/s18113921
[14] Cascio, D., Taormina, V. and Raso, G. (2019) Deep Convolutional Neural Network for HEp-2 Fluorescence Intensity Classification. Appl. Sci, 9, 408.
https://doi.org/10.3390/app9030408