ISSN Online: 2151-1969 ISSN Print: 2151-1950
DOI: 10.4236/jgis.2019.112010 Apr. 8, 2019 124 Journal of Geographic Information System
Hierarchical Merging & Generalization Method
of Three-Dimension City Model Group Based on
the Theory of Spatial Visual Cognition
Chaokui Li
1,2*, Jianhui Chen
1,2, Jun Fang
1,2, Huiting Li
1,2, Pu Bu
1,21National-Local Joint Engineering Laboratory of Geo-Spatial Information Technology, Hunan University of Science and
Technology, Xiangtan, China
2Hunan Province Engineering Laboratory of Geospatial Information, Hunan University of Science and Technology, Xiangtan,
China
Abstract
In order to simplify the three-dimensional building group model, this paper proposes a clustering generalization method based on visual cognitive theory. The method uses road elements to roughly divide scenes, and then uses spa-tial cognitive elements such as direction, area, height and their topological constraints to classify them precisely, so as to make them conform to the ur-ban morphological characteristics. Delaunay triangulation network and boundary tracking synthesis algorithm are used to merge and summarize the models, and the models are stored hierarchically. The proposed algorithm should be verified experimentally with a typical urban complex model. The experimental results show that the efficiency of the method used in this paper is at least 20% higher than that of previous one, and with the growth of test data, the higher efficiency is improved. The classification results conform to human cognitive habits, and the generalization levels of different models can be relatively unified by adaptive control of each threshold in the clustering generalization process.
Keywords
Visual Cognition, 3D Building Model Group, Geometry Threshold, Hierarchical Generalization, Cluster Generalization
1. Introduction
Three-dimensional city model is the key infrastructure of digital city and smart city. The expression of multi-scale three-dimensional city model is the frontier How to cite this paper: Li, C.K., Chen,
J.H., Fang, J., Li, H.T. and Bu, P. (2019) Hierarchical Merging & Generalization Method of Three-Dimension City Model Group Based on the Theory of Spatial Vis-ual Cognition. Journal of Geographic In-formation System, 11, 124-137.
https://doi.org/10.4236/jgis.2019.112010
Received: March 12, 2019 Accepted: April 5, 2019 Published: April 8, 2019
Copyright © 2019 by author(s) and Scientific Research Publishing Inc. This work is licensed under the Creative Commons Attribution International License (CC BY 4.0).
DOI: 10.4236/jgis.2019.112010 126 Journal of Geographic Information System
2. The Problem Statement and Theoretical Model
A city, a microcosm of the real world, reflects the structure, layout, and human activities of certain parts of the real world, and can perform certain functions. Therefore, urban models, especially urban architectural models, are essential parts of helping people understand spatial and temporal relationships. The 3D city scene itself is of scale and complexity, and the 3D fine model of large range and multi-details makes the real-time visualization of virtual city become a chal-lenging problem. Therefore, it is necessary to cluster the 3D city model under the premise of ensuring the accuracy of certain space geometry, and to conform to the human visual perception rule. This can not only significantly improve the efficiency of scene rendering and rendering, but also obtain comprehensive in-formation about human activities and urban layout, which can effectively ana-lyze time and space.
Urban morphology can be used to capture certain patterns of urban formation and evolution. The city is a gathering place of human beings, and its evolution is closely related to human activities. Therefore, based on the law of visual percep-tion in morphology, we make a global sense of clustering, generalizapercep-tion and analysis of 3D building models. Through cluster generalization, we can not only get the overall layout of the city, but also find the aggregation point of the city and the law of the density distribution of the urban building group, which can provide data support for the real geo-spatial analysis. In geographical space, the distance near a similar level of geographical entity distance can bring the nature of similarity for 3D model [7], 2D distance based classification method needs to be extended, the need to consider the 3D model specific height information. At-tention is paid to the direction difference and height difference of the model, as well as the characteristics of global urban morphology and human spatial cogni-tion law. This research is mainly based on the visual cognitive law of morpholo-gy. In the clustering process, road network segmentation is used to maintain the whole structural characteristics of the urban building model. The accuracy of clustering is controlled by spatial cognitive related factors such as topological relationship, orientation relationship, height and area, and global clustering is carried out. In the process of merging and generalizing, triangular network and boundary tracking algorithm are used to synthesize the clustering, and try to ensure the balance of rendering interaction, and finally store it hierarchically.
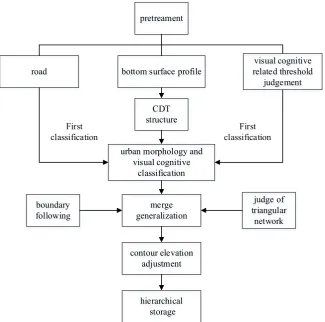
Cluster generalization consists of three main operations, which are model clustering, model merging, model generalization and hierarchical storage. The flow chart of model clustering and generalization is shown as Figure 1.
2.1. Model Clustering
DOI: 10.4236/jgis.2019.112010 127 Journal of Geographic Information System
Figure 1. Work-flow chart for the models’ merging and generalizing.
when clustering the model [8]. According to the readability of urban morpholo-gy, Lynch [9] divides the city into five main categories: Road, boundary, node, region and landmark [10]. The road is the city readability cognition is extremely important factors, road network can show the arranged in a crisscross pattern layout of the entire city; landmark, is the feature points need to pay attention to the landmark building is of special significance in the whole city pattern, so the need for specific treatment when clustering, as the original to preserve the city characteristics. According to these five elements and the Gestalt criterion, the clustering of visual perception based groups is carried out for 3D building mod-els.
2.1.1. Establishing a Restricted Triangulation Network
Firstly, the Delaunay triangulation is constructed by using the Gestalt criterion and the similar features of adjacent geographical entities in the geographical space to determine the proximity between buildings. Delaunay triangulation is a triangle composed of the closest three points, which has the characteristics of uniqueness and stability. By using this property of Delaunay triangulation, the Delaunay triangulation is used to start the clustering generalization between buildings, and then the graph is integrated.
With convenient operation and cluster behind, the centroid of the surface tri-pretreament
road bottom surface profile related threshold visual cognitive judgement
CDT structure
urban morphology and visual cognitive
classification First
classification classificationFirst
merge generalization
contour elevation adjustment
hierarchical storage boundary
following
judge of triangular
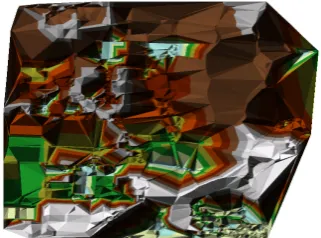
DOI: 10.4236/jgis.2019.112010 128 Journal of Geographic Information System angulation construction based on the traditional method, but the automatic es-tablishment of triangulation based on building the profile of automatic extrac-tion of boundary point or vertex algorithm. The algorithm and program for au-tomatic extraction of edge generation TIN are designed, and the generated TIN is shown in Figure 2.
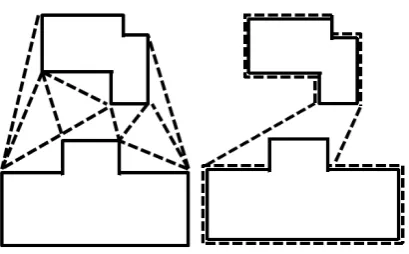
The method of triangulation is based on boundary points or contour vertex, so we need to do some sifting operations, and the correct connection triangles are retained by filtering. As shown in Figure 3. Since the model clustering process takes place between different models, it is not necessary to study the structure and composition of the model, so the triangular mesh built in the model should be removed. Here, through the superposition operation with the bottom contour map, the triangulation network inside the contour map is de-leted, and the triangulation network [10] [11] [12] [13], which can reflect the re-lation between buildings, is preserved. After deleting the traversal, the resulting triangulation is analyzed. There are two cases: 1) Some triangulation networks are built on the same building surface, such as T1 and T2 triangulation in Figure 3, they are wrong triangulation. 2) The triangulation network is built on the out-line of different buildings, such as all the correct triangulation in Figure 3. Here, you need to delete all the wrong triangulation in the first case and retain all the correct triangulation that reflects the merging relationship between buildings in the second case. For the first case, it can be found and deleted that the wrong triangulation of the first case can be ruled out by a concave and convex analysis, and reconstructed the new triangulation such as the real line triangulation, and the reasonable triangulation in the second cases are preserved, and the CDT (Constrained Delaunay Triangulation)1 is generated comprehensively, as shown in Figure 4.
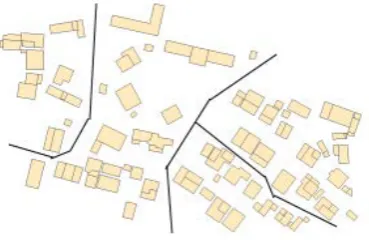
[image:5.595.293.454.583.702.2]After the establishment of CDT1, according to Lynch proposed five morpho-logical elements of the principle, CDT1 continue to be divided, first of all, CDT1 and road network overlay division. Road is an important factor to control the layout of the whole city. The classification of road elements not only conforms to the characteristics of urban morphology, but also improves the efficiency of clas-sification. Rough grouping of building model by road network gets the initial classification results G1, as shown in Figure 5.
DOI: 10.4236/jgis.2019.112010 129 Journal of Geographic Information System
[image:6.595.283.464.266.398.2]Figure 3. Delaunay triangulation.
Figure 4. Constrained delaunay triangulation 1.
Figure 5. Division map by road.
2.1.2. Cluster Analysis Based on Visual Perception
Visual perception refers to the perception process of human beings to obtain in-formation through the visual judgment in the daily life. A range of mental processes that include the perception, storage, memory, and decoding of geo-graphic information. The difference of the perceptual modes is the main basis for judging the division of spatial scales. According to different scales and dif-ferent spatial perception patterns, space can be divided into graphics, streets-cape, environment and geographical space.
[image:6.595.280.465.437.557.2]de-DOI: 10.4236/jgis.2019.112010 130 Journal of Geographic Information System velopment and evolution. In urban planning, after the key functional areas are identified, visual perception is adopted to construct the city. Therefore, in building cluster analysis, we need to take into account the human visual cogni-tive habits, people’s visual perception habits generally have the following three situations:
1) Homotropism or ipsilaterality. Visually it is customary to default buildings on the same side of the road to the same category [14]; the buildings of the same or similar direction are the default. Therefore, it is necessary to consider the use of topological relations to determine the same side of the road, and to analyze the difference between the buildings.
2) Area similarity. Visually inclined to incorporate buildings of similar size into one class. So you need to consider the area difference between buildings. If the area difference exceeds a certain value, it will need to be re grouped.
3) Height. Height is a characteristic of a three-dimensional building model. If the building height difference between the control in a certain range, the vision will tend to return for a class. Therefore, it is necessary to consider the difference of height between buildings in the initial classification. In addition, height based analysis can quickly determine some landmark buildings, which have important guiding significance for the overall urban structure and development changes.
Based on this, this paper deals with the clustering of buildings. The road net-work controls the whole layout of the whole city. Therefore, firstly, the urban road network and the CDT2 are superimposed and analyzed, and the Delaunay triangulation network intersected with the road network is deleted. The effect is shown in Figure 4. And then use visual perception in the same side or lateral judgment to further classify. Through the topological relation of the surface layer, the location relation of the building and its adjacent road network (same side or different side) is judged and assigned, the same side is 1, the other side is 0, and the same side is classified. Initial classification results G2 are obtained. Based above, then we use the three elements of the direction, height and area in visual cognition to analyze and classify them further.
1) Height: as an important feature of three-dimensional building model, it has great theoretical significance for its analysis and judgment. Height based analysis generally focuses on two cases: Firstly, the extraction of landmark buildings. The emergence of landmark buildings can affect the overall layout of the city. In ur-ban planning, landmark buildings are generally used as agglomeration points to form clear density classification and functional zoning. Second, the difference between the height of the building can be classified two times. The method of analysis is as follows: by setting a parameter δh, it is screened and classified by comparing the δh with the designated threshold.
DOI: 10.4236/jgis.2019.112010 131 Journal of Geographic Information System where havg is the average height of this cluster, hi is the height of the building
i and ai is the weight coefficient, representing the footprint area of the building
i. Among them, it is the weight value of the building in the community of the building, that is, the area of the bottom outline of the building, the average height of the building group, and the height of the building. If it is greater than the threshold, the building is extracted as a separate group, otherwise, the build-ing is classified into one class.
2) Area: area is also more important information of 3D building model. The similarity of area size can also be used as a judgment factor of clustering. The area is generally used in combination with the distance, as a compound judg-ment condition, to avoid a large number of repeated calculations, and to im-prove efficiency. The method is as follows: by setting a parameter to judge.
i a
avg
a a
δ
= ∂ × (2)where ∂ is the weight, the distance between adjacent buildings, ai represents the building area of building i, aavg represents the average building area of all
buildings.
3) Directions: visually, people tend to classify buildings in the same direction. In this paper, the method of linear detection is used to determine the direction. The building centroid as the link point, centroid connected with the line be-tween multiple buildings, analysis to determine the angle bebe-tween line links, the following three conditions: a) If the angle is 0 degrees and 180 degrees, it can be classified to judge the same. b) If the angle is an acute angle or right angle, the link line is broken and extracted from the existing grouping as a new class. c) If the angle is greater than 90 degrees, the direction is similar or classified.
2.2. Hierarchical Merging and Storing
2.2.1. Model Merging and Generalization
During the hull merging and simplification process, the algorithm introduces some geometric errors into the final mesh. We call these geometric errors nega-tive spaces because our algorithm adds geometry to previously empty spaces. We define the negative space of a cluster mesh as the difference in area between its footprint and the sum of the buildings’ footprints. In this paper, the method of merging and boundary tracing analysis by Delaunay is used to judge, and the analysis results are further screened through angle. By setting the angle thre-shold, this is set to 135 degrees based on the experience value [15] [16] [17], and if the angle does not exceed the threshold, the initial merged contour is retained (Figure 6).
1 1 n i i i n i i h h = = × ∂ = ∂
∑
∑
(3)DOI: 10.4236/jgis.2019.112010 132 Journal of Geographic Information System
Figure 6. Polygon conflation.
2.2.2. Hierarchical Storage of Data
We use a tree structure to store the simplified models. Because there is no new vertex introduced, the coordinates of the original vertex are stored alone. For every node in the tree, we only store the identifiers of its corresponding vertex rather than its vertex coordinates (see Figure 7). It can avoid vertex coordinates being stored redundantly, thus saving much storage space. Every node also stores the attached useful information, such as the sum of the building area and its height.
In Figure 7, from top to bottom diagram is divided into three layers, and the detail levels are increased in turn. Each layer consists of a number of vertex, each vertex contains coordinates and height information. You can access the corres-ponding storage structure of the model according to the different levels of detail requirements of the architectural model.
3. Experiment and Result Analysis
3.1. Experiment Environment
Hardware Environment: Operation System of Windows 7, process unit Inter(R) of Core(TM) i5 CPU 2.53 GHz, memory 2.00 G; Development Environment: Microsoft Visual Studio 2010 and ArcEngine; Visualization Tool: OpenGL de-velopment package.
3.2. Clustering Experiment and Result Analysis
To demonstrate the performance and efficiency of our methodology, experi-ments have been done for purposes of evaluation. In this paper having a certain area of Lanzhou City as experimental area, data resource including vector data of bottom of test area, road data etc., clustering test is as following:
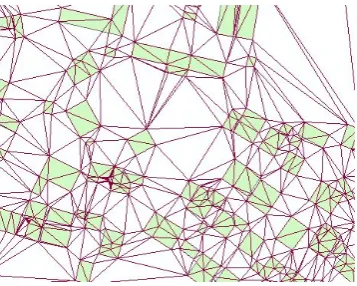
Firstly, based on the face data of building bottom, obtaining the points of boundary or vertex automatically, and constructing the Delaunay Triangulation net automatically, shows as following Figure 8.
DOI: 10.4236/jgis.2019.112010 133 Journal of Geographic Information System
Figure 7. The hierarchical models are stored in the tree structure.
Figure 8. Delaunay triangulation net.
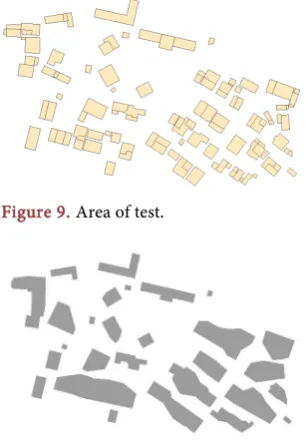
Thirdly, choose the way of combine the Delaunay triangulation net with boundary trace to merge models. The test area is shown in Figure 9, results of Cluster generalization shows as Figure 10. And the tests of Algorithmic effi-ciency for huge range has made to this Algorithm.
From Figure 10, we can see that: After the experimental process, the experi-mentation areas are clustered out 28 groups, by examining the texture, area, height, direction and other characteristics of each building in each group, we find that: Above all the characteristics in the same group are more consistent. The model arrangement is more in line with human visual perception, and the classification of the clustering results is also consistent.
[image:10.595.285.464.279.422.2]DOI: 10.4236/jgis.2019.112010 134 Journal of Geographic Information System generalization level of different models can be relatively unified. The clustering results of this algorithm are shown in Figure 11(c).
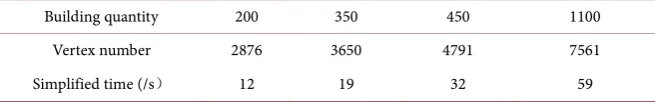
Further study on the computation efficiency of two algorithms, using the data in Figure 9 for test, and test the time cost of two algorithms during the course of model simplifying. Test results are shown in Table 1 and Table 2. From Table 1 and Table 2, we can see that: 1) with the increase of the amount of data, the time-cost of simplifying increases by two curves; 2) the algorithm is more effi-cient than Chang algorithm in simplification efficiency.
[image:11.595.296.450.267.490.2]As we can see, the experimental area was clustered out into 28 groups, consi-dering building texture, area, height, direction and other features. The classifica-tion results are also consistent with spatial cogniclassifica-tion. As the amount of data in the model increases, time goes up in a two-fold.
[image:11.595.228.526.516.694.2]Figure 9. Area of test.
Figure 10. Results of cluster and generalization.
(a) Original model (b) Convex quadrilateral bounding box
DOI: 10.4236/jgis.2019.112010 135 Journal of Geographic Information System
Table 1. Efficient of the algorithm proposed in this paper.
Building quantity 200 350 450 1100
Vertex number 2876 3650 4791 7561
Simplified time (/s) 10 15 25 45
Table 2. Efficient of the Chang’s algorithm.
Building quantity 200 350 450 1100
Vertex number 2876 3650 4791 7561
Simplified time (/s) 12 19 32 59
4. Conclusions
Based on visual cognitive theory, this paper summarizes the global clustering of urban models. Global clustering uses the segmentation method of road network, and makes full use of the characteristics of urban morphology, so as to ensure the invariance of structure. By introducing topological relations, height thre-shold, area threthre-shold, orientation threshold and other factors related to people’s spatial cognitive visual characteristics, the clustering accuracy is improved. The results show that:
1) The overall grouping effect can be consistent with the human visual cogni-tive law, the area of the building model, height and direction.
The features of the model are consistent, and the arrangement of the model conforms to visual cognition and Gestalt criterion.
2) The use of landmark model can fully retain the original features of the city, more in line with people’s cognitive habits.
3) The application of visual cognition and threshold constraints can be more flexible and accurate to obtain the required fine degree of the model, and the combined use of Delaunay triangulation and boundary tracking, effectively re-duces the original model and the existing model of area difference, rere-duces un-necessary data processing burden when rendering.
4) Controlled by visual cognitive orientation, area, height threshold, for dif-ferent models, the generalization hierarchy can achieve a relatively uniform, conducive to the back of the model of hierarchical storage and rendering, and the Chang algorithm is significantly different.
5) This paper takes into account the geometric characteristics and topological characteristics of visual perception, so as to achieve the classification results con-sistent with visual perception effect. Texture, as an effective and fast way of judgment and analysis in visual cognition, can improve classification efficiency and visualization results through accurate measurement and analysis of texture information, which is the direction of further research in the future.
Acknowledgements
[image:12.595.210.538.172.223.2]DOI: 10.4236/jgis.2019.112010 136 Journal of Geographic Information System (No.: 41571374), the Key Research Project of Hunan Education Ministry (No.: 16A070), Nature Science Joint Funding of Hunan Province and Xiangtan Local (No.: 2017JJ4037).
Conflicts of Interest
The authors declare no conflicts of interest regarding the publication of this paper.
References
[1] Chang, R., Butkiewicz, T., Ziemkiewicz, C., et al. (2008) Legible Simplification of Textured Urban Models. IEEE Computer Graphics and Applications, 28, 27-36. [2] Yang, L., Zhang, L.Q., Ma, J.T., Xie, J.H. and Liu, L. (2011) Interactive Visualization
of Multi-Resolution Urban Building Models Considering Spatial Cognition. Inter-national Journal of Geographical Information Science, 25, 5-24.
[3] Zhang, L.Q., Deng, H., Chen, D. and Wang, Z. (2012) A Spatial Cognition-Based Urban Building Clustering Approach and Its Applications. International Journal of Geographical Information Science, 27, 721-740.
[4] Kada, M. (2011) Aggregation of 3D Buildings Using a Hybrid Data Approach. Car-tography and Geographic Information Science, 38, 153-160.
[5] Liu, W.K., Tang, J.B., Cai, J.N., etal. (2016) Algorithm Comparison for Clustering of Moving Objects in Traffic System. Geography and Geo-Information Science, 32, 69-74.
[6] Regnauld, N. (2001) Contextual Building Typification in Automated Map Genera-lization. Algorithmica, 30, 312-333.
[7] Glander, T. and Döllner, J. (2009) Abstract Representations for Interactive Visuali-zation of Virtual 3D City Models. Computers, Environment and Urban Systems, 33, 375-387.
[8] Zhao, J.Q., Zhu, Q., Du, Z.Q., Feng, T.T. and Zhang, Y.T. (2012) Mathematical Morphology-Based Generalization of Complex 3D Building Models Incorporating Semantic Relationships. ISPRS Journal of Photogrammetry and Remote Sensing, 68, 95-111.
[9] Lynch, K. (1960) The Image of the City. MIT Press, Cambridge, MA.
[10] Chang, R., Wessel, G., Kosara, R., et al. (2007) Legible Cities: Focus-Dependent Multi-Resolution Visualization of Urban Relationships. IEEE Transactions on Vi-sualization and Computer Graphics, 13, 1169-1175.
[11] Yan, H., Weibel, R., Yang, B. (2008) A Multi-Parameter Approach to Automated Building Grouping and Generalization. GeoInformatica, 12, 73-89.
[12] Pan, W.B., Liu, P., Zhou, J., et al. (2016) Research on Hierarchical Clustering of Three-Dimensional Building Models Based on House Contour and Texture. Journal of Geo-Information Science, 18, 406-415.
[13] Mao, B., Ban, Y. and Harrie, L. (2011) A Multiple Representation Data Structure for Dynamic Visualisation of Generalised 3D City models. ISPRS Journal of Photo-grammetry and Remote Sensing, 66, 198-208.
[14] Allouche, M.K. and Moulin, B. (2005) Amalgamation in Cartographic Generaliza-tion Using Kohonen’s Feature Nets. International Journal of Geographical Informa-tion Science, 19, 899-914.
DOI: 10.4236/jgis.2019.112010 137 Journal of Geographic Information System
support System for Urban Planning. Geomatics and Information Science of Wuhan University, 5, 505-509.
[16] Glander, T. and Döllner, J. (2008) Automated Cell Based Generalization of Virtual 3D City Models with Dynamic Landmark Highlighting. Proceedings of the 11th ICA Workshop on Generalization and Multiple Representation, Monpellier, France, 20-21 June 2008.
[17] Zhang, M., Zhang, L., Mathiopoulos, P.T., etal. (2012)A Geometry and Texture Coupled Flexible Generalization of Urban Building Models. ISPRS Journal of Pho-togrammetry and Remote Sensing, 70, 1-14.