SIMULATING THE EFFECT OF ROD STIFFNESS CHANGE ON THE
RECIPROCATING PUMPS
1
*Ahmed M. Osman,
1
Faculty of Engineering, Ain Shams University, Egypt; Regional Manager, Odessa Separator Inc., USA
2Mechanical Power Engineering Department, Ain
ARTICLE INFO ABSTRACT
Several types of researches were done to model and simulate the reciprocating pump rod stiffness change even through mechanical spring, hydraulic actuators, and pneumatic actuators. The objective of this r
reciprocating pump performance and its starting requirements. Changing the reciprocating pump rod stiffness value was done through a pneumatic system by changin
pneumatic cylinder inside the pneumatic system, this can be considered a change in the reciprocating pump rod stiffness. A test rig was manufactured to experimentally investigate the impact of rod stiffness change on the
key components are test rig frame, reciprocating pump system, AC electric motor with its gearbox, Scotch Yoke mechanism, pneumatic system, instrumentations and measuring devices
reciprocating pump rod stiffness change through pneumatic cylinder can affect the starting requirements of the reciprocating pump such as the starting torque and the current. From the results above, the starting torque requirements were de
corresponding to the peak starting torque was decreased by an average of 9% and the overall system performance and efficiency were increased by an average of 10%.
Copyright © 2018, Ahmed Osman et al. This is an open use, distribution, and reproduction in any medium, provided
INTRODUCTION
Previous researches were focused on modeling and simulating of the reciprocating pump rod stiffness. Instrumentations were used to monitor, measure, and calculate starting
it is the major factor which will determine the overall experiment accuracy. Several researches were done to model and simulate the reciprocating pump rod stiffness change. Some researches took the approach of physical modeling reciprocating pump rod stiffness change
mechanical model (spring) and equipped the system with a linear variable displacement transformer (LVDT) to measure the spring differential displacement. Measurements
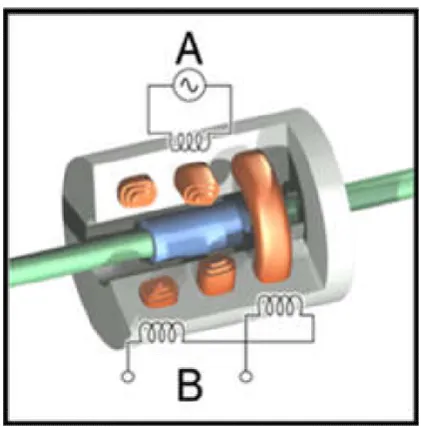
in upward and downward stroke and then calculate the torque from the differential displacement. The typical LVDT sensor consists of a primary coil (A) and two secondary coils (B) wound on a coil form. Differencing the output of these coils will result in a voltage proportional to the relative movement. The linear variable displacement transformer (LVDT) theory is to interpret the position or linear
*Corresponding author: Ahmed M. Osman,
Faculty of Engineering, Ain Shams University, Egypt; Regional Manager, Odessa Separator Inc., USA.
ISSN: 0975-833X
DOI: https://doi.org/10.24941/ijcr.Article History:
Received 10th July, 2018
Received in revised form 29th August, 2018
Accepted 24th September, 2018
Published online 30th October, 2018
Citation: Ahmed M. Osman, Mohamed A. El-Samanoudy And Ashraf Ghorab,
reciprocating pumps and its starting requirements”, International Journal of Current Research
Key Words:
Reciprocating pump performance, Pneumatic modeling,
Rod Stiffness Change,
Reciprocating pump starting requirements.
RESEARCH ARTICLE
SIMULATING THE EFFECT OF ROD STIFFNESS CHANGE ON THE PERFORMANCE OF
RECIPROCATING PUMPS AND IT’S STARTING REQUIREMENTS
*Ahmed M. Osman,
2Mohamed A. El-Samanoudy and
2Ashraf Ghorab,
Faculty of Engineering, Ain Shams University, Egypt; Regional Manager, Odessa Separator Inc., USA
Mechanical Power Engineering Department, Ain-Shams University, Cairo, Egypt
ABSTRACT
Several types of researches were done to model and simulate the reciprocating pump rod stiffness change even through mechanical spring, hydraulic actuators, and pneumatic actuators. The objective of this research is to simulate the effect of changing the reciprocating pump rod stiffness value on the reciprocating pump performance and its starting requirements. Changing the reciprocating pump rod stiffness value was done through a pneumatic system by changin
pneumatic cylinder inside the pneumatic system, this can be considered a change in the reciprocating pump rod stiffness. A test rig was manufactured to experimentally investigate the impact of rod stiffness change on the performance of reciprocating pumps and its starting requirements. The test rig key components are test rig frame, reciprocating pump system, AC electric motor with its gearbox, Scotch Yoke mechanism, pneumatic system, instrumentations and measuring devices
reciprocating pump rod stiffness change through pneumatic cylinder can affect the starting requirements of the reciprocating pump such as the starting torque and the current. From the results above, the starting torque requirements were decreased by an average of 19 %, power consumption corresponding to the peak starting torque was decreased by an average of 9% and the overall system performance and efficiency were increased by an average of 10%.
open access article distributed under the Creative Commons Attribution provided the original work is properly cited.
focused on modeling and simulating of the reciprocating pump rod stiffness. Instrumentations were used to monitor, measure, and calculate starting torque because it is the major factor which will determine the overall were done to model and simulate the reciprocating pump rod stiffness change. physical modeling fness change through the mechanical model (spring) and equipped the system with a linear variable displacement transformer (LVDT) to measure Measurements need to be in upward and downward stroke and then calculate the starting torque from the differential displacement. The typical LVDT sensor consists of a primary coil (A) and two secondary coils (B) wound on a coil form. Differencing the output of these coils will result in a voltage proportional to the relative The linear variable displacement transformer (LVDT) theory is to interpret the position or linear
Faculty of Engineering, Ain Shams University, Egypt; Regional Manager,
displacement from a mechanical position to an electrical signal for determining the startingtorque.
displacement transformer (LVDT) output depends only on the mechanical motion, not an electric
shaft and transducer. Figure 1 shows the linear variable displacement transformer (LVDT).
developed a mathematical method to model the stiffness of the hydraulic system. He concluded that the stiffness of a hydraulic actuator can be increased if we applied a larger piston area and can be decreased with a smaller total oil volume. Tassa et al. (2013) developed a mathematical model then conducted an experimental test to achieve modern control methods applied to the pneumatic control. The model assumed two pneumatic chambers with the same pressure, and two similar pressure inputs (the compressor a
Computer simulation for the model was performed and a mathematical model for the pneumatic cylinder stiffness was deduced. Dihovicni et al. (2011)
consists of a double acting pneumatic cylinder and their control system is proportional spool valves.
system with mathematical equations, then performed simulation and animation. The model includes the effect of several factors on the overall system such as time delay in the
International Journal of Current Research
Vol. 10, Issue, 10, pp.74124-74131, October, 2018
DOI: https://doi.org/10.24941/ijcr.32582.10.2018
Samanoudy And Ashraf Ghorab, 2018. “Simulating the effect of rod stiffness change on the
International Journal of Current Research, 10, (10), 74124-74131.
PERFORMANCE OF
STARTING REQUIREMENTS
Ashraf Ghorab,
Faculty of Engineering, Ain Shams University, Egypt; Regional Manager, Odessa Separator Inc., USA
Shams University, Cairo, Egypt
Several types of researches were done to model and simulate the reciprocating pump rod stiffness change even through mechanical spring, hydraulic actuators, and pneumatic actuators. The objective esearch is to simulate the effect of changing the reciprocating pump rod stiffness value on the reciprocating pump performance and its starting requirements. Changing the reciprocating pump rod stiffness value was done through a pneumatic system by changing the air pressure supplied to the pneumatic cylinder inside the pneumatic system, this can be considered a change in the reciprocating pump rod stiffness. A test rig was manufactured to experimentally investigate the impact of rod performance of reciprocating pumps and its starting requirements. The test rig key components are test rig frame, reciprocating pump system, AC electric motor with its gearbox, Scotch Yoke mechanism, pneumatic system, instrumentations and measuring devices. Simulating the reciprocating pump rod stiffness change through pneumatic cylinder can affect the starting requirements of the reciprocating pump such as the starting torque and the current. From the results creased by an average of 19 %, power consumption corresponding to the peak starting torque was decreased by an average of 9% and the overall system
ribution License, which permits unrestricted
displacement from a mechanical position to an electrical signal the startingtorque. The linear variable displacement transformer (LVDT) output depends only on the electric connection to the pump r. Figure 1 shows the linear variable displacement transformer (LVDT). Feng et al. (2017) developed a mathematical method to model the stiffness of the hydraulic system. He concluded that the stiffness of a hydraulic actuator can be increased if we applied a larger piston area and can be decreased with a smaller total oil developed a mathematical model then conducted an experimental test to achieve modern control methods applied to the pneumatic control. The model assumed two pneumatic chambers with the same pressure, and two similar pressure inputs (the compressor and the atmosphere). Computer simulation for the model was performed and a mathematical model for the pneumatic cylinder stiffness was (2011) worked on the system that consists of a double acting pneumatic cylinder and their ol system is proportional spool valves. They presented the mathematical equations, then performed simulation and animation. The model includes the effect of several factors on the overall system such as time delay in the
INTERNATIONAL JOURNAL OF CURRENT RESEARCH
Figure 1 . The Linear Variable Displacement Transformer (LVDT)
[image:2.595.52.283.477.689.2]Figure 2. Test Rig Overview
Figure 1. Overall Pneumatic System
pneumatic path, leakage between chambers, and air compressibility in cylinder chambers as well as non-linear flow through the valve. The model was simulated on MAPLE and MATLAB programming languages and tried to include the complexity of the model by including partial differential equations.
Rahmat et al. (2014) presented a historical research on pneumatic actuators including modeling and control researches and then discussed complete mathematical modeling, which tries to model the dynamics of the pneumatic system. Shen et al. (2007) constructed a new configuration for a pneumatic actuator with variable stiffness. The model was based on control pneumatic actuator by a pair valve that can be operated in three ways instead of controlling them by a four-way servo valve. The stiffness can be varied by changing it by each of the valve, which can be operated in three ways and separated in its action from the actuator resulting in force. This paper gave a particularly good example of the use of a pneumatic actuator as a variable stiffness actuator. The output stiffness was easy to be managed with the actuation force. The paper provided a series of the equation, which can link the degree of the variable stiffness of the pneumatic cylinder with the air pressure inside it. Firouzeh et al. (2015) presented in their paper a design in addition to the fabrication method of a double acting pneumatic actuator with variable actuation degrees by varying the stiffness layers. Stiffness can be varied through the changing of the stiffness layers, and this can be done by temperature change for a certain value by using microheaters and thermistors. The main application was increasing the number of degree of freedoms in robots driven by a soft pneumatic actuator.
Czmerk (2015) analyzed the stiffness of a double acting cylinder as a function of chamber pressures and the bulk modulus, then concluded that the stiffness of a pneumatic system can be a function in pressure change done by piston displacement. The author also developed a method for increase positioning accuracy of the pneumatic actuator at the final positions, which can help in the control algorithm of servo-pneumatic systems. From all previous researches, several ways were explained to simulate the reciprocating pump rod stiffness change. In the present paper, a method was presented to simulate and model the reciprocating pump rod stiffness change through a pneumatic model (Double acting cylinder) and equipping the system with a compression and tension load cell (S Shape). The choices of stiffness model were between hydraulic model and pneumatic model. The choice was the pneumatic model (Double acting pneumatic cylinder) because it is suitable for clean environments and much safer. The pneumatic system is more preferred compared with the same hydraulic system due to the availability of the air. Besides that, the pneumatic system is simple to construct, flexible and can be used with the small weights. To measure the force acting on the reciprocating pump rod during suction stage and discharge stage. Compression and tension load cell (S Shape) was installed between the pneumatic cylinder and the reciprocating pump rod. The output depends only on the mechanical motion, notelectric connection of the pump shaft and transducer.
Experimental setup
Test RIG: A test rig was manufactured to experimentally
investigate the impact of rod stiffness change on the performance of reciprocating pumps and its starting requirements. The test rig key components are test rig frame, reciprocating pump system, AC electric motor with its gearbox, Scotch Yoke mechanism, pneumatic system, instrumentations and measuring devices. The main assembly consists of three main systems: frame and fixation system, reciprocating pump system with closed loop suction and discharge, motor and gearbox system.
Scotch yoke mechanism, pneumatic system, instrumentation, and drive. Figure 2 shows an isometric drawing of the overall assembly and table 1 shows the overall assembly parts.
Pneumatic system:
A pneumatic system was selected to supply, regulate pressurized air to the pneumatic cylinder. Pressure gauge, pressure transducer and pressure regulator are installed to control and monitor the pressure of the air supplied by the
[image:3.595.106.483.60.247.2]compressor to the pneumatic cylinder. The change in the air pressure supplied to the pneumatic cylinder can be considered as a change in the reciprocating pump rod stiffness. The pneumatic system components are air compressor, pressure regulator, pressure gauge, pressure transducer, pneumatic cylinder, hoses, and fitting. To simulate the reciprocating pump rod stiffness changes a pneumatic cylinder need to be installed in between the Scotch Yoke mechanism and the reciprocating pump system. Overall Pneumatic System is presented in Figure 3.
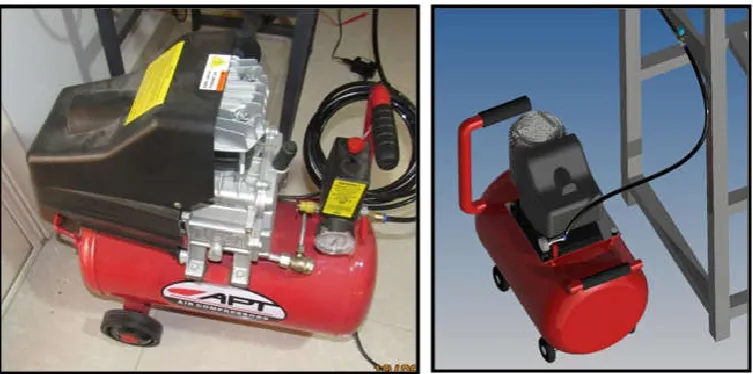
[image:3.595.86.500.287.456.2]Figure 4. Pneumatic System Air Compressor
Figure 2. Pneumatic System Air Regulator
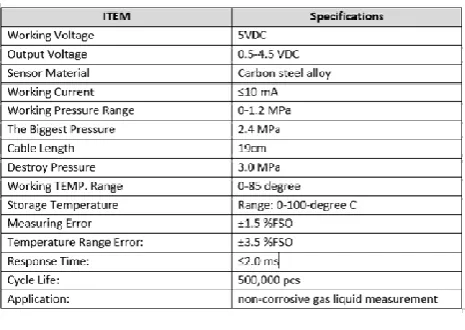
[image:3.595.93.504.488.657.2]Figure 7. Pressure Transducer
[image:4.595.84.242.57.214.2]Figure 8.Pneumatic System Double Acting Cylinder
Figure 9. Load Cell Transducer (S Shape)
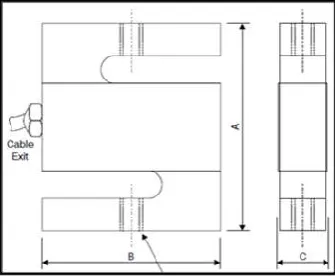
Figure 10. The Load Cell Dimension
[image:4.595.69.259.250.407.2]Figure 11. Connection between Pneumatic Cylinder and the Load Cell
[image:4.595.309.558.308.656.2]Figure 12. Double Acting Pneumatic Cylinder
Figure 13. Performance during Increasing Air Pressure and (RPM =10) Table 1. The Overall Assembly Parts
No. DESCRIPTION MATERIAL
1 Reciprocating Pumps Stainless Steel
2 Frame and Fixation System Alloy Steel
3 Closed Loop Suction and Discharge PVC
4 Tank PVC
5 Motor and Gear Box System Carbon Steel
6 Scotch Yoke Mechanism Carbon Steel
7 Pneumatic System Air Compressor Carbon Steel
8 Pneumatic System Double Acting Cylinder Stainless Steel
9 Load Cell Transducer (S Shape) Stainless Steel
10 Variable Speed (Frequency) Drive Plastic
[image:4.595.73.254.443.599.2] [image:4.595.79.247.636.774.2]The air compressor function is supplying the pressurized air up to 8 bars to the pneumatic cylinder to simulate the reciprocating pump rod stiffness change effect. The air compressor shown in Figure 4 supplies the pressurized air to the pressure regulator. The function of the pressure regulator presented in Figure 5 is changing the air pressure value to create different air pressure cases which create different rod stiffness during the experiment. After the pressure regulator is regulating the pressurized air supplied from the air compressor to certain value, the path of the pressurized air then goes through the pressure gauge and the pressure transducer with measuring error 1.5 % (from the full scale). Figure 6 shows the pneumatic system pressure transducer. After the pressurized air is monitored by the pressure gauge and the pressure transducer, it continues its path to the pneumatic cylinder. Figure 7 shows the pressure transducer and its specifications are described in Table 2. The pneumatic cylinder is acting as variable stiffness rod as the reciprocating pump rod stiffness can be changed by changing the air pressure supplied to the pneumatic cylinder. The pneumatic cylinder can hold pressure up to 10 bar, temperature up to 70-degree C and its maximum stock is 50 mm. The pneumatic cylinder is a double acting cylinder and is equipped with two valves to hold the pressure in the two ways and to enable safely release of the held pressure after the experiment is finished. Figure 8 shows the pneumatic system double acting cylinder.
Load cell transducer (S Shape)
To measure the force acting on the reciprocating pump rod during the suction stage and discharge stage an S shape, compression and tension load cell presented in figure 9. It was installed between the pneumatic cylinder and the reciprocating pump rod. The S shape compression and tension load cell was made from alloy steel, can measure weight up to 60 Kg. in both ways. The amplifier was attached to amplify the signal to be monitored directly without the need for another instrument. The weight range that the load cell can handle was from 0 Kg. to 60 Kg. which will be reflected into volts from 0-volt DC to 5 volts DC by the built-in amplifier. The load cell dimension was shown in figure 10 and Table 3.The load cell specification is as per Table 4, where all specifications are with reference to the FS (full-scale reading).
Connection between the pneumatic cylinder and the load cell
The connection made in between the pneumatic cylinder and the load cell was pin and box connection while the connection made in between the load cell and the reciprocating pump rod was through rod end and horizontal bolt. Figure 11 shows the connection between the pneumatic cylinder and the load cell from above and below. Additional nuts and rubber fasteners are used to damp the vibrations of the tension and the compression forces during the suction and the delivery phases.
System limitations
The load cell transducer measures the force acting on the reciprocating pump rod during the suction stage and discharge stage. The load cell transducer limitation (rated reading) was five volts which exceeds when we operate the experiment above twenty-three revolutions per minute. The Pressure transducer measures the discharge pressure at reciprocating pump discharge. The Pressure transducer limitation (rated
reading) was 24 Bar which can cover the experiment all inputs combinations. The compressor pressure in the local market was eight bar supplying air with twenty-liter capacity. The pressure needed to start the experiment and to overcome the Scotch Yoke mechanism weight was six Bar. The compressor can handle up to eight bar which was sufficient for the experiment needs.
Design equations and calculations
Modeling of pneumatic cylinder: The main objective of
modeling of the pneumatic cylinder was to find a way to represent the rod stiffness (K) as a function of the air pressure inside the pneumatic cylinder (Shen and Goldfarb, 2007). Figure 12 shows a double acting pneumatic cylinder, the air inside represents the stiffness force. The output force from a double acting pneumatic cylinder (F) was a function of the pressures inside each cylinder chamber (Pa) and (Pb), The area
of each side of the double-acting pneumatic cylinder chambers (Aa), (Ab) atmospheric pressure (Patm.) and cross-sectional area
of the piston rod (Ar.). The output force from a double acting
pneumatic cylinder was calculated from equation (1).
F = P A – P A − P A (1)
The output stiffness of a double acting pneumatic cylinder (K) is calculated from equation (2) where (F) was the output force from a double acting pneumatic cylinder and (x) is the piston displacement.
K = (2)
By substitution from equation (1) into equation (2), equation (3) can be obtained.
K = ( – ) = A + A (3)
The volume of the double-acting pneumatic cylinder chambers V (a, b) is a function of the area each side of double acting
pneumatic cylinder chambers A (a, b), piston displacement (x),
and length of the double-acting pneumatic cylinder (L).
( , ) = ( , ) ± x (4)
The double-acting pneumatic cylinder chambers pressure P (a, b)
can be presented as a function of the volume double acting pneumatic cylinder chambers (V (a, b)), mass flow rate entering
the double-acting pneumatic cylinder chambers (m (a, b)),
keeping into consideration ideal gas assumption.
P( , ) = ( , )
( , ) (5)
By substitution from equation (4) into equation (5), equation (6) can be obtained which present the double-acting pneumatic cylinder chambers pressure P(a,b) as a function of the mass
flow rate entering the double-acting pneumatic cylinder chambers (m(a,b)), the area of each side of double acting
pneumatic cylinder chambers (A(a,b)), and length of the
double-acting pneumatic cylinder (L).
( , ) = ( , ) ( , ) ( ± )
Differentiating equation (6) with respect to x gives equation (7).
( , )
= ± ( , )
( , ) ( ± )
(7)
By substitution from equation (7) into equation (3) , equation (8) can be obtained which present the output stiffness of a double acting pneumatic cylinder (K) as a function of the mass flow rate entering the double-acting pneumatic cylinder chambers (m(a,b)), piston displacement (x), and length of the
double-acting pneumatic cylinder (L).
= RT
+
(8)
By substitution from equation (6) into equation (8), equation (9) can be obtained which present the output stiffness of a double acting pneumatic cylinder (K) as a function of the double-acting pneumatic cylinder chambers pressure P (a,b), the
area of each side of double acting pneumatic cylinder chambers A(a,b), )), piston displacement (x), and length of the
double-acting pneumatic cylinder (L).
K =
+ (9)
Design of load cell (s shape) - maximum force acting on the reciprocation pump
The design of the load cell should be considered the maximum force that can act on the reciprocating pump in the maximum pump pressure. The maximum force acting on the reciprocating pump (rod load (FRL)) that the pump can afford
was calculated from the Maximum Operating Pressure PMAX
where D = Plunger Diameter. The maximum rod load (FRL)
was calculated from equation (10).
F P (10)
The maximum rod load (FRL) was calculated as:
F 40 ft. 0.43
.
π
3 = 121.5 lbs.
The maximum rod load (FRL) 121.5 lbs. can be written in
different units which equal to 540 N. The capacity of the load cell (S Shape) was up to 60 Kg. equal to 588 N. which can handle the maximum force acting on the reciprocating pump.
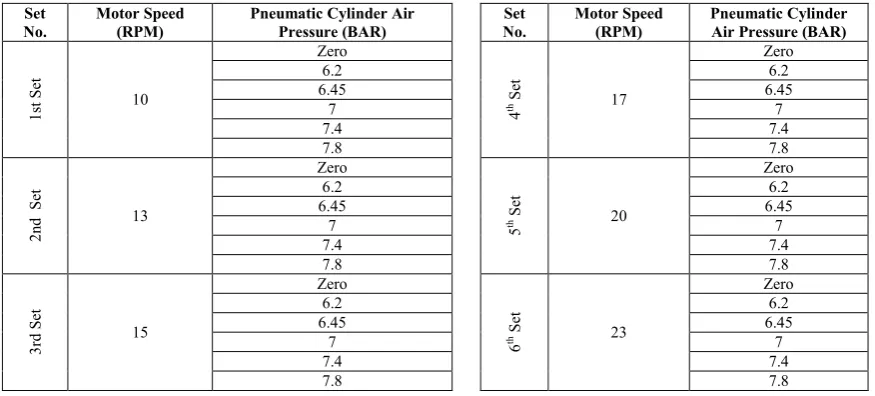
Input data and input combination
Input combinations resulted from varying different input parameters such as motor speed and air pressures inside the pneumatic cylinder. Big number of experiments were performed with changing the previously mentioned parameters.
The experiments were categorized into six sets, each set will contain six experiment which will result in thirty-six experiments. In each set, the motor speed was constant and the air pressures inside the pneumatic cylinder were changed. Table 5 presents the combination done of each input parameters.
RESULTS AND DISCUSSION
[image:6.595.318.551.227.392.2]In this experiment, the drive input factor in this experiment was the air pressure inside the pneumatic cylinder which reflects the reciprocating pump rod stiffness change. While increasing air pressure inside the pneumatic cylinder, monitor the various pump output parameters and starting requirements were essential to evaluate the effect of the stiffness change on the overall pump performance. The main output curves which were constructed are maximum starting torque, power consumption during starting torque and corresponding efficiency.
Table 1. Pressure Transducer Specifications
Table 3. The Load Cell Dimensions
Weight (Kg.) A (mm.) B (mm.) C (mm.)
0.41 63.5 51 16
Table 2. The Load Cell Specification
Figure 13 shows the reciprocating pump maximum rod starting torque, maximum power consumption during starting torque and corresponding efficiency. This done with increasing the air pressure inside the pneumatic cylinder and with constant revolution per minute (RPM =10). Other experiments were run for the rest of motor speeds. When the reciprocating pump started at fixed motor speed and while increasing the air pressure inside the pneumatic cylinder from zero bar to 7.8 bar, the reciprocating pump starting conditions were monitored.
The increase of the air pressure inside the pneumatic cylinder from zero bar to 7.8 bar simulate the reciprocating pump rod stiffness change and during this rod stiffness change, the starting conditions such as starting torque, power consumption and pump efficiency were monitored. Table 6 shows the reciprocating pump performance improvement when running the pump with fixed motor speed (10 RPM), and while increasing the air pressure inside the pneumatic cylinder from zero bar to 7.8 bar.
Table 5. Input Combination
Set No.
Motor Speed (RPM)
Pneumatic Cylinder Air Pressure (BAR)
Set No.
Motor Speed (RPM)
Pneumatic Cylinder Air Pressure (BAR)
1
st
Set 10
Zero
4
th Set 17
Zero
6.2 6.2
6.45 6.45
7 7
7.4 7.4
7.8 7.8
2
n
d
Set 13
Zero
5
th Set 20
Zero
6.2 6.2
6.45 6.45
7 7
7.4 7.4
7.8 7.8
3
rd S
et
15
Zero
6
th Set 23
Zero
6.2 6.2
6.45 6.45
7 7
7.4 7.4
[image:7.595.63.534.311.372.2]7.8 7.8
Table 6. Performance Improvement at Fixed Motor Speed (10 RPM)
Air Pressure Inside Pneumatic Cylinder (Bar) Starting Torque (N.m.) Power Consumption (W) Efficiency (%)
0 33 115 27 %
7.8 27 99 30 %
Peak Starting Torque Decrease (%)
Power Consumption Decrease (%)
Overall System Efficiency Increase (%)
[image:7.595.69.530.399.457.2]% of Improvement 18 % 14 % 11 %
Table 7. Performance Improvement at Fixed Motor Speed (13 RPM)
Air Pressure Inside Pneumatic Cylinder (Bar) Starting Torque (N.m.) Power Consumption (W) Efficiency (%)
0 45 145 33 %
7.8 31 131 37 %
Peak Starting Torque Decrease (%)
Power Consumption Decrease (%)
Overall System Efficiency Increase (%)
% of Improvement 31 % 10 % 6 %
Table 3. Performance Improvement at Fixed Motor Speed (15 RPM)
Air Pressure Inside Pneumatic Cylinder (Bar) Starting Torque (N.m.) Power Consumption (W) Efficiency (%)
0 48 171 35 %
7.8 34 155 39 %
Peak Starting Torque Decrease (%)
Power Consumption Decrease (%)
Overall System Efficiency Increase (%)
[image:7.595.74.533.567.625.2]% of Improvement 29 % 9 % 6 %
Table 4. Performance Improvement at Fixed Motor Speed (17 RPM)
Air Pressure Inside Pneumatic Cylinder (Bar) Starting Torque (N.m.) Power Consumption (W) Efficiency (%)
0 52 201 33 %
7.8 45 178 39 %
Peak Starting Torque Decrease (%)
Power Consumption Decrease (%)
Overall System Efficiency Increase (%)
[image:7.595.81.536.650.708.2]of Improvement 13 % 6 % 18 %
Table 10. Performance Improvement at Fixed Motor Speed (20RPM)
Air Pressure Inside Pneumatic Cylinder (Bar) Starting Torque (N.m.) Power Consumption (W) Efficiency (%)
0 58 240 38 %
7.8 52 225 42 %
Peak Starting Torque Decrease (%)
Power Consumption Decrease (%)
Overall System Efficiency Increase (%)
[image:7.595.75.532.737.797.2]% of Improvement 7 % 6 % 11 %
Table 5 - Performance Improvement at Fixed Motor Speed (23 RPM)
Air Pressure Inside Pneumatic Cylinder (Bar) Starting Torque (N.m.) Power Consumption (W) Efficiency (%)
0 68 316 43 %
7.8 57 280 46 %
Peak Starting Torque Decrease (%)
Power Consumption Decrease (%)
Overall System Efficiency Increase (%)
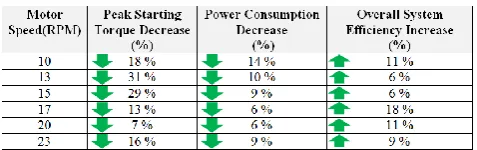
Table 12. System Enhancement at Different Speed
Table 7 shows the reciprocating pump performance improvement when running the pump with fixed motor speed (13 RPM), and while increasing the air pressure inside the pneumatic cylinder from zero bar to 7.8 bar. Table 8 shows the reciprocating pump performance improvement when running the pump with fixed motor speed (15 RPM), and while increasing the air pressure inside the pneumatic cylinder from zero bar to 7.8 bar. Table 9 shows the reciprocating pump performance improvement when running the pump with fixed motor speed (17 RPM), and while increasing the air pressure inside the pneumatic cylinder from zero bar to 7.8 bar. Table 10 shows the reciprocating pump performance improvement when running the pump with fixed motor speed (20 RPM), and while increasing the air pressure inside the pneumatic cylinder from zero bar to 7.8 bar. Table 11 shows the reciprocating pump performance improvement when running the pump with fixed motor speed (23 RPM), and while increasing the air pressure inside the pneumatic cylinder from zero bar to 7.8 bar. Increased air pressure inside the pneumatic cylinder simulates the reciprocating pump stiffness change that leads to decrease the reciprocating pump starting requirements such as starting torque and power consumption and increase the overall system performance and efficiency.
Conclusion
An approach was presented to simulate and model the reciprocating pump rod stiffness change through a pneumatic model which can help to decrease a reciprocating pump system starting requirements. This approach was done by adding a variable pressure pneumatic cylinder and examine its effect on the required reciprocating pump-starting requirement when changing air pressure inside the pneumatic cylinder.
By following this approach the starting requirements such as peak starting torque and power consumption can be decreased, overall system performance and efficiency can be increased. This approach proofed experimentally that the rod stiffness change has a great influence on the on reciprocating pump performance and can decrease the reciprocating pump starting requirements. Table 12 shows system enhancement at different speed. Simulating the reciprocating pump rod stiffness change through pneumatic cylinder can affect the starting requirements of the reciprocating pump such as the starting torque and the current. From the results above, the starting torque requirements were decreased by an average of 19 %, power consumption corresponding to the peak starting torque was decreased by an average of 9% and the overall system performance and efficiency were increased by an average of 10%.
REFERENCES
Czmerk, A.J. 2015. Increasing of Stiffness of Double-Acting Pneumatic Cylinder. Analecta Technica Szegedinensia,
9(1): p. 39-45
Dihovicni, D. and M. Medenica, 2011. Mathematical modeling and simulation of pneumatic systems, in Advances in Computer Science and Engineering, InTech.
Feng, H., et al. 2017. Modelling Study on Stiffness Characteristics of Hydraulic Cylinder under Multi-Factors. Strojniski Vestnik, Journal of Mechanical Engineering, 63. Firouzeh, A., M. Salerno, and J. Paik. 2015. Soft pneumatic
actuator with adjustable stiffness layers for multi-dof actuation. in Intelligent Robots and Systems (IROS), 2015 IEEE/RSJ International Conference on. 2015. IEEE. Rahmat, M., et al., 2011. Review onmodeling and controller
design in pneumatic actuator control System. International Journal on Smart Sensing & Intelligent Systems. 4(4). Shen, X. and M. Goldfarb, 2017. Simultaneous force and
stiffness control of a pneumatic actuator. Journal of Dynamic Systems, Measurement, and Control, 129(4): p. 425-434.
Tassa, Y., et al. 2013. Modeling and identification of pneumatic actuators. in Mechatronics and Automation (ICMA), IEEE International Conference on. 2013. IEEE.