Full Terms & Conditions of access and use can be found at
http://www.tandfonline.com/action/journalInformation?journalCode=cres20
ISSN: 0034-3404 (Print) 1360-0591 (Online) Journal homepage: http://www.tandfonline.com/loi/cres20
Relationship between income inequality and
residential segregation of socioeconomic groups
Tiit Tammaru, Szymon Marcin´czak, Raivo Aunap, Maarten van Ham &
Heleen Janssen
To cite this article: Tiit Tammaru, Szymon Marcin´czak, Raivo Aunap, Maarten van Ham & Heleen Janssen (2019): Relationship between income inequality and residential segregation of socioeconomic groups, Regional Studies, DOI: 10.1080/00343404.2018.1540035
To link to this article: https://doi.org/10.1080/00343404.2018.1540035
© 2019 The Author(s). Published by Informa UK Limited, trading as Taylor & Francis Group
Published online: 04 Jan 2019.
Submit your article to this journal
Article views: 5
Relationship between income inequality and residential
segregation of socioeconomic groups
Tiit Tammaru
a, Szymon Marcin
´czak
b, Raivo Aunap
c, Maarten van Ham
dand
Heleen Janssen
eABSTRACT
This paper provides new insights into the relationships between income inequality and residential segregation between socioeconomic groups by undertaking a comparative study of European urban regions. In Europe, income inequalities are the lowest in North Europe and the highest in South Europe. In many East European countries, a switch from low inequality to high inequality has taken place. The main findings show that changes in the levels of residential segregation between socioeconomic groups correlate to changes in the levels of income inequality found approximately 10 years earlier, that is, with a time lag.
KEYWORDS
income inequality; socioeconomic segregation; comparative urban studies; South Europe; North Europe; East Europe
JEL Z13
HISTORY Received 26 August 2017; in revised form 5 October 2018
INTRODUCTION
Residential segregation between socioeconomic groups in European urban regions has grown in the last decades (Fujita & Maloutas, 2016; Kazepov, 2005; Musterd & Ostendorf, 1998; Tammaru, Marcińczak, van Ham, & Musterd,2016). By residential segregation between socio-economic groups, we understand an uneven distribution of different occupational or income groups across residential neighbourhoods of an urban region. Income inequality, the uneven distribution of income between people and households, is often considered to be the most critical cat-alyst for residential segregation between socioeconomic groups (Musterd & Ostendorf, 1998; Quillian & Lagrange, 2016). The residential choices of the top
socioeconomic groups who earn the highest incomes often drive the rise of segregation in urban regions, as they have the most freedom to realize their housing and neighbourhood preferences that are either different or not achievable for other income groups (Harvey, 1985; Hul-chansky,2010; Maloutas,2016). Contrary to the top socio-economic groups, the bottom sociosocio-economic groups with the lowest incomes usually have less choice of where to live. In most European urban regions there is a substantial overlap between income inequality and inequality along ethnic lines since many immigrant groups are overrepre-sented in low-skilled jobs and associated low incomes. The marginalization and spatial concentration of lower income people, often with an ethnic minority background, signals deeply entrenched structural inequality on the
© 2019 The Author(s). Published by Informa UK Limited, trading as Taylor & Francis Group
This is an Open Access article distributed under the terms of the Creative Commons Attribution-NonCommercial-NoDerivatives License ( http://creativecommons.org/licenses/by-nc-nd/4.0/), which permits non-commercial re-use, distribution, and reproduction in any medium, provided the original work is properly cited, and is not altered, transformed, or built upon in any way.
CONTACT
a(Corresponding author) tiit.tammaru@ut.ee
Faculty of Science and Technology, Institute of Ecology and Earth Sciences, Department of Geography, University of Tartu, Tartu, Estonia; and Faculty of Architecture and the Built Environment, OTB–Research for the Built Environment, Delft University of Technology, Delft, the Netherlands. b
szymon.marcinczak@geo.uni.lodz.pl
Faculty of Science and Technology, Institute of Ecology and Earth Sciences, Department of Geography, University of Tartu, Tartu, Estonia; and Institute of Urban Geography and Tourism Studies, Faculty of Geography, University of Lodz, Lodz, Poland.
c raivo.aunap@ut.ee
Faculty of Science and Technology, Institute of Ecology and Earth Sciences, Department of Geography, University of Tartu, Tartu, Estonia. d m.vanham@tudelft.nl
Faculty of Architecture and the Built Environment, OTB–Research for the Built Environment, Delft University of Technology, Delft, the Netherlands; and School of Geography & Sustainable Development, University of St Andrews, St Andrews, UK.
e
H.J.Janssen@tudelft.nl
labour and housing markets (Malmberg, Andresson, & Östh,2013).
A recent European comparative study shows that simi-lar national levels of income inequality correspond with very different residential segregation levels between the top and bottom socioeconomic groups (for the definition of socioeconomic groups, see below) in European urban regions. The relationship between income inequality and socioeconomic segregation is complex and previous studies (e.g., Musterd, Marcińczak, van Ham, & Tammaru,2017; Tammaru et al.,2016) and we could not document a one-to-one relationship between the two since this relationship hinges on many factors. Since the 1980s, globalization, restructuring of labour markets and the liberalization of the economy have led to rising income inequality across the globe (Piketty, 2013; World Inequality Report, 2018). Previous studies have suggested that it takes time before a rise in income inequality leads to higher levels of socioeconomic segregation, and therefore it is needed to take into account time lags between changes in the two phenomena (Marcińczak et al., 2015; Musterd et al., 2017; Wessel,2016).
The aim of this paper is to obtain more insight into the relationship between income inequality and socioeconomic segregation. Although a large volume of studies exists on both income inequalities and residential segregation, their connection is poorly studied, especially in a comparative framework. This paper builds on Tammaru et al. (2016) who compared levels of socioeconomic segregation in 13 European urban regions in 2000 and 2010 and found an increase in segregation in all but one studied city. In this paper, we will explicitly study the link between income inequality and socioeconomic segregation by taking into account time lags between changes in income inequality and changes in segregation between the top and bottom socioeconomic groups. In order to do this, we use a longer time frame measuring income inequality since 1980 and socioeconomic segregation from 1990. We focus the ana-lyses on the urban regions located in North, South and East Europe. The North European countries represent the lowest levels of income inequality in Europe; the South European countries represent the highest levels of income inequality in Europe; and many East European counties, including Estonia and Hungary, have switched from the most equal to most unequal countries in Europe (Statistical Office of the European Communities (EURO-STAT),2018).
We seek answers to three central research questions:
. What are the differences in socioeconomic segregation in North, South and East Europe?
. Is there a relationship between the change of socioeco-nomic segregation and change in income inequality 10 years earlier?
. Are there variations in the relationship between income inequality and socioeconomic segregation in North, South and East Europe with different income inequality contexts?
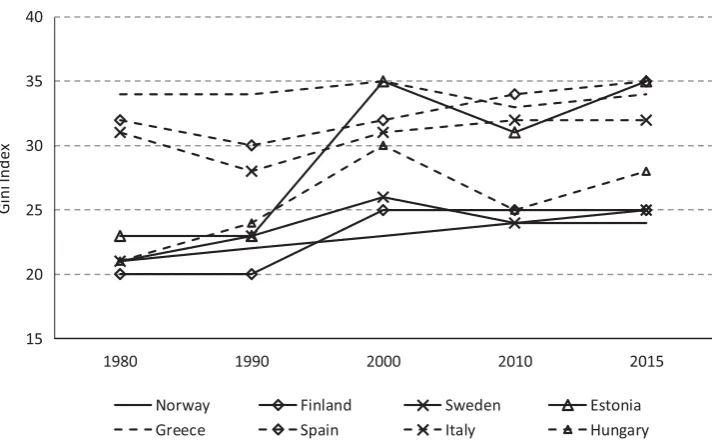
We start the study with the analysis of changes in the Gini index of the countries included since 1980. We then analyze the levels of residential segregation between the top and bottom socioeconomic groups measured by the dissimilarity index at the 1990, 2000 and 2010 census rounds. Finally, we will explore the relationship between the Gini index and the dissimilarity index to obtain more insight into the relationship between income inequality and residential segregation between the top and bottom socioeconomic groups.
The empirical evidence comes from the urban regions of Helsinki (Finland), Oslo (Norway), Stockholm (Swe-den) in the North of Europe; from Athens (Greece), Madrid (Spain) and Milan (Italy) in the South of Europe; and from Tallinn (Estonia) and Budapest (Hungary) from the East of Europe. Although the data for the empirical study is[ simple, on the one hand, arranging a spatially detailed and comparable data set for a broad set of urban regions from different parts of Europe was a significant challenge and a possible explanation for the fact that very few comparative studies exist so far.
MECHANISMS THAT RELATED INCOME
INEQUALITY AND SOCIOECONOMIC
SEGREGATION
Fundamentally, the most critical cause of residential segre-gation between socioeconomic groups is income inequality (Nightingale, 2012; Préteceille, 2016). The income inequality started to grow globally during the 1980s (World Inequality Report, 2018; Piketty, 2013; Sachs, 2012) together with rapid globalization, economic liberal-ization, marketization and deindustrialization that, com-bined, shape today’s social relations and spatial structures (Marcuse & Van Kempen,2000; Tammaru et al.,2016). The levels of income inequality were already high in South Europe in 1980, with the Gini index ranging between 30 and 35 in Greece, Italy and Spain in 1980 (Figure 1). The Gini indices were the lowest, around 20, in North Europe and in the formerly socialist countries in East Europe in 1980. In international comparison, the Nordic countries were relatively equal societies and wealthy, while the formerly socialist countries in the East of Europe were relatively equal but poor (Kornai,1992).
changes in the Gini indices took place in the 1990s, allow-ing it to be analyzed whether this was followed by a rise in residential segregation between top and bottom socioeco-nomic groups a decade later in the 2000s.
In short, the case study countries provide an interesting mix of income inequality contexts in Europe for analyzing how income inequality may be related to socioeconomic segregation. Although residential segregation between socioeconomic groups is fundamentally related to income inequality, there are several underlying spatial mechanisms that can connect the two: (1) changes in household numbers that affect the distribution of top and bottom socioeconomic groups over the neighbourhoods (population shrinkage or growth, natural change, immigration); (2) residential mobi-lity within the urban regions (people changing residential neighbourhood because their incomes increase or decrease); and (3) the geography of housing and its differentiation, attracting, forcing or constraining the residential mobility of households. The interplay between these factors is com-plicated, and it takes time, therefore, before a change in the level of income inequality results in changes to the level of residential segregation between the top and bottom socioeconomic groups. Next, the paper will discuss the three mechanisms in greater detail.
Differential change in household numbers across neighbourhoods
Changes in household numbers affect the distribution of top and bottom socioeconomic groups over the neighbour-hoods. The extent of immigration is the most important contributory factor here. The transition from a Fordist to a post-Fordist economy and social mobility through edu-cation brought along the professionalization of, usually, the native workforce not only in global cities (Sassen, 1991) but also in other major cities (Costa & de Valk, 2018; Marcuse & van Kempen, 2002). The employer demand for low-skilled workers remained as the (low-paid) service sector developed and the number of foreign
immigrants – getting overrepresented in those low-skilled/low-paid jobs–started to grow in both North and South Europe in the 1990s (Castles, de Haas, & Miller, 2013). Although the ethnic dimensions of income inequal-ity have been present in Western Europe with the arrival of guest workers since the 1950s, the professionalization of the native workforce and the residualization of low-skilled jobs to immigrants reinforced the ethnic component of economic inequality (Sassen, 1991), especially in those countries that experienced the second wave of international migrants that started in the 1990s (Castles et al.,2013).
As the incomes of immigrants are, on average, lower compared with natives (EUROSTAT,2018), their neigh-bourhood choice is restricted by various constraints such as their lower purchasing power on the housing market, limited number and clustered location of affordable housing in cer-tain parts of the urban region (Arbaci & Malheiros,2010; Hulchansky,2010; Malheiros,2002). The social mix policies that are in place in many European countries have not always been able to stop the growth of levels of residential segre-gation for various reasons, including ineffective implemen-tation of the policies, failures in policy design or because of conflicting policy aims (Andersson, Bråmå, & Holmqvist, 2010). In this light, Andersson and Kährik (2016) refer to
‘eth-class’segregation, a process of double sorting of non-Western immigrants to low-paid jobs and less prestigious neighbourhoods with affordable housing, and natives to high-paid jobs and more prestigious neighbourhoods.
[image:4.595.120.479.87.309.2]Since residential segregation of ethnic groups is driven by income, by preferences to reside together with co-eth-nic, and discrimination, segregation in urban regions with a high share of immigrants can grow more rapidly than income inequality itself (Préteceille, 2016). In short, changes in the population composition of neighbourhoods as a result of foreign immigration and immigrant sorting into low-paid jobs and affordable housing, in particular, are among the primary causes of increased residential seg-regation between socioeconomic groups (Arbaci, 2007;
Cassiers & Kesteloot,2012; Musterd et al.,2017). How-ever, other factors may be important as well, for example, the differential fertility of different ethnic and income groups (Finney & Simpson,2009).
Differential residential mobility of socioeconomic groups
Levels of segregation may also change as a result of the differential residential mobility of top and bottom socioeco-nomic groups between urban neighbourhoods. In parallel to growing income inequalities, the share of the top socioeco-nomic groups has increased in many European cities (Butler, Hamnett, & Ramsden,2008; Hamnett,1994). Since money buys choice on the housing market (Hulchansky,2010), the residential mobility of high-income earners affects both the level and the geography of segregation. The increasing demand for higher end housing has led to stark increases of land and housing prices in desirable areas (Préteceille, 2016), and spill over effects to formerly low-income neigh-bourhoods, pushing up house prices there (Leal & Sorando, 2016). These areas are often adjacent to the already existing high-income neighbourhoods (Préteceille,2007). However, the most important macro-geographical change in the distri-bution of socioeconomic groups pertains to the movement of high-income households to the central areas of the city or gentrification of the inner-city neighbourhoods, and the movement of low-income households to the urban margins or suburbanization of poverty (Hochstenbach & Musterd, 2018).
Such changes in the residential relocation of the top and bottom socioeconomic groups will bring along mixing of different income groups in urban neighbourhoods (Mar-cińczak, Musterd, van Ham, & Tammaru,2016; Musterd & van Gent,2016). The segregation paradox refers to this inverse relationship between income inequality and resi-dential segregation: increasing income inequality may bring along lowering levels of residential segregation between socioeconomic groups (Sýkora, 2009). However, ultimately such differential residential mobility patterns of top and bottom socioeconomic groups will lead to higher levels of segregation, for example, when high-income groups colonize the inner city (Leal & Sorando, 2016), and lower income groups retreat to urban fringe, often to the modernist housing estates built in the 1960s–80s (Kavanagh, Lee, & Pryce, 2016; Lelévrier & Melic, 2018; Musterd et al.,2017).
Uneven geography of housing
The geography of housing is an essential factor that attracts, forces or constrains people with different income levels to undertake residential change. Both the extent and speed with which selective residential mobility of top and bottom socioeconomic groups leads to changes in the levels of residential segregation hinges, first, on how uneven is the geography of housing, or how the urban neighbourhoods are planned in terms of their housing mix (Fujita & Maloutas, 2016; Préteceille, 2016). The more spatially clustered the low-cost housing is, the more likely it is that low-income households with little choice
in terms of housing sort into those neighbourhoods, contri-buting to the rise of the level of residential segregation (Marcińczak et al., 2016). In many North, South and East European urban regions, affordable housing can often be found in the modernist housing estates from the 1960s–70s (Hess et al., 2018). Sweden became world famous with its so-called ‘Million Programme’: the con-struction of modernist houses took place on large suburban plots of land, filling them with homogenous housing (Andersson & Bråmå, 2018). Today, the attraction of many of the modernist housing estates has decreased as new and more attractive housing for higher income groups has become available (Andersson & Bråmå,2018; Wassen-berg,2013).
However, the fortunes of the neighbourhoods may also change with time. According to rent-gap theory (Smith, 1987), the movement of high-income groups to the inner city may be related to the interests of the investor seeking higher profits. Namely, the expected higher profits for attracting high-income earners to low-income neighbour-hoods could be attractive for investors, leading to the reno-vation and new housing construction in such areas. The housing allocation matters, too. If social housing is spatially clustered but available to all income groups, segregation levels change slower. However, what has happened in many European urban regions is a process called the resi-dualization of social housing: market elements have been introduced to better quality social housing, often to balance city budgets (Urban,2018). The contraction of the social housing segment, in turn, brings along the need to grant access to such housing mainly to the low-income house-holds, driving up levels of segregation, especially when the residualized part of the social housing is spatially con-centrated to certain parts of the city (Hochstenbach, 2017; Hoekstra,2017).
To conclude, although the most important cause for the increase in residential segregation between socioeconomic groups is an increase in income inequality, there is no one-to-one relationship between the two. The spatial mechanisms that link the two relate to changes in the population in urban neighbourhoods, the differential resi-dential mobility of socioeconomic groups and the nature and change of the urban housing stock. These mechanisms take time to show up in changed levels of segregation. Therefore, we will test the hypothesis that income inequal-ity is related to socioeconomic segregation with a time lag in the empirical parts of the paper. By examining the lagged relationship between income inequality and socioeconomic segregation, we hope to document better the relationship between the two compared with previous studies (e.g., Musterd et al.,2017; Tammaru et al.,2016) that measure them at the same time.
DATA AND METHODS
The data on the levels of segregation were systematically collected and provided by researchers from each urban region under study–partly within the book project‘ Socio-economic Segregation in European Capital Cities’ (Tam-maru et al., 2016) and partly specifically for the current paper. (We greatly acknowledge the support of all the country teams, without whom this paper would not be possible.) Despite some minor inconsistencies across time and between countries, census years provide the most reliable information on socioeconomic segregation across Europe. Data for Athens, Budapest, Madrid, Milan and Tallinn are based on censuses. Data on Helsinki, Oslo and Stockholm are based on registers. All case study areas are defined as urban regions since residential segre-gation processes evolve at the level of regional housing mar-kets (cf. Tammaru et al.,2016). The census data used do not include data on income, and the register data used do not include information on occupations.
Although both censuses and registers contain infor-mation about education, education is only weakly related
to income, while there is a strong correlation between occu-pation and income (Tammaru et al., 2016). Hence, we measure socioeconomic status using occupational groups in census-based countries and data on income in register-based countries. A note of caution relates to the use of these different variables. An increase in income inequality could in itself increase levels of residential segregation when measured by income. This should not affect segre-gation measured by using occupational categories, because in this case although professionals earn more and unskilled workers earn less, if all continue to live in the same neigh-bourhoods, the dissimilarity index does not change. There-fore, rising levels of income inequality might lead to different outcomes in cities where residential segregation is measured by income compared with cities where occu-pational status is used.
Top and bottom socioeconomic groups are defined as follows. In register-based countries (Finland, Norway, Sweden) we use income quintiles and show levels of segre-gation between people belonging to the first and fifth
Table 1.Spatial units used in the study.
City Spatial characteristics used in the studya
Athens About 3.1 million inhabitants lived in the Athens Urban Region in 2011, comprising 58 municipalities on the continental part of the Attiki region. The neighbourhood definition is based on 2.835 urban analysis units (URANU), which are either individual census tracts or groups of census tracts with an average of 1.200 residents. Census tracts are defined by the Greek Statistical Authority (ELSTAT), while the regrouping in URANUs was produced by the project
‘Dynamic Management and Mapping of Social Data’conducted by the National Centre for Social Research (EKKE) Budapest About 1.7 million people lived in Budapest in 2011. Budapest is divided into 1600 discrete territorial units on the
basis of functional and morphological attributes with an average of about 1000 inhabitants
Helsinki About 1.5 million inhabitants lived in the Helsinki Metropolitan Region in 2011. The definition of neighbourhoods is based on zip code areas. There are 303 zip code areas in Helsinki with an average population size of 4865 people Madrid About 6.4 million inhabitants lived in the Madrid Urban Region in 2011. The neighbourhood definition is based on
groupings of census tracts since the Census of Population and Housing of 2011 is not representative at a more disaggregated territorial level. Usually, the Spanish Statistical Offices provides data for neighbourhoods with an average size of 20,000. However, it is possible to obtain more detailed data depending on the exact data needed for research. The data asked for the comparative segregation study needed data by International Standard Classification of Occupations (ISCO) which allowed tract groupings with an average of 12,252 residents to be created
Milan About 1.2 million people lived in the city of Milan and 3.0 million in the province of Milan in 2011. With regard to the spatial units, census tracts, census areas (ACE), districts (circoscrizioni), administrative districts (zone di
decentramento) are available. The average number of people is 219 in census tracts and 14,778 in ACE areas. The
findings of trends yield similar results; neighbourhoods units used in thefinal analysis were census tracts
Oslo About 1.2 million lived in the Oslo Region in 2011. The neighbourhood definition is based on census tracts with an average population of 594 inhabitants
Stockholm About 1.2 million people lived in the Stockholm built-up area in 2011. The neighbourhood definition is based on small area market statistics (SAMS) areas. The study includes 655 neighbourhoods with the average size of 2100 people
Tallinn About 0.5 million inhabitants live in Tallinn urban region. The neighbourhood definition is based on census tracts with an average population of 494 inhabitants
Note:aWe define cities as a continuous built-up area that forms a common housing market. In other words, the analysis is not confined to administrative city boundaries. However, within this broad definition of a common housing market area, authors of different city reports inSocioeconomic Segregation in European Capital Cities: East Meets West(Tammaru, Marcin´czak, van Ham, & Musterd,2016) adapted it to their specific context. We rely on this local expert knowledge in the concrete definition of the city regions.
income quintiles. In census-based countries (Estonia, Greece, Hungary, Italy, Spain), we rely on the Inter-national Standard Classification of Occupations (ISCO). The ISCO classification refers to those employed at the time of the census. The top socioeconomic group refers to managers and the bottom socioeconomic group to people working in elementary occupations. In Milan, the definitions differ somewhat from the ISCO, but we still use the highest and lowest ranked occupational categories in the analysis. From here on, we will use the terms top and bottom socioeconomic groups or high- and low-income groups interchangeably to denote them. To facili-tate comparison, we rely on the data aggregated to small spatial units as available in the data (Table 1).
Comparative research faces several challenges when it comes to the data on spatial units. Different countries have different data policies when it comes to releasing data for small geographical areas and use different aggregation levels of either socio-economic groups or spatial units/neigh-bourhoods. These obstacles are beyond our control, but we aimed at a high level of comparability and analytical detail within these two sets of limits. We are aware that our research materials on the levels of segregation have some limitations stemming from the different classification of socioeconomic groups and different spatial units. We acknowledge that the levels of segregation might not be directly comparable between the case study urban regions, not to the same extent as in one national context since every country has its own methods for delineating the spatial units of the city. Nonetheless, even if the cross-city compari-sons might be moderately biased, we believe that the data at hand are adequate to investigate the relationship between income inequality and segregation in each case city, which is the primary focus of this paper (Table 1).
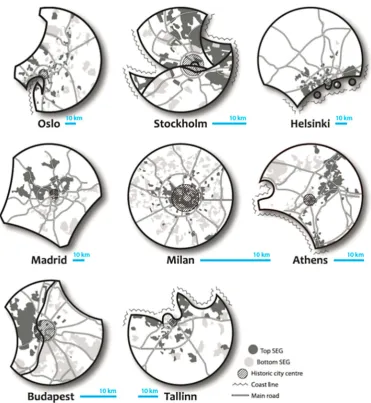
Although new methods have been proposed to investi-gate both the global and local patterns of segregation (Johnston, Poulsen, & Forrest, 2010; Marcińczak et al., 2015), this study uses the easily comparable dissimilarity index. The analyses consist of two steps. Thefirst analyzes changes in the levels of socioeconomic segregation between 1989/1990/1991, 2000/2001 and 2010/2011 by means of the dissimilarity index (D) between the top and bottom socioeconomic groups–depending on the data availability, the groups are represented either by the top and bottom quintiles or by managers and people employed in elemen-tary occupations. TheD-values range from 0 to 100, indi-cating the percentage of the group members that need to move to another neighbourhood in order to achieve an even residential distribution to the reference group. Mar-cińczak et al. (2015) suggest that D-values < 20 can be interpreted as low and those > 40 can be interpreted as high levels of segregation. To add detail to theD-values, we will also analyze differences in the geography of socio-economic segregation by drawing stylized maps that por-tray the main patterns of the spatial distribution of the top and bottom socioeconomic groups in each of the case study city.
In the second step, we depict the changes ofD-values and Gini indices (G) graphically to understand the
relationship between social inequalities and socioeconomic segregation better. We use the standard Gini index avail-able at EUROSTAT (2018) that characterizes how much the country’s wealth distribution deviates from an entirely equal wealth distribution and, when expressed in percen-tages, 0 indicating complete equality and 100 indicating complete inequality. The Gini index is not available at the city level and is measured at the national level. How-ever, the focus of this study is on the change of income inequality and change in residential segregation that diminishes the problem somewhat. In general, the level of income inequality in capital cities’urban regions is (sig-nificantly) higher than the national average (City Monitor, 2018), which means that the increase of income inequality may be higher in the case study urban regions than revealed in the Gini index. We keep this problem in mind when interpreting the findings. Since (1) the rise of social inequalities comes first, followed by the rise in socioeco-nomic segregation, and (2) the level of segregation can be measured only for census years, we use lagged G-values for 10 years in the analysis. In other words, we match the
D-values from 1989/1990/1991, 2000/2001 and 2010/ 2011 with theG-values from 1980, 1990 and 2000.
RESULTS
Changes in segregation in each case study city
Levels of socioeconomic segregation are not directly com-parable between the case study cities because of somewhat different spatial units and different definitions of socioeco-nomic group. Figure 2 summarizes changes in socioeco-nomic segregation in each city. In 1989/1990/1991, D -values ranged between 22 and 27 in northern and eastern European urban regions and between 39 and 46 in southern European urban regions. The speed and trajectory of change in segregation varies significantly between cities and between the three census rounds. Tallinn and Stock-holm show a very rapid rise in residential segregation between the top and bottom socioeconomic groups between the last two census rounds, and segregation has also risen in Helsinki and Oslo in that period. In Athens, Budapest, Madrid and Milan, the levels of segregation decreased between 1990/1991 and 2000/2001 census rounds, followed by an increase between 2000/2001 and 2010/2011 census rounds. In Madrid, the rise in segre-gation was especially rapid between 2000/2001 and 2010/ 2011 with a considerably higher D-value in 2010/2011 than in 1990/1991. In Athens and Milan, the 2010/2011
D-value is lower than in 1990/1991.
neighbourhoods of Brera, Sempione and Guastalla. This housing-wise heterogeneous zone was the main playground for the post-Second World War rapid processes of urbaniz-ation and industrializurbaniz-ation of Milan, providing shelter to the working class and immigrants.
The high-income groups are also overrepresented in the city centre of Madrid, in districts such as Centro, Salamanca and Tetuán (Figure 3). The growth of young professionals has been rapid in those historical central neighbourhoods that are undergoing regeneration and gentrification, and the process resembles the colonization of most central parts of the city by high-income groups (Leal & Sorando, 2016). Likewise, wealthier suburban low-density neighbour-hoods are mostly located in the north-western parts of the metropolitan Madrid. The southern parts became subject to large-scale urbanization and industrialization similar to Milan in the post-war decades in Madrid, now housing the working class and immigrants.
Like Madrid, Athens lacks concentric urban zones that characterize Milan, but the wealthier neighbourhoods such as Chalandri, Amarousio and Kifista are located outside the urban core, in the eastern part of the urban region (Figure 3). As the share of high-income groups has expanded, they have spilled over into adjacent areas, rather than contributing to the gentrification of the city centre (Maloutas,2016). The city centre of Athens is socioecono-mically mixed, partly because of vertical rather than horizon-tal patterns of socioeconomic segregation, a phenomenon that developed fully with the increase of foreign immigrants in the 1990s who often found a residence in the downgrad-ing private rental sector (Maloutas & Karadimitriou,2001). Especially, the densification of housing in the central parts of the city has left apartments on the lowerfloors suffering from both a lack of light and noise. Hence, lower income groups tend to live on the lowerfloors while higher income groups tend to live on the upperfloors (Maloutas,2016). The wes-tern part of the urban region has a working-class nature, where lower income groups are overrepresented.
Similarly to Athens, the higher income groups are over-represented in the suburban neighbourhoods in Stock-holm, mainly in the north-east parts of the urban region such as Danderyd, Lidingö and Täby (Figure 3). The dis-tinctive feature of Stockholm relates to the large spatially clustered modernist housing estates built between 1950 and 1970 (Andersson & Kährik,2016). Substantial gration to Sweden has occurred since the 1990s, and immi-grants are strongly overrepresented in those housing estates mainly located in the south-western part of the suburban ring, contributing to the increase of segregation. Neither Helsinki nor Oslo have such vast and spatially concentrated modernist housing estates (Figure 3). However, immi-grants and lower income groups do cluster to this housing segment located on the eastern side of the metro areas in those two urban regions (Kauppinen, 2017; Wessel, 2016). Higher income groups are overrepresented in wes-tern parts in Oslo, expanding from around the royal castle, and on the southern waterfront areas in Helsinki.
The physical geography of the case study urban regions, in combination with the planning zoning regulations implemented in the 19th century, primarily determine the spatial pattern of residential segregation of Budapest by allowing a natural residential separation between the top and bottom socioeconomic groups (Kovács & Szabó, 2016). The first is actively clustered to the villa areas on the Buda hills on the western bank of the River Danube, while the latter are clustered on the eastern side of the river in Pest (Figure 3). The clustering of bottom socioeco-nomic groups is the highest in south-eastern industrial parts of Budapest where sizeable modernist housing estates, as well as the less attractive detached housing areas, can be found. The inner city of Budapest is socioeco-nomically mixed as a result of the gentrification processes that has occurred in the last decades.
[image:8.595.127.472.91.298.2]In Tallinn, the top socioeconomic groups are increasingly overrepresented along the coastline of the urban region, both in the city centre as well as in the lower density suburban areas
of Kakumäe-Tiskre in the east and Pirita-Viimsi in the west. Gentrifying inner-city neighbourhoods are more socioeco-nomically mixed, with increasing concentrations of high-income groups in some of them. Tallinn’s modernist housing areas are spatially concentrated to certain locations around the inner city, and the bottom socioeconomic groups are increasingly clustering in them as in Stockholm.
Relationship between income inequality and socioeconomic segregation
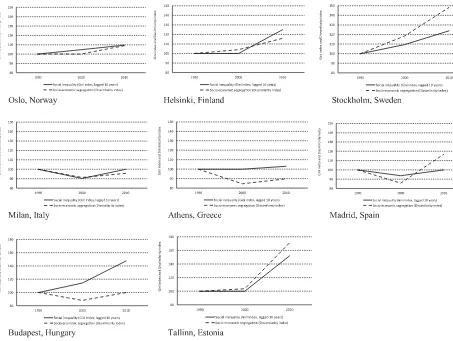
Since changes in socioeconomic segregation tend to follow changes in income inequalities with a time lag, we will next compare the dissimilarity index (D) with a 10-year lagged Gini index (G). The most general impression we obtain fromFigure 4is a strong correlation between the changes of the two indices. In Oslo, the time lag is the greatest, or 20 years. In other urban regions of northern Europe, an increase in income inequality has led to an increase in socioeconomic segregation 10 years later. In Stockholm, the growth ofDis more rapid than the growth ofGten years earlier. This might be due to many reasons: the rise of income inequality in Stockholm may have been more
significant than the national average in Sweden, and both differential housing marketization and immigration of non-Western immigrants have been unusually extensive in Sweden (Andersson & Kährik, 2016; Marcińczak et al.,2016). In all three urban regions, immigrants tend to be overrepresented in the modernist housing estates where the most affordable housing is available.
[image:9.595.111.483.89.493.2]Income inequality and socioeconomic segregation also correlate in South European urban regions, but the trajec-tory of change is different than in North European urban regions. In Madrid and Milan, income inequality decreased in the 1980s, and we find that the residential segregation between the top and bottom socioeconomic groups also decreased a decade later, in the 1990s. Residential segre-gation also decreased in Athens in the 1990s, although the level of income inequality stayed almost unchanged in the 1980s. In addition to income inequalities, the social mobility of a young generation without spatial mobility– very common in South Europe as children stay with their parents for 10 years longer than in North Europe (EURO-STAT,2018)–can explain the reduction in the levels of residential segregation (cf. Maloutas, 2016). Similar
tendencies can be found in Milan a decade later. In Madrid, the situation is the opposite and, like in Stock-holm, residential segregation between the top and bottom socioeconomic groups grew more rapidly in the 2000s than would have been predicted from the rise of income inequality a decade earlier. A plausible explanation pertains to the boom of new housing construction in the 2000s (property bubble) that created spatially uneven opportu-nities for higher income groups to improve their living con-ditions (cf. Gutiérrez & Domènech, 2017; Leal & Sorando,2016). And like with Stockholm, it may be that the income inequalities in the Madrid urban region may have grown more rapidly than the national average.
In Budapest, changes in income inequality and socioe-conomic segregation are similar to Athens, but more pro-nounced. The differential marketization of housing in Hungary started already in the 1980s (Kovács & Szabó, 2016), earlier than in Estonia, but it led to lower levels of socioeconomic segregation in the 1990s. Thus, Budapest is an excellent example of the segregation paradox: as the top socioeconomic groups move to low-income neighbour-hoods, socioeconomic segregation lowered at times of growing income inequalities. Lowering of segregation was a temporary phenomenon, and the continued growth of income inequalities in the 1990s led to higher levels of segregation in Budapest a decade later, in the 2000s. In Tallinn, the combination of post-Soviet economic growth and very low levels of socioeconomic segregation in the
1980s increased income inequalities rapidly in the 1990s, followed by a rapid increase in socioeconomic segre-gation 10 years later, in the 2000s.
DISCUSSION AND CONCLUSIONS
This paper has focused on the relationship between income inequality and residential segregation between the top and bottom socioeconomic groups by undertaking a compara-tive study of North, South and East European urban regions. Socioeconomic segregation hinges strongly on income inequality (Nightingale, 2012; Préteceille, 2016). However, there is no one-to-one relationship between the two since several mechanisms, such as changes in the population in urban neighbourhoods, the differential resi-dential mobility of socioeconomic groups, and the nature and change of the urban housing stock, may intervene. Therefore, we expected tofind a time lag between changes in income inequality and residential segregation between socioeconomic groups. This hypothesis was confirmed and wefind that there is roughly a decade between change in income inequality and change in residential segregation between the top and bottom socioeconomic groups.
[image:10.595.63.516.88.429.2]The relationship between income inequality and resi-dential segregation holds both when income inequalities increase and decrease. In North Europe, income inequalities increased, although moderately, from 1980 to 2000, fol-lowed by an increase in residential segregation between the
top and bottom socioeconomic groups in the 1990s and 2000s. In South Europe, income inequalities decreased in the 1980s and increased in the 1990s, followed by a decrease in residential segregation in the 1990s and an increase in the 2000s. In East Europe, income inequalities increased in both the 1980s and 1990s, but residential segregation decreased in Budapest in the 1990s, followed by an increase in the 2000s. The temporary lowering of segregation levels in Budapest, when income inequalities increased, can be explained by using the segregation paradox: as high-income households move into low-income neighbourhoods, tem-porary mixing of socioeconomic groups may occur (Kovács & Szabó,2016). Although similar mechanisms operate in other cities, we did not detect clear evidence of this paradox elsewhere. However, the same phenomenon was previously observed in Amsterdam (Musterd & van Gent, 2016). Despite differences in the time lags in different cities, the mainfinding still holds: a change in residential segregation follows a change in income inequality.
If residential segregation is seen as a problem, it is thus important to deal with income inequalities. The case study countries come from Europe where, in a global perspective, income inequalities are low with Gini indices ≤ 35. According to the World Bank’s (2018) estimates on income inequality, in most countries outside Europe, Gini indices are > 35. Levels of residential segregation are also higher in most other world regions compared with Europe (Tammaru et al.,2016). Hence, our finding that residential segregation between the top and bottom socioeconomic groups can decrease as income inequalities decrease is most likely of broader relevance for large urban regions around the globe. However, we also need similar analyses for urban regions outside Europe and get-ting comparable data is a challenge. Since most countries outside Europe are census based rather than register based, occupational groups could be used as a measure of socioeconomic status. Furthermore, since occupational sta-tus reflects in housing outcomes, novel geographical infor-mation system (GIS)-based methodologies for studying segregation between socioeconomic groups (Fung-Loy & Van Rompaey, 2017) may serve as a useful proxy and help one to understand better the relations between income inequality and residential segregation also in the developing countries of the Global South.
For the relationship between changes in income inequality and residential segregation between the top and bottom socioeconomic groups to emerge, at least one of the three intervening mechanisms – changes in the population in urban neighbourhoods, the differential resi-dential mobility of socioeconomic groups, and the nature and change of the urban housing stock–needs to operate. In this study, we established that change in income inequality affects residential segregation, but the data at hand do not one allow to examine the role of different mechanisms. Hence, future comparative studies are needed that focus on the underlying mechanisms, which in turn would also help one to understand the determinants of the time lag between change in income inequality and change in residential segregation. For example, in Budapest
and Oslo, the time lag was greater than in other case study urban regions. In Budapest, segregation paradox is a plaus-ible explanation. In Oslo, Wessel (2016, p. 152) explains that it may take years before redistributive changes affect the structure of market signals, and when these signals arefirmly expressed, there is still a time lag before residen-tial replacements and accretions appear.
To conclude: this paper documents that change in income inequality and change in residential segregation between socioeconomic are related to each other once we introduce a time lag into the analysis: income inequalities change first, followed by a change in residential segre-gation. This is a significant advancement compared with previous studies (e.g., Musterd et al., 2017; Tammaru et al.,2016) that were not able to document that the two processes are related. However, more studies are needed in different country and urban region contexts, also keeping an eye on the mechanisms that relate change in income inequality to change in residential segregation between socioeconomic groups.
ACKNOWLEDGMENTS
The authors are very grateful to their colleagues from Esto-nia (Anneli Kährik, Kadri Leetmaa), Finland (Timo Kaup-pinen), Greece (Thomas Maloutas), Hungary (Zoltan Kovács), Italy (Petros Petsimeris and Stefania Rimoldi), Norway (Terje Wessel), Sweden (Roger Andersson), and Spain (Jesus Leal and Daniel Sorrando) for cooperation within the book project ‘Socioeconomic Segregation in European Capital Cities’and beyond, and for calculating the dissimilarity indices for their urban regions.
DISCLOSURE STATEMENT
No potential conflict of interest was reported by the authors.
FUNDING
The research leading to these results received funding from the Estonian Research Council [Institutional Research grant numbers PUT PRG306 and IUT2-17, projects Info-technological Mobility Laboratory and RITA-Ränne]; and the European Research Council under the European Union’s Seventh Framework Programme (FP/2007-2013)/ERC [grant agreement number 615159] (ERC Consolidator Grant DEPRIVEDHOODS, Socio-Spatial Inequality, Deprived Neighbourhoods, and Neighbour-hood Effects).
ORCID
Tiit Tammaru http://orcid.org/0000-0003-1590-1269
Szymon Marcin´czak http://orcid.org/0000-0001-5548-5816
REFERENCES
Andersson, R., & Bråmå, A. (2018). Large housing estates in Stockholm– Do initial conditions matter? In D. B. Hess, T. Tammaru, & M. van Ham (Eds.), Large housing estates in Europe: Poverty, ethnic segregation, and policy challenges. London: Springer.
Andersson, R., Bråmå, Å, & Holmqvist, E. (2010). Counteracting segregation: Swedish policies and experiences.Housing Studies, 25(2), 237–256.doi:10.1080/02673030903561859
Andersson, R., & Kährik, A. (2016). Widening gaps: Segregation dynamics during two decades of economic and institutional change in Stockholm. In T. Tammaru, S. Marcińczak, M. van Ham, & S. Musterd (Eds.), Socioeconomic segregation in European capital cities: East meets West(pp. 110–131). London: Routledge.
Arbaci, S. (2007). Ethnic segregation, housing systems and welfare regimes in Europe. European Journal of Housing Policy, 7(4), 401–433.doi:10.1080/14616710701650443
Arbaci, S., & Malheiros, J. (2010). De-segregation, peripheralisation and the social exclusion of immigrants: Southern European cities in the 1990s.Journal of Ethnic and Migration Studies,36(2), 227– 255.doi:10.1080/13691830903387378
Butler, T., Hamnett, C., & Ramsden, M. (2008). Inward and upward: Marking out social class change in London, 1981– 2001. Urban Studies, 45(2), 67–88. doi:10.1177/ 0042098007085102
Cassiers, T., & Kesteloot, C. (2012). Socio-spatial inequalities and social cohesion in European cities.Urban Studies,49(9), 1909– 1924.doi:10.1177/0042098012444888
Castles, S., de Haas, H., & Miller, M. J. (2013).The age of migration. International population movements in the modern world(5th ed.). New York: Palgrave Macmillan.
City Monitor. (2018). Data on UK urban regions. Retrieved from http://www.centreforcities.org/reader/cities-outlook-2017/city-monitor-latest-data/#table-13-gini-coefficient
Costa, R., & de Valk, H. A. G. (2018). Ethnic and socioeconomic segregation in Belgium: A multiscalar approach using individua-lised neighbourhoods. European Journal of Population, 34(2), 225–250.doi:10.1007/s10680-018-9480-6
Finney, N., & Simpson, L. (2009). Population dynamics: The roles of natural change and migration in producing the ethnic mosaic. Journal of Ethnic and Migration Studies, 35(9), 1479–1496. doi:10.1080/13691830903125935
Fujita, K., & Maloutas, T. (Eds.). (2016).Residential segregation in comparative perspective: Making sense of contextual diversity. London: Routledge.
Fung-Loy, K. S., & Van Rompaey, A. (2017).Detection and simu-lation of urban sprawl and social segregation in Paramaribo, Suriname (1987–2030). Presentation at the 7th Belgian Geography Day, University of Liege, Liege, Belgium, November 17, 2017.
Gutiérrez, A., & Domènech, A. (2017). Spanish mortgage crisis and accumulation of foreclosed housing by SAREB: A geographical approach. Journal of Maps, 13, 130–137. doi:10.1080/ 17445647.2017.1407271
Hamnett, C. (1994). Socioeconomic change in London: Professionalization not polarization. Built Environment, 20(3), 192–203.
Harvey, D. (1985). The urbanisation of capital. Baltimore: Johns Hopkins University Press.
Hochstenbach, C. (2017). State-led gentrification and the changing geography of market-oriented housing policies.Housing, Theory and Society,34(4), 399–419.doi:10.1080/14036096.2016.1271825 Hochstenbach, C., & Musterd, S. (2018). Gentrification and the sub-urbanization of poverty: Changing urban geographies through
boom and bust periods.Urban Geography,39(1), 26–53.doi:10. 1080/02723638.2016.1276718
Hoekstra, J. (2017). Reregulation and residualization in Dutch social housing: A critical evaluation of new policies. Critical Housing Analysis,4(1), 31–39.doi:10.13060/23362839.2017.4.1.322 Hulchansky, D. (2010).The three cities in Toronto: Income polarization
among Toronto’s neighbourhoods, 1970–2005. Toronto: University of Toronto.
Johnston, R., Poulsen, M., & Forrest, J. (2010). Moving on from indi-ces, refocusing on mix: On measuring and understanding ethnic patterns of residential segregation.Journal of Ethnic and Migration Studies,36(4), 697–706.doi:10.1080/13691830903505045 Kauppinen, T. (2017).Data brief on segregation of the three major cities
of Finland. Helsinki: URMI.
Kauppinen, T., & van Ham, M. (2018). Unravelling the demographic dynamics of ethnic residential segregation.Population, Space and Place.https://doi.org/10.1002/psp.2193
Kavanagh, L., Lee, D., & Pryce, G. (2016). Is poverty decentralizing? Quantifying uncertainty in the decentralization of urban poverty. Annals of the American Association of Geographers,106(6), 1286– 1298.doi:10.1080/24694452.2016.1213156
Kazepov, Y. (Ed.). (2005). Cities of Europe, changing contexts, local arrangement and the challenge to urban cohesion. London: Wiley-Blackwell.
Kornai, J. (1992).The socialist system: The political economy of commun-ism. Princeton: Princeton University Press.
Kovács, Z., & Szabó, B. (2016). Urban restructuring and changing patterns of socioeconomic segregation in Budapest. In T. Tammaru, S. Marcińczak, M. van Ham, & S. Musterd (Eds.), Socioeconomic segregation in European capital cities: East meets West(pp. 238–260). London: Routledge.
Leal, J., & Sorando, D. (2016). Economic crisis, social change and segregation processes in Madrid. In T. Tammaru, S. Marcińczak, M. van Ham, & S. Musterd (Eds.),Socioeconomic segregation in European capital cities: East meets West(pp. 214– 237). London: Routledge.
Lelévrier, C., & Melic, T. (2018). Impoverishment and social frag-mentation in housing estates of the Paris region, France. In D. Hess, T. Tammaru, & M. van Ham (Eds.),Housing estates in Europe: Poverty, ethnic segregation and policy challenges(pp. 313– 338). New York: Springer.
Malheiros, J. (2002). Ethni-cities: Residential patterns in the Northern European and Mediterranean metropolises – Implications for policy design.Population, Space and Place,8(2), 107–134.
Malmberg, B., Andresson, E., & Östh, J. (2013). Segregation and urban unrest in Sweden. Urban Geography,34(7), 1031–1046. doi:10.1080/02723638.2013.799370
Maloutas, T. (2016). Socioeconomic segregation in Athens at the beginning of the 21st century. In T. Tammaru, S. Marcińczak, M. van Ham, & S. Musterd (Eds.),Socioeconomic segregation in European capital cities: East meets West(pp. 156–185). London: Routledge.
Maloutas, T., & Karadimitriou, N. (2001). Vertical social differen-tiation in Athens: Alternative or complement to community seg-regation?International Journal of Urban and Regional Research,25 (4), 699–716.doi:10.1111/1468-2427.00340
Marcińczak, S., Musterd, S., van Ham, M., & Tammaru, T. (2016). Inequality and rising levels of socioeconomic segregation: Lessons from a pan-European comparative study. In T. Tammaru, S. Marcińczak, M. van Ham, & S. Musterd (Eds.),Socioeconomic segregation in European capital cities: East meets West(pp. 358– 382). London: Routledge.
postsocialist countries. Annals of the Association of American Geographers, 105(1), 183–202. doi:10.1080/00045608.2014. 968977
Marcuse, P., & Van Kempen, R. (2000). Introduction. In P. Marcuse, & R. Van Kempen (Eds.),Globalizing cities: A new spatial order?(pp. 1–21). Oxford: Blackwell.
Marcuse, P., & van Kempen, R. (Eds.). (2002).Of states and cities: The partitioning of urban space. Oxford: Oxford University Press. Musterd, S., Marcińczak, S., van Ham, M., & Tammaru, T. (2017). Socioeconomic segregation in European capital cities. Increasing separation between poor and rich.Urban Geography,38(7), 1062– 1083.doi:10.1080/02723638.2016.1228371
Musterd, S., & Ostendorf, W. (1998). Urban segregation and the welfare state: Inequality and exclusion in Western cities. London: Routledge.
Musterd, S., & van Gent, W. (2016). Changing welfare context and income segregation in Amsterdam and its metropolitan area. In T. Tammaru, S. Marcińczak, M. van Ham, & S. Musterd (Eds.), Socioeconomic segregation in European capital cities: East meets West(pp. 55–79). London: Routledge.
Nightingale, C. H. (2012).Segregation: A global history of divided city. Chicago: University of Chicago Press.
Petsimeris, P. (2018). The social and ethnic transformations of large social housing estates in Milan: From modernity to marginalisa-tion. In D. B. Hess, T. Tammaru, & M. van Ham (Eds.),Large housing estates in Europe: Poverty, ethnic segregation, and policy challenges(pp. 265–288). London: Springer.
Petsimeris, P., & Rimoldi, S. (2016). Socioeconomic divisions of space in Milan in the post-Fordist era. In T. Tammaru, S. Marcińczak, M. van Ham, & S. Musterd (Eds.),Socioeconomic segregation in European capital cities: East meets West(pp. 186–213). London: Routledge.
Piketty, T. (2013). Capital in the 21st century. Cambridge, MA: Harvard University Press.
Préteceille, E. (2007). Is gentrification a useful paradigm to analyse social changes in the Paris metropolis? Environment and Planning A,39(1), 10–31.doi:10.1068/a3970
Préteceille, E. (2016). Segregation, social mix and public policies in Paris. In K. Fujita, & T. Maloutas (Eds.),Residential segregation in comparative perspective: Making sense of contextual diversity (pp. 153–176). London: Routledge.
Quillian, L., & Lagrange, H. (2016). Socioeconomic segregation in large cities in France and the United States.Demography,53(4), 1051–1084.doi:10.1007/s13524-016-0491-9
Sachs, S. (2012).The price of civilization. Reawakening virtue and prosperity after the economic fall. London: Vintage.
Sassen, S. (1991).The global city: New York, London, Tokyo. Princeton: Princeton University Press.
Smith, N. (1987). Gentrification and the rent gap. Annals of the Association of American Geographers,77(3), 462–465.
Statistical Office of the European Communities (EUROSTAT). (2018).EUROSTAT database on social inequality. Retrieved from http://appsso.eurostat.ec.europa.eu/nui/show.do?dataset=ilc_di12 Sýkora, L. (2009). New socio-spatial formations: Places of residential
segregation and separation in Czechia. Tijdschrift voor Economische en Sociale Geografie,100(4), 417–435.
Tammaru, T., Marcińczak, S., van Ham, M., & Musterd, M. (Eds.). (2016).Socioeconomic segregation in European capital cities: East meets West. London: Routledge.
Urban, F. (2018). Large housing estates in Berlin. In D. B. Hess, T. Tammaru, & M. van Ham (Eds.),Large housing estates in Europe: Poverty, ethnic segregation, and policy challenges. London: Springer. Wassenberg, F. (2013).Large housing estates: Ideas, rise, fall and recov-ery–The Bijlmermeer and beyond(pp. 99–120). Amsterdam: IOS Press/Delft University Press.
Wessel, T. (2016). Economic segregation in Oslo: polarisation as a contingent outcome. In T. Tammaru, S. Marcińczak, M. van Ham, & S. Musterd (Eds.), Socioeconomic segregation in European capital cities: East meets West(pp. 132–155). London: Routledge.
World Bank. (2018). Gini Index (World Bank estimate). Retrieved fromhttps://data.worldbank.org/indicator/SI.POV.GINI World Inequality Report. (2018). World inequality report 2018.