doi:10.4236/jemaa.2010.27058 Published Online July 2010 (http://www.SciRP.org/journal/jemaa)
The Design of Circular Microstrip Patch Antenna
by Using Quasi-Newton Algorithm of ANN
Abhilasha Mishra1, Ganesh B. Janvale2, Bhausaheb Vyankatrao Pawar3, Pradeep Mitharam Patil4
1
Department of Electronics Engineering, North Maharashtra University, Jalgaon, India; 2Department of Computer Science and Information Technology, Dr. Babasaheb Ambedkar Marathwada University, Aurangabad, India; 3Department of Computer Science, Mumbai University, Mumbai, India; 4Department of Electronics & Telecommunications, Vishwakarma Institute of Technology, Pune, India. Email: [email protected], [email protected], [email protected], [email protected]
Received April 1st, 2010; revised May 23rd, 2010; accepted May 27th, 2010.
ABSTRACT
The paper presents the Quasi Newton model of Artificial Neural Network for design of circular microstrip antenna (MSA). In this model, a closed form expression is used for accurate determination of the resonant frequency of circular microstrip patch antenna. The calculated resonant frequency results are in good agreement with the experimental sults reported elsewhere. The results show better agreement with the trained and tested data of ANN models. The re-sults are verified by the experimental rere-sults to produce accurate ANN models. This presents ANN model practically as an alternative method to the detailed electromagnetic design of circular microstrip antenna.
Keywords: Circular Microstrip Antenna (CMSA), Artificial Neural Network (ANN), Quasi Newton (QN)
1. Introduction
The MSA is an excellent radiator for many applications such as mobile antenna, aircraft and ship antennas, re- mote sensing, missiles and satellite communications [1]. It consists of radiating elements (patches) photo etched on the dielectric substrate. Microstrip antennas are low profile conformal configurations. They are lightweight, simple and inexpensive, most suited for aerospace and mobile communication. Their low power handling capa-bility posits these antennas better in low power transmis-sion and receiving applications [2]. The flexibility of the Microstrip antenna to shape it in multiple ways, like square, rectangular, circular, elliptical, triangular shapes etc., is an added property.
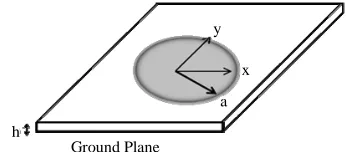
The rectangular and circular patches (Figure 1) are the basic and most commonly used designs in micros- trip antennas. Their designing methods are numerous, yet getting the actual data for developing real prototypes for experiment is found to be difficult. ANN offers a viable solution to obtain the design parameters. Hence, in this paper we have tried to develop the Quasi Newton algo-rithm for the design of circular patch antennas.
ANN is the most powerful optimizing tool in the fie- ld of computational electromagnetic. An ANN consists of interconnected processing units that store experimen-tal knowledge. Such; this knowledge is acquired by a learning process and is stored in the form of parameters
of the ANN [3]. The basic characteristics of ANN is its ability to learn and generalize, fault tolerance, non- line-arity, and adaptivity.
The learning in ANN can be unsupervised or supervi- sed. When an ANN undergoes learning in an unsuper-vised manner, it extracts the features from the input data based on a predetermined performance measure. When an ANN undergoes learning in a supervised manner, it is presented with the input patterns and the desired output patterns. The parameters of the ANN are adapted such that the application of an input pattern results in the de-sired pattern at the output of the ANN [4]. The Quasi Newton is one of the proven universal approximator in ANN design.
The design of CMSA as a closed form expression is gi- ven in Section 2. The Section 3 of the paper contains the description regarding the QN algorithm and design of the microstrip antenna as the analysis and synthesis model.
h
[image:1.595.338.511.624.700.2]y x a Ground Plane
The results and conclusions are described in Section 4 and 5 respectively. ANN models are developed by using NeuroModeler 1.5 tool [5].
2. A Closed Form Expression for CMSA
Design
The performance of circular microstrip antennas has been studied extensively, both analytically and experimentally. Consider the circular microstrip antenna with radius a, height h and permittivity constant εr whose resonant fre-quency in the dominant TM11 mode as explained by Guney [6], is given by (1).
And
1 2
1 1
1 12
2 2
r r
eff
h a
(2)
where αnm- the mth zero of the derivatives of the Bessel function of order n
c - the velocity of light. a - Radius of the circular patch
fr- resonant frequency of circular patch. h - Height of dielectric substrate
εr - Permittivity of dielectric substrate 1.84118
nm c
(for n = m = 1)
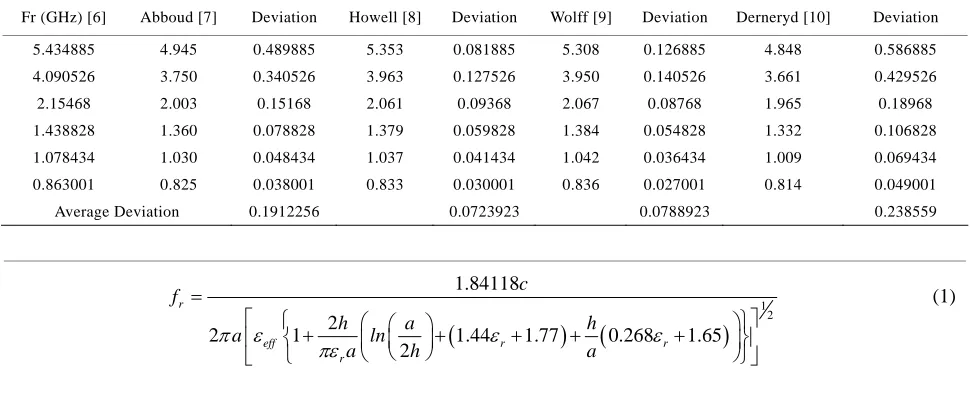
The six patches of CMSA are designed by considering height h as 0.235 and εr as 4.55 with variation of radius a.
The resonance frequency fr calculated by the Guney’s equation was tested in four different and independent ex- periments. Their results when compared showed very lit- tle variation [7-10]. The deviation for resonant frequency of CMSA developed and measured by Abboud [7], Ho-well [8], Wolff [9] and Derneryd [10] is 0.19122, 0.0723,
0.0788, 0.238559 respectively, which is very low as pre-sented in Table 1. That explains the reason why the re-searchers chose Guney’s equation for use in the present study of ANN modeling.
3. ANN Modeling by Using QN Algorithm
3.1 QN Algorithm
This is an advanced training algorithm in which second order derivative information is used. It approximates the inverse of the Hessian matrix of the training error func-tion. The convergence of this method is almost similar to Newton’s method when approaching the solution. The algorithm involves matrix operations. As such, computa-tion effort becomes intensive as the size of the neural network increases. Hence, this training algorithm proves more useful for small and medium scale neural networks. The Quasi-Newton training may follow Conjugate Gra-dient to further reduce the training error. The formula under reference approximates the inverse Hessian matrix during optimization.
Here
( ) ( 1)
g E epochs E epoch
Quasi-Newton condition is:
H w g or w B g
where H is Hessian Matrix,
( r)
H w
T T E
w
B is the approximation of inverse H.
Quasi-Newton method uses history of Δw and ΔE to approximate B:
( 0)
[image:2.595.55.540.534.737.2]B epochs I
Table 1. Analysis of deviation of measured result from Guney’s equation
1 2
1.84118
2
2 1 1.44 1.77 0.268 1.65
2 r
eff r r
r
c f
h a h
a ln
a h a
(1)
Fr (GHz) [6] Abboud [7] Deviation Howell [8] Deviation Wolff [9] Deviation Derneryd [10] Deviation
5.434885 4.945 0.489885 5.353 0.081885 5.308 0.126885 4.848 0.586885
4.090526 3.750 0.340526 3.963 0.127526 3.950 0.140526 3.661 0.429526
2.15468 2.003 0.15168 2.061 0.09368 2.067 0.08768 1.965 0.18968
1.438828 1.360 0.078828 1.379 0.059828 1.384 0.054828 1.332 0.106828
1.078434 1.030 0.048434 1.037 0.041434 1.042 0.036434 1.009 0.069434
0.863001 0.825 0.038001 0.833 0.030001 0.836 0.027001 0.814 0.049001
( 1) ( ) 1
T T
T T
T T
T
w w g B g
B epochs B epoch
w g w g
B g w w g B
g w
(BFGS Formula) (3) The speed of QN is high and the memory space re-quired for it is N2w.
3.2 Analysis Design of Circular Microstrip Antenna by Using QN Algorithm
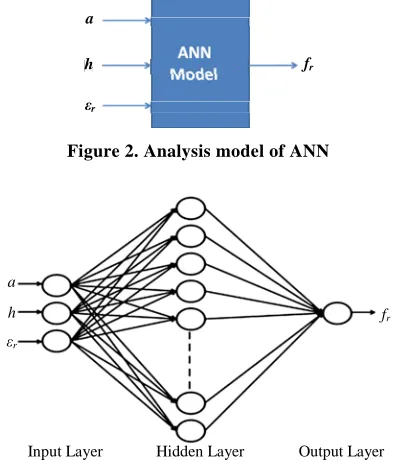
In this model, the accurate value of resonant frequency has been calculated by using Equation (1) and (2). The input parameters are permittivity εr, the height of sub-strate h and patch dimension in terms of radius a.
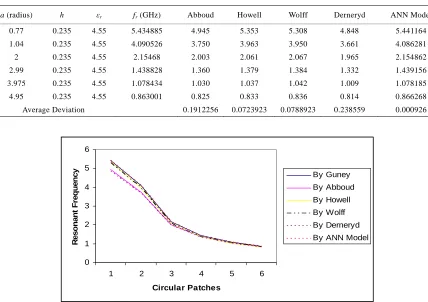
The NN structure for the analysis of CMSA is shown in Figure 2. The Quasi-Newton algorithm has been sidered for ANN modeling. The QN-ANN model con-sists of three layers i.e. input layer, hidden layer and output layer. The neurons for input layer are 3 and for hidden layer are 12; while the output layer has only one as shown in Figure 3. The epochs given for training the model were 200 from which it took only 80 epochs. For the purpose of training, 4397 data are generated for ANN modeling by application of Equation (1), from which 2199 data are selected while the remaining data are se-lected for testing the ANN model. The performance graph is displayed of training and testing in Figure 4 and Fig-ure 5 respectively. As the experimental values of only 6 patches designed by [7-10] are given hence the result of only six patches is shown in Table 2. The output of ANN
a h
εr
[image:3.595.317.530.86.282.2]fr
Figure 2. Analysis model of ANN
a
h
εr
fr
Input Layer Hidden Layer Output Layer
Figure 3. QN structure of analysis design of CMSA
Training Error by using QN
Tr
ai
n
in
g
E
rr
o
r
Epochs 2.5
2
1.5
1
0.5
0
[image:3.595.316.532.326.506.2]0 10 20 30 40 50 60 70 80 90 100
Figure 4. Performance result of QN algorithm developed for training analysis model of CMSA
Neural Model Output vs Test Data (QN)
Outpu
tN
euron
#
1
Sample Number 10
9
8 7
6
5 4
3 2
1
0 0.5 1 1.5 2 2.5 3 3.5 4 4.5 5
Model:OutputNeuron#1
[image:3.595.73.270.475.706.2]Data:OutputNeuron#1
Figure 5. Performance result of testing QN-ANN model of CMSA
Table 2. Forward modeling for the Prediction of Resonant frequency
Input Parameters Target QN
a (radius) h εr fr (GHz)
ANN O/P (GHz)
Error (GHz)
0.77 0.235 4.55 5.434885 5.441164 0.006278
1.04 0.235 4.55 4.090526 4.086281 –0.00425
2 0.235 4.55 2.15468 2.154862 0.000182
2.99 0.235 4.55 1.438828 1.439156 0.000328
3.975 0.235 4.55 1.078434 1.078185 –0.00025
4.95 0.235 4.55 0.863001 0.866268 0.003267
[image:3.595.307.539.579.723.2]model is compared with the target data where QN-ANN model shows as little error as 0.000926, thereby laying a claim to be the best ANN analysis model for the design of CMSA.
3.3 Synthesis Design of Circular Microstrip Antenna by Using QN Algorithm
There are various methods available for the calculation of resonant frequencies of different patch antennas. But reverse calculation of radius from the inputs fr, heigh h and permitivitty constant εr is not available in the litera-ture. The solution for this is reverse modeling of ANN. The reverse model is also called as synthesis model wh- ich predicts the value of radius of circular patch as shown in Figure 6.The synthesis model consists of three layers- input layer with three neurons and hidden layer with 12 neurons and output layer with one neuron. The hidden layer uses sigmoid function while output layer uses linear function as shown in Figure 7.
The model is trained with 2199 data and training error graph is presented in Figure 8. The trained synthesis mo- del is tested with 2198 data from which only six results are verified as its practically measured values are avail- able in the literature [6-10] and it is given in Table 3. It takes only 101 epochs out of 200 for training synthesis model. The performance graph of testing synthesis model is presented in Figure 9. The actual error in values is gi- ven in Table 3 with very less error 0.0006 for the predic-tion of radius.
a h
εr
fr
Figure 6. Synthesis model of ANN
a h
εr fr
Input Layer Hidden Layer Output Layer
Figure 7. QN structure of synthesis design of CMSA
Training Error by using QN
T
rai
ni
n
g
Er
ro
r
Epochs 1
0.9 0.8 0.7 0.6 0.5 0.4 0.3 0.2 0.1 0
0 20 40 60 80 100 120
Figure 8. Performance result of QN algorithm developed for Training CMSA
Neural Model Output vs Test Data (QN)
Ou
tp
utN
eu
ro
n#
1
Sample Number 5
4.5 4 3.5 3 2.5 2 1.5 1 0.5
0 0.5 1 1.5 2 2.5 3 3.5 4 4.5 5
Model:OutputNeuron#1
Data:OutputNeuron#1
Figure 9. Performance result of testing QN-ANN model of CMSA
Table 3. Reverse modeling for the prediction of radius
Input Parameters Target QN
fr(GHz) h εr a (radius)
ANN O/P (GHz)
Error (GHz)
5.434885 0.235 4.55 0.77 0.76673 0.00327
4.090526 0.235 4.55 1.04 1.043208 –0.00321
2.15468 0.235 4.55 2 2.001889 –0.00189
1.438828 0.235 4.55 2.99 2.988124 0.001876
1.078434 0.235 4.55 3.975 3.976177 –0.00118
0.863001 0.235 4.55 4.95 4.945272 0.004729
Table 4. Analysis of computed, measured & ANN predicted resonant frequencies
a (radius) h εr fr (GHz) Abboud Howell Wolff Derneryd ANN Model
0.77 0.235 4.55 5.434885 4.945 5.353 5.308 4.848 5.441164
1.04 0.235 4.55 4.090526 3.750 3.963 3.950 3.661 4.086281
2 0.235 4.55 2.15468 2.003 2.061 2.067 1.965 2.154862
2.99 0.235 4.55 1.438828 1.360 1.379 1.384 1.332 1.439156
3.975 0.235 4.55 1.078434 1.030 1.037 1.042 1.009 1.078185
4.95 0.235 4.55 0.863001 0.825 0.833 0.836 0.814 0.866268
Average Deviation 0.1912256 0.0723923 0.0788923 0.238559 0.000926
0 1 2 3 4 5 6
1 2 3 4 5 6
Circular Patches
R
e
s
ona
nt
Fr
e
que
nc
y By Guney
By Abboud
By Howell
By Wolff By Derneryd
By ANN Model
Figure 10. Comparison of measured fr by [6-10] and QN-ANN output
4. Result
The results demonstrate the excellent capacity of the neural model approximation which has been analyzed from Ta-bles 1, 2, 3 and 4. The good agreement between the neu-ral model answers and the fabricated patches as showed in Figure 10, demonstrates a good generalization capac-ity of the model through the Quasi-Newton modular structure. Besides, the QN structure, directly trained by means of measured/simulated data through the EM- ANN technique, is very flexible. It has the potential to be substituted, as models, mainly when new components/ technologies for microwaves circuits come up.
5. Conclusions
The neural models presented in this work have been fou- nd to possess high accuracy and requires no complicated mathematical functions. Using these models one can cal- culate resonant frequency of circular microstrip antenna accurately. The second ANN model of synthesis has uni- que characteristic of predicting radius of circular patches which is not available in the literature. If more data set is used for the training, the NN model gives more robust results. The analysis and synthesis models of ANN, gives
better result for CMSA design which is found to compare well with the fabricated and measured values. So, it can be concluded that both the models are efficient for the prediction of resonant frequency and radius of the circu-lar patch for all the practical purposes.
6. Acknowledgements
Authors acknowledge the support and valuable guidance; they have received from Prof. Q. J. Zhang, Professor and Chair, Department of Electronics, Carleton University, Ottawa, Canada in preparation of this paper.
REFERENCES
[1] G. Kumar and K. P. Ray, “Broadband Microstrip Anten-nas” Artech House, London, 2003.
[2] G. Garg, P. Bhartia, I. Bahl and A. Ittipiboon, “Microstrip Antenna Design Handbook,” Artech House, Canton, 2001. [3] B. Yegnanarayana, “Artificial Neural Networks,”
Pren-tice-Hall of India, Delhi, 1999.
[5] Q. J. Zhang, “NeuroModeler Version 1.5 Software,” Carleton University, Ottawa, 2004.
[6] K. Guney, “Resonant Frequency of Electrically-Thick Circular Microstrip Antenna,” International Journal of Electronics, Vol. 77, No. 3, 1994, pp. 377-386.
[7] F. Abbound, J. P. Damiano and A. Papiernik, “New De-termination of Resonant Frequency of Circular Disc Mi-crostrip Antenna: Application to Thick Substrate,” Elec-tronics Letters, Vol. 24, No. 17, 1988, pp. 1104-1106. [8] J. Q. Howell, “Microstrip Antenna,” IEEE Transactions
on Antennas and Propagation, Vol. 23, No. 1, 1975, pp. 90-93.
[9] I. Wolff and N. Knoppik, “Rectangular and Circular Mi-crostrip Disk Capacitors and Resonators,” IEEE Transac-tions on Microwave Theory and Techniques, Vol. 22, No. 10, October 1974, pp. 857-864.