Gas Turbine Performance Optimization Using Compressor
Online Water Washing Technique
Ezenwa Alfred Ogbonnaya
Department of Marine Engineering Rivers State University of Science and Technology, Nkpolu, Port Harcourt, Nigeria
E-mail: [email protected]
Received February 10,2011; revised March 22, 2011; accepted April 6, 2011
Abstract
The ability to predict the behaviour of a gas turbine engine and optimize its performance is critical in eco-nomic, thermal and condition monitoring studies. Having identified fouling as one of the major sources of compressor and therefore gas turbine deterioration, a computer-based engine model was developed to optimize the performance of gas turbines. The paper thus presents an analysis of compressor hand cleaning, on and offline compressor washing to actualize the technique using a computer program in Visual Basic programming language with data collected over a period of fifteen weeks for 2 gas turbine plants GT1 and GT2. The results of the data collected, when collated, shows that after washing, the overall operational efficiency changed from 39.2% to 46.25%. To optimize the performance of gas turbine engines, it is therefore recommended that operators should perform a combination of compressor hand cleaning, offline and online washing simultaneously.
Keywords: Gas Turbine, Turbomachinery Components, Fouling, Performance Optimization, Operational Practices, Compressor Water Washing
1. Introduction
Gas Turbines (GTs) have wide range of industrial appli- cations. Proper maintenance and operating practices can significantly affect the level of performance degradation and thus time between repairs or overhauls of a GT [1-5]. The correct construction and operation of the compo- nents of GT plants are also necessary for proper under- standing and monitoring. Furthermore, the function of a GT is the result of the fine-tuned cooperation of many different components of the plant. [6-9]. The emphasis of this work is on the turbomachinery or aerodynamic components of the GT. Hence the special contribution of this work to GT operation and maintenance is that it helps to prolong the life of the turbomachinery com- ponents of the engine.
From the point of view of application, the GT’s com- pressor is affected by the environmental conditions of the site [10-12]. With increasing operating time, degradation of the compressor manifest in the form of reduced per- formance. The major cause of reduction in compressor efficiency and inlet air mass flow is fouling. Others are abrasion, corrosion and erosion of the blade surfaces.
The degradations of the GT compressor has direct influ- ence on the GT power plant efficiency, pressure ratio and power. With a view to prevent degradation, optimize performance and increase availability, GTs are equipped with sophisticated air filter systems. These air filter sys- tems significantly reduce the amount of contaminants that GTs are subjected to but cannot filter out the con- taminant completely [11]. This present work applied online water washing to optimize the performance of a GT plant on industrial duty for electricity generation in Sapele, Delta State of Nigeria. It further looked into the plus and minus of other GTs maintenance techniques.
deposits on the blades can create blade washing effects [14]. Performance analysis can be applied to both rotat- ing and stationary parts of the GT. It is one condition monitoring technique which allows the optimum time for restorative maintenance to be calculated, where the dete- rioration may result in increased fuel consumption or in reduced output or both [15-21]. The types of compressor cleaning methods with their merits and demerits are detailed as follows:
1.1. Compressor Abrasive Cleaning
The application of abrasive materials for cleaning of compressors such as the injection of rive or walnut— shell into the compressor for its clearing is becoming outdated [11,22,23]. This is because the erosion impact is more followed by the danger that these non-liquid mate- rials are capable of clogging the passages of the second- dary air system. Furthermore, these non-liquid particles may cause damage to the compressor blade coating.
1.2. Compressor Hand Cleaning
This entails cleaning the inlet guide vanes (IGV) and the blades of the first compressor row with brushes and a detergent [24]. Although this method is effective for re- moving particles sticking to the blade surface, its short- coming is that it is time consuming and requires the GTs to be shutdown. Hence this method should be supported by offline washing.
1.3. Compressor Offline Washing
In this method, the GT has to be shutdown and cooled, followed by flushing the compressor with demineralized water [24]. This approach enables compressor fouling to be removed virtually completely. With a view to avoid GTs non-availability, this method should be used during normal inspection interval.
1.4. Compressor Online Washing
This technique is normally done during GTs base-load operation with the IGVs in the fully open condition. It is achieved by installing an online washing system at the air inlet of the GTs [25,11]. Although this method is known to diminish compressor fouling, it can not com-pletely eliminate it.
2. Methodology
The test engines are GTs 1 and 2 of the same capacity (45 MW) on industrial duty for electricity generation in
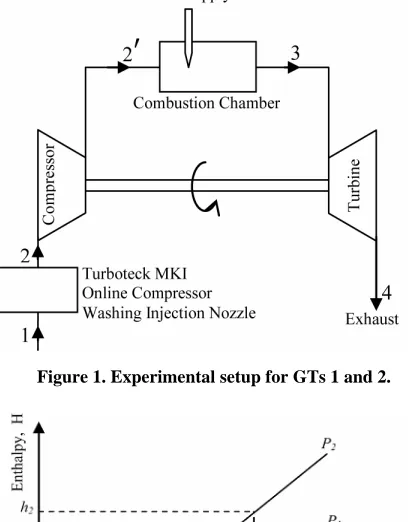
Sapele, Delta State of Nigeria. Both GTs were commis- sioned on the same day. After a period of three month GT1 and GT2 were shutdown for maintenance. The online washing method was done on weekly intervals for a period of fifteen weeks. Deminerialized water was in- jected through a configuration of small nozzles in the air flow before the first compressor stage. At the end of the exercise, the data gathered from both plants on daily ba- sis were sampled and the mean used in this research. These parameters enabled the calculation of the com- pressor efficiency and other relevant operational pa- rameters. In this work, it was assumed that the compres- sor inlet conditions correspond to the ambient conditions. The analyses were performed with the equations be- low, while the experimental setup is shown in Figure1. Figure2 also shows the enthalphy versus entropy map of a compressor. It is between 2 and 2 ' that water washing takes place. Therefore H2 is the enthalpy after
[image:2.595.321.525.330.591.2]water washing.
[image:2.595.320.528.490.695.2]Figure 1. Experimental setup for GTs 1 and 2.
The compressor component is modeled as: 1 ' 2 2 1 1 T P T P
(1) Similarly, the turbine component is expressed as:
1 3 3 ' 4 4 T P P T
(2) Furthermore, the isentropic efficiency of the com-pressor is expressed as;
c
Isentropic enthalphy drop Actual enthalpy drop
' 1 1 2 2 c h h h h
(3)
Also, the isentropic efficiency of the turbine is given by:
T
Actual enthalphy drop Isentropic enthalpy drop
3 4 3 4 T T T T T
(4)
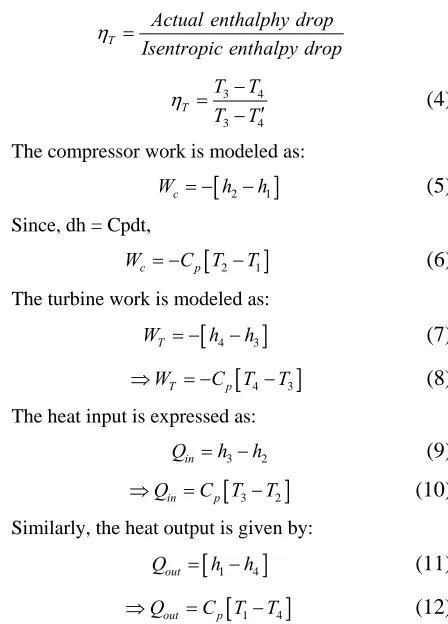
The compressor work is modeled as:
2 1
c
W h h (5)
Since, dh = Cpdt,
2 1
c p
W C T T (6)
The turbine work is modeled as:
4 3
T
W h h (7)
4 3
T p
W C T T
(8)
The heat input is expressed as:
3 2
in
Q h h (9)
3 2
in p
Q C T T
(10)
Similarly, the heat output is given by:
1 4
out
Q h h (11)
1 4
out p
Q C T T
(12)
The Network output and heat input is expressed respectively as:
c T
W W W
(13)in out
Q Q Q
(14)The overall efficiency of the test engine is modeled as:
th
Net work Net Heat Supplied
(15)
T c th in W W Q
(16)
By appropriate substitutions,
1 1 1 th p
(17)
Noting that p is called the pressure ratio and is ex-pressed as: 3 2 1 4 p P P P P
(18)
3. Results
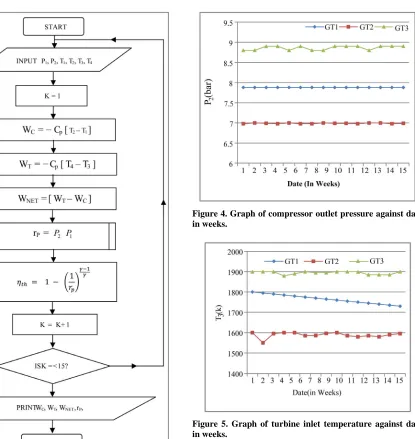
The results of the analyses carried out on GT 1, and GT2 are shown in Tables 1 and 2. Table 2 shows the data taken before water washing. Table 3 shows the monitored data for GT2 during the combination of the 3 water washing methods considered in this work while Table 4 shows the values of percentage derivations in outlet parameter. The values in these tables were used to plot the various graphs shown from Figures 5 to 9. These graphs are further used to explain the impact of this work to engineering pratise. Figure3 shows a pro-gramme flowchart to determine the performance of the GTs. The flowchart was constructed from Equations 6, 8 and 17.
4. Discussion of Results
[image:3.595.61.285.320.632.2]Figure 3. Flow chart for performance trending drawn from Equations (6), (8) and (17).
The path of the GTs when the turbine inlet tempera-ture is plotted against date in weeks is shown in Figure5. The trend shows that the use of online water washing improved the firing temperature of GT1 but a combina-tion of online and offline water washing resulted in an increase in the firing temperature of 1900k for GT2.
[image:4.595.56.287.79.524.2]The graphs of the GTs when the Network output is plotted against date in weeks are shown in Figure6. It shows that GT1 had initial high network output which later decreased due to redeposition of foulants in the later stages of the compressor. Furthermore, Figure6 shows that with a combination of compressor hand cleaning, offline and online water washing, the network output of
[image:4.595.311.533.140.476.2]Figure 4. Graph of compressor outlet pressure against date in weeks.
Figure 5. Graph of turbine inlet temperature against date in weeks.
[image:4.595.312.534.519.704.2]Table 1. Monitored Data for GT2 before water-washing (GTo).
Date (wks) T1 (k) T2 (k) P1 (bar) P2 (bar) T3 (k) T4 (k) Wnet (kJ/kg) 0 c
[image:5.595.54.541.311.498.2]1 300 520.7246 1.013 6.98 1600 950 432.15 0.392 0.78 2 300 521.5418 1.013 7.00 1550 954 376.88 0.393 0.77 3 300 520.7211 1.013 6.99 1595 953 424.11 0.392 0.76 4 300 520.7246 1.013 6.98 1600 954 428.13 0.392 0.78 5 300 521.5480 1.013 7.00 1600 950 431.15 0.393 0.78 6 300 520.7246 1.013 6.98 1585 953 414.06 0.392 0.77 7 300 520.2246 1.013 6.98 1586 954 414.06 0.392 0.77 8 300 521.5480 1.013 7.00 1596 953 424.11 0.393 0.76 9 300 520.7211 1.013 6.99 1600 950 432.15 0.392 0.78 10 300 520.7211 1.013 6.99 1585 950 471.08 0.392 0.76 11 300 520.7246 1.013 6.98 1580 953 409.04 0.392 0.76 12 300 521.5480 1.013 7.00 1585 954 412.05 0.393 0.77 13 300 521.5480 1.013 7.00 1580 953 408.03 0.393 0.78 14 300 520.7246 1.013 6.98 1590 954 418.08 0.392 0.78 15 300 520.7211 1.013 6.99 1595 954 423.11 0.392 0.77
Table 2. Monitored data for GT1 with online water-washing.
Date (wks) T1 (k) T2 (k) P1 (bar) P2 (bar) T3 (k) T4 (k) Wnet (kJ/kg) 0 c
1 300 541.1492 1.013 7.88 1800 983.2679 578.460 82 0.457 0.82 2 300 550.1683 1.013 7.88 1795 977.8053 572.141 50 0.457 0.82 3 300 559.1875 1.013 7.88 1790 975.0740 565.822 24 0.457 0.81 4 300 568.2066 1.013 7.88 1785 972.3427 559.502 95 0.457 0.82 5 300 577.2258 1.013 7.88 1780 969.6114 553.183 66 0.457 0.82 6 300 586.2449 1.013 7.88 1775 966.8801 546.864 96 0.457 0.81 7 300 595.2641 1.013 7.88 1770 964.1488 540.545 07 0.457 0.81 8 300 604.2832 1.013 7.88 1765 961.4175 534.225 72 0.457 0.81 9 300 613.3024 1.013 7.88 1760 958.6862 527.906 49 0.457 0.81 10 300 622.3215 1.013 7.88 1755 955.9541 521.587 19 0.457 0.82 11 300 631.3407 1.013 7.88 1750 953.2236 515.2679 0.457 0.81 12 300 640.3598 1.013 7.88 1745 953.2236 508.94861 0.457 0.82 13 300 649.3790 1.013 7.88 1740 950.4923 502.629 32 0.457 0.82 14 300 658.3982 1.013 7.88 1735 949.7620 496.310 02 0.457 0.82 15 300 667.4173 1.013 7.88 1730 945.0297 489.990 73 0.457 0.82
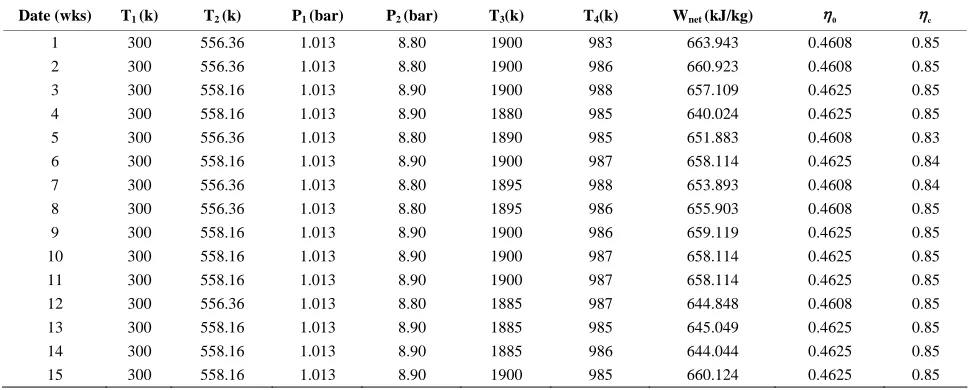
Table 3. Monitored data for GT2 during a combination of compressor hand cleaning, online and offline water-washing.
Date (wks) T1 (k) T2 (k) P1 (bar) P2 (bar) T3(k) T4(k) Wnet (kJ/kg) 0 c
1 300 556.36 1.013 8.80 1900 983 663.943 0.4608 0.85
2 300 556.36 1.013 8.80 1900 986 660.923 0.4608 0.85
3 300 558.16 1.013 8.90 1900 988 657.109 0.4625 0.85
4 300 558.16 1.013 8.90 1880 985 640.024 0.4625 0.85
5 300 556.36 1.013 8.80 1890 985 651.883 0.4608 0.83
6 300 558.16 1.013 8.90 1900 987 658.114 0.4625 0.84
7 300 556.36 1.013 8.80 1895 988 653.893 0.4608 0.84
8 300 556.36 1.013 8.80 1895 986 655.903 0.4608 0.85
9 300 558.16 1.013 8.90 1900 986 659.119 0.4625 0.85
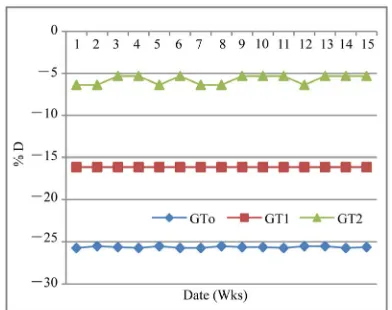
[image:5.595.55.540.526.721.2]Table 4. Values of percentage derivation in compressor outlet pressure under various operational practices.
Date P2 (bar) GT1 P2 (bar) GT2 P2 (bar) GT3
(wks) Design Value
Operational
Value %D
Design Value
Operational
Value %D
Design Value
Operational
Value %D 1 9.40 6.98 –25.74 9.40 7.88 –16.17 9.40 8.80 –6.38 2 9.40 7.00 –25.53 9.40 7.88 –16.17 9.40 8.80 –6.38 3 9.40 6.99 –25.64 9.40 7.88 –16.17 9.40 8.90 –5.32 4 9.40 6.98 –25.74 9.40 7.88 –16.17 9.40 8.90 –5.32 5 9.40 7.00 –25.53 9.40 7.88 –16.17 9.40 8.80 –6.38 6 9.40 6.98 –25.74 9.40 7.88 –16.17 9.40 8.90 –5.32 7 9.40 6.98 –25.74 9.40 7.88 –16.17 9.40 8.80 –6.38 8 9.40 7.00 –25.53 9.40 7.88 –16.17 9.40 8.80 –6.38 9 9.40 6.99 –25.64 9.40 7.88 –16.17 9.40 8.90 –5.32 10 9.40 6.99 –25.64 9.40 7.88 –16.17 9.40 8.90 –5.32 11 9.40 6.98 –25.74 9.40 7.88 –16.17 9.40 8.90 –5.32 12 9.40 7.00 –25.53 9.40 7.88 –16.17 9.40 8.80 –6.38 13 9.40 7.00 –25.53 9.40 7.88 –16.17 9.40 8.90 –5.32 14 9.40 6.98 –25.74 9.40 7.88 –16.17 9.40 8.90 –5.32 15 9.40 6.99 –25.64 9.40 7.88 –16.17 9.40 8.90 –5.32
GT2 increased to 480.0kJ/kg.
The graph of compressor efficiency is shown in Fig-ure7. From the graph, GT2 has the highest compressor efficiency of 85%. This is as a result of a combination of compressor hand cleaning and offline/online water washing. Also, GT1 yielded compressor efficiency of 82% as a result of applying online water washing only. It also implies that the air pumping capacity of the GT2 compressor has increased.
The graph of overall GTs operational efficiency is shown in Figure 8. It is observed that a small change of the compressor efficiency have a significant effect on theoverall GT performance and efficiency. GT1 has com-
[image:6.595.65.283.520.692.2]Figure 7. Graph of isotropic compressor outlet efficiency against date in weeks
[image:6.595.325.521.536.691.2]Figure 8. Graph of overall operational efficiency against date in weeks.
pressor efficiency of 82% which resulted to overall GT efficiency of 45.8%. Also, GT2 has compressor ciency of 85% and it resulted to overall operational effi-ciency of 46.25%.
Also, the graph of percentage derivation in compressor outlet pressure against date in weeks is shown in Figure 9(a).
5.
Conclusions
A comparative analysis has been carried out on three GTs on industrial duty for electricity generation. These GTs were commissioned at the same time before the re-search was carried out on them. GTo served as a control while compressor online washing was applied on GT1, a combination of compressor hand cleaning and online/offline water washing was applied to GT2. The exercise lasted for fifteen weeks. The result of the analy-sis shows that with the use of compressor online water washing on GT1 yielded a compressor efficiency of 82% and overall operational efficiency of 45.8%. Also, the use of compressor hand cleaning, online and offline wa-ter washing on GT2 yielded a compressor efficiency of 85% and overall operational efficiency of 46.25% the results are handy to conclude that an acceptable balance between these maintenance and operational practices improves the GTs performance and optimize their avail-ability.
6. References
[1] I. S. Diakunchak, “Performance Degradation in Industrial Gas Turbines,” ASME Paper91-GT-228,1991.
[2] P. C. Frith, “The Effect of Compressor Rotor Tip Crops on Turbo- Engine Performance,” ASME Paper92-GT-83, 1992.
[3] S. A. Khalid, A. S. Khalsa, I. I. A. Waitz, S. C. Tan, E. M. Greitzer, N. A. Cumpsty, J. J. Adamczyk and F. E. Marble, “Endwal Blockage in Axial Compressor,” ASME Paper 98-GT-203,1998.
[4] R. J. Kind, P. J. Serjak and M. W. P. Abbott, “Measurements and Prediction of the Effects of Surface Roughness on Profile Losses and Deviation in a Turbine Cascade,” ASME Paper 96-GT-203, 1996.
[5] R. Kurz and K. Brun, “Degradation in Gas Turbine Sys-tems,” ASME Journal of Engineering for Gas Turbines
and Power, Vol. 123, No. 1, 2001 pp. 70-77. doi:10.1115/1.1340629
[6] R. K. Rajput, “A Textbook of Power Plant Engineering,” Laximi Publications, New Delhi, 1995.
[7] D. G. Wilson, “The Design of High Efficiency Turbo-machinery and Gas Turbines,” MIT Press, Mass, 1994.
[8] T. D. Eastop and A. McConkey “Applied Thermodynam-ics for Engineering Technologists,” 5th Edition,
Addi-son-Wesley Longman, Ltd., UK, 1993.
[9] P. K. Nag, “Power Plant Engineering,” 2nd Edition, Tata McGraw Hill Publishing Company Limited, New Delhi, 2001, p.764.
[10] E. A. Ogbonnaya, “Modeling Vibration Based Faults in Rotor Shaft of Gas Turbines,” Ph.D Thesis, Rivers State University of Science and Technology, Port Harcourt, 2004.
[11] E. Schneider, Dermiricioglu, S. Fraanco and D. Therkom, “Analysis of Compressor Online Washing to Optimize Gas Turbine Power Plant Performance,” Proceedings of ASME Turbo Expo 2009, Orlando, 8-12 June 2009, pp. 1-9.
[12] E. A. Ogbonnaya and K. Theophilus Johnson, “Use of Multiple Variable Mathematical Method for Effective Condition Monitoring of Gas Turbine,” Proceedings of ASME Turbo-Expo, Glasgow, 14-18 June 2010, pp. 1-4. [13] R. J. Boyle, “Prediction of Surface Roughness and
Inci-dence Effects on Turbine Performance,” Journal of Tur-bomachinery, Vol. 116, No. 4, 1994, pp. 512-519. doi:10.1115/1.2929468
[14] E. A. Ogbonnaya, H. U. Ugwu and C. N. Johnson, “Computer-Aided Solution to the Vibrational Effect of Instabilities in Gas Turbine Compressors,” Engineering, Vol. 2, No. 8, 2010, pp. 658-664.
doi:10.4236/eng.2010.28084
[15] R. Beebe, “Condition Monitoring by Performance Analy-sis to Optimize Time for Overhaul of Centrifugal Pumps,” 52nd Annual Meeting for Machinery Failure
Prevention Society, Virginia Beach, 3 August 2009, pp. 102-112.
[16] C. B. Meher-Homji, M. Chaka and A. E. Brouley, “The Fouling of Axial Flow Compressor-Causes,Effects, Sus-ceptibility and Sensitivity,” Proceedings of ASME Turbo Expo Orlando, Florida, 8-12 June 2009, pp. 1-20.
[17] M. Venturini, “Influence of Blade Determination on Compressor and Turbine Performance” ASME Paper GT 2008-50043, 2008.
[18] R. E. Duudas, “The Use of Performance Monitoring to Prevent Compressor and Turbine Failures,” ASME I
nten-tional Gas Turine and Aeroengine Congress, Paper No. 82-GT-66, 1982.
[19] E. D. Bently, C. T. Hatch and B. Grissom “Fundamental of Rotating Machine Diagnositic,” Bently Pressurized Bearing Press, Minden, 2002.
[20] E. A. Ogbonnaya, “Diagnosing and Prognosing Gas Tur-bine Rotor Shaft Faults Using the MICE,” Proceedings of ASMETurbo ExpoGT 2009-59450, Orlando, 8-12 June 2009, pp. 1-10.
[21] H. C. Pussey, “Turbo-Machinery Condition Monitoring and Failure Prognosis, Shock and Vibration Information Analysis,” centre/H1-Test Laboratories, Proceedings of Institute of Vibration, Virginia, 8 November 2007, pp 2-10.
Gas Turbine,” Journal of Engineering for Gas Turbine
and Power, Vol. 129, No. 1, 2007, pp. 114-129. doi:10.1115/1.2181180
[23] J. P. Stalder, “Gas Turbine Compressor Washing State of the Art: Field Experiences, Journal of Engineering for
Gas Turbine and Power, Vol. 123, No. 2, 2001, pp 363-370. doi:10.1115/1.1361108
[24] S. Demircioglu, “Detail Analysis of Compressor Online Wash Impact in the Gas Turbine Performance,” Diploma Thesis, F. H. Offenbury, 2008.
[25] K. R. Brun and H. Simmons, “Aerodynamic Instability and Life Limiting Effects of Inlet and Interstage Water Injection into Gas Turbines,” ASME Paper GT 2005-68007, 2005.
Nomenclature
Cp= Specific heat capacity at constant pressure (kJ/kg)
D= Percentage derivation
ΣQ= Network output (kJ/kg)
ΣW= Network output (kJ/kg) GT= Gas turbine
GTo= Monitored data before water washing of GTs.
h1= Specific enthalpy at compressor inlet (kJ/kg)
h2= Specific enthalpy at compressor outlet
(kJ/kg)
h3= Specific enthalpy at turbine inlet (kJ/kg)
h4= Specific enthalpy at turbine outlet (kJ/kg)
nc= Isentropic efficiency of compressor ητ= Isentropic efficiency of turbine ηth= Overall thermal efficiency
P1= Compressor inlet pressure (bar)
P2= Compressor exit pressure (bar)
P3= Turbine inlet pressure (bar)
P 4 = Turbine outlet pressure (bar)
Qi n= Heat input (kJ/kg)
Qout= Heat output (kJ/kg) p
= Pressure ratio
T 1 = Compressor inlet temperature (k)
T 2 = Compressor outlet temperature (k)
T21 = Compressor isentropic outlet temperature (k)
T 3 = Turbine inlet temperature (k)
T 4 = Turbine outlet temperature (k)
T41 = Turbine isentropic outlet temperature (k)