ISSN Print: 2151-1934
DOI: 10.4236/jct.2019.103021 Mar. 22, 2019 257 Journal of Cancer Therapy
Correlation between the Changes in Lung
Function and Lung Density Changes in
Patients Following Radio- (Chemo-)
Therapy for Thoracic Carcinomas
Christina Schroeder
1,2*, Rita Engenhart-Cabillic
1, Sven Kirschner
3, Eyck Blank
3, André Buchali
3 1Clinic for Radiotherapy and Radiation Oncology, University Clinic Giessen and Marburg, Marburg, Germany2Clinic for Radiation Oncology, Universitätsspital Zürich, Zürich, Switzerland
3Clinic for Radiotherapy and Radiation Oncology, Ruppiner Kliniken GmbH, Neuruppin, Germany
Abstract
Purpose: In this analysis we focused on the correlation of patients’ lung func-tion (PFT) data and lung density changes (ΔHU) detected in follow-up CTs. Material and Methods: PFT and lung function data were available for 58 pa-tients 12 weeks and 47 papa-tients 6 months after radio- (chemo-) therapy for thoracic carcinomas (NSCLC, SCLC and esophageal carcinoma). The fol-low-up CT scans were matched with the planning CT scans of each patient and then subtracted to calculate ΔHU for each voxel using customized re-search software. PFT data regarding e.g. vital capacity (VC), total lung
capac-ity (TLC) and diffusion capaccapac-ity for carbon monoxide (DLCO) were collected
before and at several follow-up appointments after treatment. Results: 12 weeks after therapy there was a statistically significant correlation between
difference in DLCO and the maximum ΔHU as well as the difference in TLC
and the minimum ΔHU. 6 months after treatment there was a significant
correlation between the difference in VC and DLCO with numerous lung
den-sity parameters, e.g. the mean and median lung denden-sity changes and the 75th
percentile of ΔHU. There was no significant correlation between the PFT
pa-rameters FEV1, pCO2 and pO2 and any lung density parameter at any
fol-low-up appointment. Conclusion: There is a significant correlation between
DLCO and ΔHU 6 months after treatment that most likely reflects the
under-lying pathological mechanisms in terms of the development of fibrotic lung tissue after RT. The relevance of the significant correlations 12 weeks after RT is questionable.
How to cite this paper: Schroeder, C., Engenhart-Cabillic, R., Kirschner, S., Blank, E. and Buchali, A. (2019) Correlation be-tween the Changes in Lung Function and Lung Density Changes in Patients Follow-ing Radio- (Chemo-) Therapy for Thoracic Carcinomas. Journal of Cancer Therapy, 10, 257-267.
https://doi.org/10.4236/jct.2019.103021
Received: February 19, 2019 Accepted: March 19, 2019 Published: March 22, 2019
Copyright © 2019 by author(s) and Scientific Research Publishing Inc. This work is licensed under the Creative Commons Attribution International License (CC BY 4.0).
DOI: 10.4236/jct.2019.103021 258 Journal of Cancer Therapy
Keywords
Lung, Thoracic Neoplasms, Radiation Injuries, Pulmonary Fibrosis, Lung Function
1. Introduction
There are numerous ways to examine radiation therapy (RT) related injuries to the lung tissue. On the one hand, there are simple but nonetheless crucial aspects like treatment related side effects; on the other hand, there are parameters that allow an analysis of the influence of RT in more detail and even give the oppor-tunity to quantify the treatment induced lung damage. Two of these parameters are the changes in pulmonary function and the changes in lung density detecta-ble by follow-up CT scans.
Pulmonary function tests (PFT) are easy to perform and often part of treat-ment preparation. Therefore, they have been the subjects of a number of studies in the past. There are some common results in most of these studies like the
de-crease of the diffusion capacity for carbon monoxide (DLCO) after RT [1]-[8].
Other lung function parameters, mostly regarding ventilation parameters, lead to different results about their course over time [9] [10].
There are only a few studies regarding lung density changes in CT scans, probably due to the fact that there is no commercially available software for this,
so that research software has to be customized [1] [11]-[19]. Because of the lack
of commercial software for an automated analysis, older studies were often per-formed by using X-rays or the manual evaluation of just a few CT slides per pa-tient. Common results were an increase in lung density after RT, regarding the influence of dose and time after treatment different results were published though [11]-[19].
In addition to the aspects of changes in PFT and lung density after RT the question arises if and how the density changes in the follow-up CTs influence the patient’s pulmonary function. Are they relevant to a patient’s pulmonary ca-pacity and therefore possibly influencing his physical functioning? This aspect has rarely been analyzed before. Therefore, we analyzed prospectively collected data focusing on the correlation of the patient’s PFT data and changes in pul-monary density measured with the help of a customized computer program for matching and analyzing follow-up CT scans. We focused on common PFT
pa-rameters regarding diffusion (DLCO), ventilation (e.g. vital capacity (VC)) and
blood gas analysis.
2. Methods and Material
2.1. Patient Characteristics
par-DOI: 10.4236/jct.2019.103021 259 Journal of Cancer Therapy
ticipation and a Karnofsky index (KI) of at least 70%. Patients with a lung opera-tion in the patient’s medical history, a relevant pleural effusion visible in the planning CT, a forced expiratory volume in 1 second (FEV1) of less than 1 liter, the refusal of participation or a KI of less than 70% were excluded. From April 2012 to October 2015 81 patients with thoracic carcinomas received radio- (chemo-) therapy. NSCLC patients were treated with a total radiation dose of 74 Gy, SCLC patients with 60 Gy and patients with esophageal carcinoma with 66 Gy. Fraction dose was 2 Gy each. During concurrent RCT patients with NSCLC
received Cisplatin (80 mg/m2) and Vinorelbin (15 mg/m2). Patients with SCLC
received Cisplatin (75 mg/m2) and Etoposid (120 mg/m2) simultaneously.
Pa-tients with esophageal carcinomas were treated with Cisplatin (75 mg/m2) and
5-Fluoruracil (5 FU) (800 mg/m2/24 h). If the glomerular filtration rate was
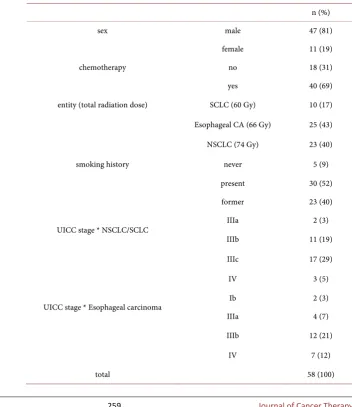
[image:3.595.183.536.340.748.2]low-er than 60 ml/min patients received Carboplatin AUC 5 instead of Cisplatin. 58 of those patients received both a follow-up CT and pulmonary function testing 12 weeks after RT and 47 patients 6 months after RT. Further patient characte-ristics are shown in Table 1.
Table 1.Patient characteristics.
n (%)
sex male 47 (81)
female 11 (19)
chemotherapy no 18 (31)
yes 40 (69)
entity (total radiation dose) SCLC (60 Gy) 10 (17)
Esophageal CA (66 Gy) 25 (43)
NSCLC (74 Gy) 23 (40)
smoking history never 5 (9)
present 30 (52)
former 23 (40)
UICC stage * NSCLC/SCLC IIIa 2 (3)
IIIb 11 (19)
IIIc 17 (29)
IV 3 (5)
UICC stage * Esophageal carcinoma Ib 2 (3)
IIIa 4 (7)
IIIb 12 (21)
IV 7 (12)
DOI: 10.4236/jct.2019.103021 260 Journal of Cancer Therapy
2.2. Treatment Characteristics
All patients were treated with intensity-modulated treatment techniques (IMRT with “sliding window” technique or volumetric modulated radiation treatment
in “rapid arc”TM (Varian medical Systems) technique). The treatment plans were
calculated by a medical physicist using Eclipse softwareTM (Varian medical
Sys-tems) with an AAA algorithm for dose calculation. All treatment plans had to match intradepartmental dose constraints. Dose constraints for the lung were V20 Gy < 30 %, V30 Gy < 20 Gy and V20 Gy < 1000 ml; for the spinal cord a maximum dose (Dmax) < 47 Gy; for the esophagus a Dmax < 74 Gy and for the heart a mean dose < 35 Gy, D (33%) < 60 Gy und D (50%) < 45 Gy. All these dose values refer to biological doses.
2.3. Analysis of Follow-Up CT Scans
Patients received follow-up CT scans 12 weeks and 6 months after RT. For all
CT scans a Sensation open CT (SiemensTM) with 2 mm slices was used. To
cal-culate the density changes of the lung tissue over time a patient’s follow-up CT scans had to be matched to the original treatment planning CT. Because of the unavoidably always slightly different positioning and breathing position of a pa-tient a deformation of one of the scans was necessary prior to the matching. Since the treatment planning CT was linked to the dose data and structure files the follow-up CT had to get deformed. To calculate the differences in lung den-sity (in Hounsfield units) the treatment planning and the follow-up scan where then subtracted. Because the focus was supposed to be on changes in the lung parenchyma, structures with higher density like the tumor itself, adjacent or-gans, blood vessels etc. were subtracted with a small safety margin.
Since no commercial software was available research software had to be cus-tomized. This included CERR (Computational Enviroment for Radiotherapy Research), an open source library for medical research by the US National Insti-tutes of Health and 3D-Slicer, also open source library for medical research by the National Alliance for Medical Image Computing (NA-MIC). The original data sets were imported, analyzed and ΔHU with the corresponding dose were exported into Microsoft Excel. For the present analysis the minimum and
max-imum ΔHU, mean ΔHU, median ΔHU, 5th, 25th, 75th and 95th percentile were
calculated for each patient.
2.4. Pulmonary Function Tests
Lung function data were collected before radiation treatment, 6 weeks, 12 weeks and 6 month after RT. Data of patients that were not able to attend all appoint-ments but had received both PFT testing and follow-up CT scans 12 weeks or 6 months post RT were also used for analysis. The following lung function para-meters were analyzed: vital capacity (VC), total lung capacity (TLC), forced ex-piratory volume in 1 second (FEV1), diffusion capacity for carbon monoxide
DOI: 10.4236/jct.2019.103021 261 Journal of Cancer Therapy
difference between the pre-treatment PFT value and the value at the follow-up appointment was calculated.
2.5. Statistical Analysis
The correlation between the difference in a patient’s lung function and lung density parameters was calculated using Pearson’s correlation (correlation coef-ficient r). Additionally the correlation was analyzed graphically using scatter plots. If statistical outliers were detected those were removed from the analysis. For statistical analysis, SPSS version 24 was used.
3. Results
At 12 weeks after therapy there was a statistically significant correlation between
difference in DLCO and the maximum increase in lung density (ΔHUmax, r =
−0.374, p = 0.007) as well as the difference in TLC and the minimum increase in
lung density (ΔHUmin, r = −0.348, p = 0.012). 6 months after treatment there was
a significant correlation between the difference in VC and DLCO with numerous
lung density parameters, e.g. the mean and median lung density changes
(ΔHUmean and ΔHUmedian). There was no significant correlation between the PFT
parameters FEV1, pCO2 and pO2 and any lung density parameter at any
fol-low-up appointment. Table 2 shows the lung function and lung density
para-meters with a statistically significant correlation with corresponding correlation
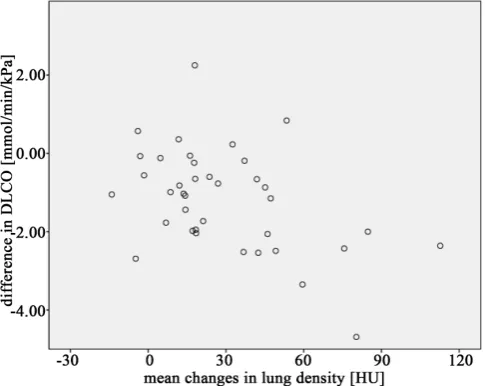
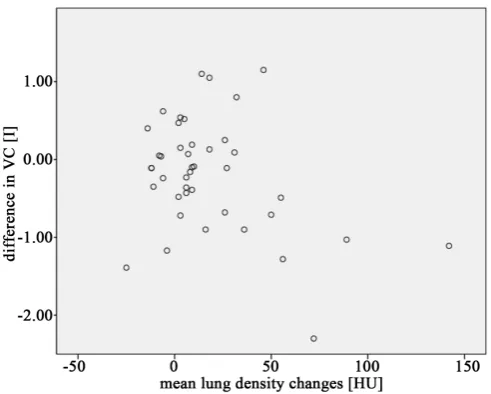
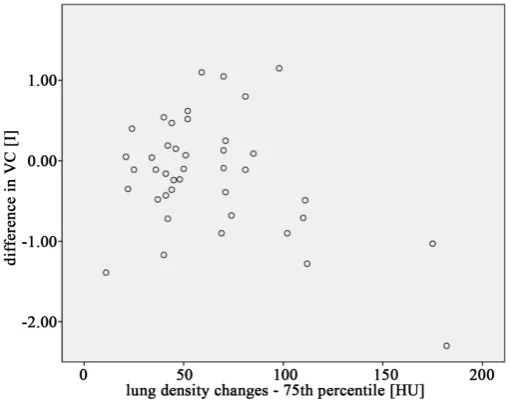
coefficients. Figures 1-6 show the correlation between VC and DLCO with
ΔHUmean, ΔHUmedian and ΔHU75percentile 6 months after treatment.
4. Discussion
12 weeks after treatment only the DLCO and the TLC proved to have a significant
correlation with a lung density parameter, in this case ΔHUmax and ΔHUmin.
[image:5.595.253.496.511.704.2]Es-pecially in case of the correlation of the TLC and ΔHUmin the relevance of this
DOI: 10.4236/jct.2019.103021 262 Journal of Cancer Therapy Figure 2.VC vs. mean ΔHU—6 months post RT (n = 47).
Figure 3.DLCO vs. median ΔHU—6 months post RT (n = 47).
[image:6.595.250.496.510.707.2]DOI: 10.4236/jct.2019.103021 263 Journal of Cancer Therapy Figure 5. DLCO vs. ΔHU 75th percentile—6 months post RT (n = 47).
Figure 6. VC vs.ΔHU 75th percentile—6 months post RT (n = 47).
Table 2.Correlation between the difference lung function and the lung density changes ΔHU 6 months after therapy (n = 47).
lung function parameter lung density parameter correlation coefficient (r) p-value
VC ΔHUmean −0.358 0.022
VC ΔHUmedian −0.349 0.024
VC ΔHU75percentile −0.366 0.018
DLCO ΔHUmean −0.456 0.004
DLCO ΔHUmedian −0.427 0.008
DLCO ΔHU25percentile −0.370 0.022
DLCO ΔHU75percentile −0.433 0.007
[image:7.595.195.542.570.733.2]DOI: 10.4236/jct.2019.103021 264 Journal of Cancer Therapy
correlation is questionable. The problem with both the minimum and maximum density change is that these might be isolated values which do not necessarily represent the overall change in lung density like e.g. the mean or median density change. Therefore they can easily be outliers due to an extreme density change in a volume that might only be the size of a voxel. It is highly unlikely that a vo-lume this size would have any influence on a patient’s PFT, especially the TLC. Furthermore no lung density parameter that represents a larger amount of vox-els like the mean, median or any other percentile proved to have any significant correlation 12 weeks after treatment. However 6 months after treatment both the
DLCO and the VC show a number of significant correlations with several lung
density parameters. At 6 months after RT the predominant toxicity is the radia-tion-induced lung fibrosis whereas the radiation pneumonitis (RP) as the most common radiation induced lung toxicity is more likely to occur in the first 3
months after RT [10] [20]-[26]. A fibrotic remodeling of lung tissue leads to an
increase in lung density, which can be detected in follow-up CT scans [1] [10]
[13]. The DLCO as a diffusion parameter is more sensitive in reflecting RT
in-duced changes in lung tissue [1]-[7] [26] [27]. It is also the PFT parameter that is
commonly reported to show a stable decline after RT [1] [2] [3] [7] [26] [27].
Therefore it is not surprising that there are 5 significant correlations between the
DLCO and lung density parameters. The correlation coefficients however are not
large, but with −0.370 to −0.478 larger that those reported by Ma et al. with a
correlation coefficient ranging from 0.17 to 0.29 [28].
Ventilation parameters like FEV1 and VC are reported to show a more diverse
dynamic after RT [2] [4] [6] [10] [26]. They do not only show a decline, but e.g.
due to the opening of atelectases also an improvement after treatment. Regard-ing the correlation between ventilation parameters and lung density changes Ma
et al. found a significant correlation between FEV1 and the lung density changes
(r = 0.3 - 0.37) and Lind et al. described an greater decline in VC in patients with
a greater lung density increase assed by the Arriagada score [28] [29]. In this
analysis there was no significant correlation between the FEV1 and any lung density parameter 12 weeks or 6 months after RT. There was a significant corre-lation between the VC and several parameters 6 months after RT. The fibrotic remodeling of lung tissue would lead to both an increase in lung density and a decrease in VC. However one would also expect to see a decrease in FEV1 and TLC with a corresponding significant correlation between an increase in ΔHU and a decrease of those PFT parameters as well. The reason there is no signifi-cant correlation for those parameters might be the large dynamic of those values
after RT and the interindividual differences between patients [2] [4] [26].
Limitations of this analysis are certainly the small number of patients given the large interindividual differences regarding both the PFT and the lung density changes. Further trials with a larger patient number are certainly desirable.
5. Conclusion
DOI: 10.4236/jct.2019.103021 265 Journal of Cancer Therapy
TLC and ΔHUmin whose relevance is questionable. However, the significant
cor-relations between the DLCO and VC with several lung density parameters suggest
that both reflect an underlying RT induced change of lung tissue. Especially, the
correlation between the decline in DLCO which shows a loss of diffusion capacity,
possibly due to remodeling of lung tissue and the increase in lung density, which also shows an increase in connective tissue due to remodeling of lung tissue re-flects the effects of RT induced lung fibrosis.
Conflicts of Interest
The authors declare no conflicts of interest regarding the publication of this pa-per.
References
[1] Krengli, M., Sacco, M., Loi, G., Masini, L., Ferrante, D., Gambaro, G., et al. (2008) Pulmonary Changes after Radiotherapy for Conservative Treatment of Breast Can-cer: A Prospective Study. International Journal of Radiation Oncology, Biology, Physics, 70, 1460-1467. https://doi.org/10.1016/j.ijrobp.2007.08.050
[2] Luis Lopez Guerra, J., Gomez, D., Zhuang, Y., Levy, L.B., Eapen, G., Liu, H., et al. (2012) Changes in Pulmonary Function after Three-Dimensional Conformal Radi-otherapy, Intensity-Modulated RadiRadi-otherapy, or Proton Beam Therapy for Non- Small-Cell Lung Cancer. International Journal of Radiation Oncology, Biology, Physics, 83, e537-e543. https://doi.org/10.1016/j.ijrobp.2012.01.019
[3] Borst, G.R., De Jaeger, K., Belderbos, J., Burgers, S.A. and Lebesque, J.V. (2005) Pulmonary Function Changes after Radiotherapy in Non–Small-Cell Lung Cancer Patients with Long-Term Disease-Free Survival. International Journal of Radiation Oncology, Biology, Physics, 62, 639-644.
https://doi.org/10.1016/j.ijrobp.2004.11.029
[4] De Jaeger, K., Seppenwoolde, Y., Boersma, L.J., Muller, S.H., Baas, P., Belderbos, J.S.A., et al. (2003) Pulmonary Function Following High-Dose Radiotherapy of Non-Small-Cell Lung Cancer. International Journal of Radiation Oncology, Biology, Physics, 55, 1331-1340. https://doi.org/10.1016/S0360-3016(02)04389-4
[5] Abratt, R.P. and Willcox, P.A. (1995) The Effect of Irradiation on Lung Function and Perfusion in Patients with Lung Cancer. International Journal of Radiation Oncology, Biology, Physics, 31, 915-919.
https://doi.org/10.1016/0360-3016(94)00513-3
[6] Abratt, R.P. and Morgan, G.W. (2002) Lung Toxicity Following Chest Irradiation in Patients with Lung Cancer. Lung Cancer, 35, 103-109.
https://doi.org/10.1016/S0169-5002(01)00334-8
[7] Erven, K., Weltens, C., Nackaerts, K., Fieuws, S., Decramer, M. and Lievens, Y. (2012) Changes in Pulmonary Function Up to 10 Years after Locoregional Breast Irradiation. International Journal of Radiation Oncology, Biology, Physics, 82, 701- 707. https://doi.org/10.1016/j.ijrobp.2010.12.058
DOI: 10.4236/jct.2019.103021 266 Journal of Cancer Therapy
[9] Fan, M., Marks, L.B., Hollis, D., Bentel, G.G., Anscher, M.S., Sibley, G., et al. (2001) Can We Predict Radiation-Induced Changes in Pulmonary Function Based on the Sum of Predicted Regional Dysfunction? Journal of Clinical Oncology, 19, 543-550.
https://doi.org/10.1200/JCO.2001.19.2.543
[10] Mehta, V. (2005) Radiation Pneumonitis and Pulmonary Fibrosis in Non-Small- Cell Lung Cancer: Pulmonary Function, Prediction, and Prevention. International Journal of Radiation Oncology, Biology, Physics, 63, 5-24.
https://doi.org/10.1016/j.ijrobp.2005.03.047
[11] De Ruysscher, D., Sharifi, H., Defraene, G., Kerns, S.L., Christiaens, M., De Ruyck, K., et al. (2013) Quantification of Radiation-Induced Lung Damage with CT Scans: The Possible Benefit for Radiogenomics. Acta Oncologica, 52, 1405-1410.
https://doi.org/10.3109/0284186X.2013.813074
[12] Bernchou, U., Schytte, T., Bertelsen, A. and Bentzen, S.M. (2013) Time Evolution of Regional CT Density Changes in Normal Lung after IMRT for NSCLC. Radiothe-rapy and Oncology, 109, 89-94. https://doi.org/10.1016/j.radonc.2013.08.041
[13] Phernambucq, E.C.J., Palma, D.A., Vincent, A., Smit, E.F. and Senan, S. (2011) Time and Dose-Related Changes in Radiological Lung Density after Concurrent Chemoradiotherapy for Lung Cancer. Lung Cancer, 74, 451-456.
https://doi.org/10.1016/j.lungcan.2011.05.010
[14] Palma, D.A., van Sörnsen de Koste, J.R., Verbakel, W.F.A.R. and Senan, S. (2011) A New Approach to Quantifying Lung Damage after Stereotactic Body Radiation Therapy. Acta Oncologica, 50, 509-517.
https://doi.org/10.3109/0284186X.2010.541934
[15] Ma, J., Zhang, J., Zhou, S., Hubbs, J.L., Foltz, R.J., Hollis, D.R., et al. (2010) Regional Lung Density Changes after Radiation Therapy for Tumors in and Around Thorax. International Journal of Radiation Oncology, Biology, Physics, 76, 116-122.
https://doi.org/10.1016/j.ijrobp.2009.01.025
[16] Bertelsen, A., Schytte, T., Bentzen, S.M., Hansen, O., Nielsen, M. and Brink, C. (2011) Radiation Dose Response of Normal Lung Assessed by Cone Beam CT—A Potential Tool for Biologically Adaptive Radiation Therapy. Radiotherapy and On-cology, 100, 351-355. https://doi.org/10.1016/j.radonc.2011.08.012
[17] Vågane, R., Danielsen, T., Fosså, S.D., Løkkevik, E. and Olsen, D.R. (2009) Late Re-gional Density Changes of the Lung after Radiotherapy for Breast Cancer. Radio-therapy and Oncology, 90, 148-152. https://doi.org/10.1016/j.radonc.2007.12.031
[18] Seppenwoolde, Y., Muller, S.H., Theuws, J., Baas, P., Belderbos, J., Boersma, L.J., et al. (2000) Radiation Dose-Effect Relations and Local Recovery in Perfusion for Patients with Non–Small-Cell Lung Cancer. International Journal of Radiation Oncology, Biology, Physics, 47, 681-690. https://doi.org/10.1016/S0360-3016(00)00454-5
[19] Wennberg, B., Gagliardi, G., Sundbom, L., Svane, G. and Lind, P. (2002) Early Re-sponse of Lung in Breast Cancer Irradiation: Radiologic Density Changes Measured by CT and Symptomatic Radiation Pneumonitis. International Journal of Radiation Oncology, Biology, Physics, 52, 1196-1206.
https://doi.org/10.1016/S0360-3016(01)02770-5
[20] Mazeron, R., Etienne-Mastroianni, B., Pérol, D., Arpin, D., Vincent, M., Falchero, L., et al. (2010) Predictive Factors of Late Radiation Fibrosis: A Prospective Study in Non-Small Cell Lung Cancer. International Journal of Radiation Oncology, Biology, Physics, 77, 38-43. https://doi.org/10.1016/j.ijrobp.2009.04.019
Pa-DOI: 10.4236/jct.2019.103021 267 Journal of Cancer Therapy
tients with Non–Small-Cell Lung Cancer (NSCLC): Predictors for Radiation Pneu-monitis and Fibrosis. International Journal of Radiation Oncology, Biology, Physics, 65, 1075-1086. https://doi.org/10.1016/j.ijrobp.2006.01.051
[22] Robnett, T.J., Machtay, M., Vines, E.F., McKenna, M.G., Algazy, K. and Gillies McKenna, W. (2000) Factors Predicting Severe Radiation Pneumonitis in Patients Receiving Definitive Chemoradiation for Lung Cancer. International Journal of Radiation Oncology, Biology, Physics, 48, 89-94.
https://doi.org/10.1016/S0360-3016(00)00648-9
[23] Leprieur, E.G., Fernandez, D., Chatellier, G., Klotz, S., Giraud, P. and Durdux, C. (2013) Acute Radiation Pneumonitis after Conformational Radiotherapy for Non-small Cell Lung Cancer: Clinical, Dosimetric, and Associated-Treatment Risk Fac-tors. Journal of Cancer Research and Therapeutics, 9, 447-451.
https://doi.org/10.4103/0973-1482.119339
[24] Hernando, M.L., Marks, L.B., Bentel, G., Zhou, S.-M., Hollis, D., Das, S.K., et al. (2001) Radiation-Induced Pulmonary Toxicity: A Dose-Volume Histogram Analy-sis in 201 Patients with Lung Cancer. International Journal of Radiation Oncology, Biology, Physics, 51, 650-659. https://doi.org/10.1016/S0360-3016(01)01685-6
[25] Luis Lopez Guerra, J., Gomez, D., Zhuang, Y., Levy, L.B., Eapen, G., Liu, H., et al. (2012) Change in Diffusing Capacity after Radiation as an Objective Measure for Grading Radiation Pneumonitis in Patients Treated for Non-Small-Cell Lung Can-cer. International Journal of Radiation Oncology, Biology, Physics, 83, 1573-1579.
https://doi.org/10.1016/j.ijrobp.2011.10.065
[26] Schröder, C., Engenhart-Cabillic, R., Vorwerk, H., Schmidt, M., Huhnt, W., Blank, E., et al. (2017) Changes in Pulmonary Function and Influencing Factors after High-Dose Intrathoracic Radio(Chemo)Therapy. Strahlentherapie und Onkologie, 193, 125-131. https://doi.org/10.1007/s00066-016-1067-8
[27] Jaen, J., Vazquez, G., Alonso, E., De Las Penas, M.D., Diaz, L., et al. (2012) Long- term Changes in Pulmonary Function after Incidental Lung Irradiation for Breast Cancer: A Prospective Study with 7-Year Follow-Up. International Journal of Radiation Oncology, Biology, Physics, 84, e565-e570.
https://doi.org/10.1016/j.ijrobp.2012.07.003
[28] Ma, J., Zhang, J., Zhou, S., Hubbs, J.L., Foltz, R.J., Hollis, D.R., et al. (2009) Associa-tion between RT-Induced Changes in Lung Tissue Density and Global Lung Func-tion. International Journal of Radiation Oncology, Biology, Physics, 74, 781-789.
https://doi.org/10.1016/j.ijrobp.2008.08.053
[29] Lind, P.A., Svane, G., Gagliardi, G. and Svensson, C. (1999) Abnormalities by Pulmonary Regions Studied with Computer Tomography Following Local or Local- Regional Radiotherapy for Breast Cancer. International Journal of Radiation On- cology, Biology, Physics, 43, 489-496.