Models incorporating chromatin modification data
identify functionally important p53 binding sites
Ji-Hyun Lim
1,2, Richard D. Iggo
2,3,* and Daniel Barker
1,*
1
Sir Harold Mitchell Building, School of Biology, University of St Andrews, St Andrews, Fife, KY16 9TH, UK,
2
School of Medicine, University of St Andrews, Fife, KY16 9TF, UK and 3INSERM U916, Bergonie Cancer Institute, University of Bordeaux, 229 Cours de l’Argonne, 33076 Bordeaux, France
Received January 18, 2013; Revised March 19, 2013; Accepted March 21, 2013
ABSTRACT
Genome-wide prediction of transcription factor binding sites is notoriously difficult. We have de-veloped and applied a logistic regression approach for prediction of binding sites for the p53 transcrip-tion factor that incorporates sequence informatranscrip-tion and chromatin modification data. We tested this by comparison of predicted sites with known binding sites defined by chromatin immunoprecipitation (ChIP), by the location of predictions relative to genes, by the function of nearby genes and by analysis of gene expression data after p53 activa-tion. We compared the predictions made by our
novel model with predictions based only on
matches to a sequence position weight matrix (PWM). In whole genome assays, the fraction of known sites identified by the two models was similar, suggesting that there was little to be gained from including chromatin modification data. In contrast, there were highly significant and bio-logically relevant differences between the two models in the location of the predicted binding sites relative to genes, in the function of nearby genes and in the responsiveness of nearby genes to p53 activation. We propose that these contradict-ory results can be explained by PWM and ChIP data reflecting primarily biophysical properties of
protein–DNA interactions, whereas chromatin
modification data capture biologically important functional information.
INTRODUCTION
Two mechanisms have come to dominate our understand-ing of gene regulation: bindunderstand-ing of transcription factors to short DNA sequences, and binding of microRNAs to short RNA sequences. The primary information dictating the
choice of binding site in both cases lies in the genomic DNA sequence. For microRNAs the detection problem is relatively simple because the binding sites must lie some-where within the transcript, and they typically lie within an even smaller region spanning only a few hundreds or thou-sands of bases in the untranslated regions of the mRNA. For transcription factors, the problem is vastly more diffi-cult because binding sites can lie over 1 Mb from the gene they regulate, although chromatin interaction analysis with pair-end tag sequencing (ChIA-PET) data for oestrogen receptor alpha (ER-a) suggest most binding sites are located within 100 kb of the gene (1). Despite the difficulty, genome-wide mapping of transcription factor binding sites is fundamental to understanding gene regulation and it remains an important goal in bioinformatics.
The p53 tumor suppressor gene (TP53) encodes a tran-scription factor that binds directly to DNA and activates transcription in response to a wide range of different stresses (2–4). p53 is a critical defense against cancer, and loss of p53 function through TP53 mutation occurs in more than half of all human tumors (5). p53 target genes are implicated in a wide range of functions of which the best known are cell cycle control and cell death (6). p53 binds to DNA as a dimer of dimers. Each core domain dimer binds to a decamer that is described by the palindromic regular expression pattern [AG][AG][AG]C[AT][TA]G[TC][TC][TC] (7), where ‘[AG]’, for example, matches either of the two bases ‘A’ and ‘G’. A p53 response element (RE) typically contains two decamers that are either directly adjacent or separated by a spacer up to 13 bp in length or occasionally longer (3,7).
As is typical for a transcription factor binding site, the p53 binding motif is short and degenerate. In large genomes, approximate matches to the motif are found in extremely large numbers. From the point of view of pre-dicting functional binding sites, most of these matches are false positives. Despite decades of study covering a wide range of different transcription factors, identification of binding sites purely on the basis of sequence has not
*To whom correspondence should be addressed. Tel: +44 1334 463598; Fax: +44 1334 463366; Email: [email protected]
Correspondence may also be addressed to Richard Iggo. Tel: +33 5 56 33 04 23; Fax: +33 5 56 33 32 06; Email: [email protected]
ßThe Author(s) 2013. Published by Oxford University Press.
This is an Open Access article distributed under the terms of the Creative Commons Attribution Non-Commercial License (http://creativecommons.org/licenses/ by-nc/3.0/), which permits non-commercial re-use, distribution, and reproduction in any medium, provided the original work is properly cited. For commercial re-use, please contact [email protected]
at St Andrews University Library on July 30, 2013
http://nar.oxfordjournals.org/
yielded predictions that could plausibly be extrapolated to a genome-wide scale. Hence, further progress in the field will almost certainly require the inclusion of additional types of information to reduce the number of false-positive predic-tions. Computational sequence-based approaches to predict binding sites include position weight matrices (PWMs) (8–16), hidden Markov models (17–19) and support vector machines (20,21). Compared with a simple regular expression, these more accurately represent the extent of variation at specific base positions in the binding sequence. However, the short length of the sequence still leaves a large number of false positive predictions. One promising approach for improved predictions is to combine evidence from DNA sequence with evidence as to whether the genomic location is ever likely to act as a regulatory region (20,22,23). Chromatin architecture is a critical regulator of transcription factor binding and activity. Specific histone modifying enzymes recruited by p53 directly affect gene expression (24,25). The two histone arginine methyltransferases CARM1 and PRMT1, which methylate Arg2, Arg17 and Arg26 of histone H3 and Arg3 of histone H4, have been shown to act as coactivators by directly interacting with p53 and its associated cofactor p300 (24,26). Several groups have pre-viously attempted to incorporate histone modification data into transcription factor binding site mapping algorithms. Wonet al.(23) developed a hidden Markov model–based approach, combining sequence information with chromatin immunoprecipitation sequencing (ChIP-seq) signals of histone modifications at promoter and enhancer regions to detect functional sequence patterns. Ernstet al.
(22) described a logistic regression-based method to arrive at a ‘general binding preference’ for DNA on the basis of 29 input features, including the distance to nearest transcrip-tional start site, information on conservation and levels of histone modifications, followed by use of a PWM to predict which specific transcription factor is involved. However, despite success with several other transcription factors, the authors found the ability of this method to predict p53 binding sites was low (22).
In this article, we present a multiple logistic regression approach that integrates DNA sequence information and histone modification data to model p53 binding on a genome-wide scale. Unexpectedly, our combined-evidence model shows similar performance to a sequence-only (PWM) model in tests strictly limited to DNA–protein interactions, but is much better at predict-ing functionally important p53 bindpredict-ing sites.
MATERIALS AND METHODS
Data for training and testing
The set of 1757 p53 binding sites used to train and test our binary logistic regression model contained 1422 sites from Smeenket al.(27), 327 sites from Weiet al.(28) and 8 sites from Horvathet al.(29). To avoid redundancy, we deleted 123 sites from (27) because they were also present in (28). The overlap between the two main data sources is analyzed in Supplementary Table S1. To avoid overfitting when building the model, we included eight validated p53
binding sites from (29) that differed from the known p53 consensus sequence (Supplementary Table S2). For the ChIP-PET data (28), we extracted the hg17 coordinates of all clusters with three or more overlapping DNA frag-ments (PET-3+ clusters) from UCSC (http://genome.ucsc. edu) (30,31) via MySQL (genome-mysql.cse.ucsc.edu). The genome-wide ChIP-on-chip binding data were supplied directly by the authors (27). Because these data were based on NCBI36 coordinates, we mapped them to hg17 using nucleotide–nucleotide BLAST (32) with a database of human genomic DNA from release 35 of Ensembl (33). To determine the precise locations of binding sites within ChIP-based binding regions, we scanned the ChIP sequences for matches to PFM M01651 in the TRANSFAC database (BioBase Corporation; www. biobase-international.com/transcription-factor-binding-sites). We split this 20-mer motif into two component half sites, and searched both strands of the DNA for matches to each half site using FIMO (34) in the MEME package (35). Two decamer half sites were regarded as a match to the full binding site if they were directly adjacent or separated by a spacer of at most 13 bp. The score of a full site was determined as the sum of the individual scores for its half sites. The full site with the highest score was selected to represent the p53 binding site within the ChIP sequence.
The 1757 p53 binding sites were split into training and testing sets. Half of the binding sites from each study were randomly taken as positive training data and the remain-ing half were used as positive test data. In addition, we generated the same proportion of negative data for training and testing. We generated the negative sites by randomly selecting repeat-free regions from protein-coding regions of exons within the human genome in Ensembl release 35, on the assumption that p53 binding sites are rare in coding exons (3). The length (bp) of spacer between the two half sites of each negative sequence was chosen using the ‘random_uniform_integer’ function in the Math::Random Perl module to select an integer in the range 0–13 with equal probability. Training and test data are given in Supplementary Datasets S1 and S2.
Model input
The predictor variables considered in the combined-evidence model are listed in Supplementary Table S3. For the combined-evidence model, logistic regression was used as our prediction method. This is suited to a binary response (y= 1 if a given site is a p53 binding site; y= 0 if a given site is not a p53 binding site) and reports coefficients for all predictors, allowing biological interpretation.
Histone modification ChIP-seq data for histone 3 lysine 4 monomethylation (H3K4me1), dimethylation (H3K4me2) and trimethylation (H3K4me3) in the HMEC, HUVEC, NHEK and NHLF cell strains and for H3K4me2 and H3K4me3 in the HepG2 cell line were obtained from ENCODE/Broad Institute via the UCSC Genome Browser. All four cell strains and the HepG2 cell line are known to express wild-type p53. The coordinates of the 36 589 enhancers recently predicted
at St Andrews University Library on July 30, 2013
http://nar.oxfordjournals.org/
via chromatin signatures (36) were downloaded from the Ren Lab Web site. The hg18 coordinates of histone modi-fications and enhancers were converted to hg17 coordin-ates using the LiftOver tool on the UCSC Genome Browser (http://genome.ucsc.edu/cgi-bin/hgLiftOver).
The primary structure-based predictors considered were
decamer1_score, representing FIMO score for first half site; decamer2_score, representing FIMO score for second half site;pair_score, representing FIMO score for the full binding site; and spacer, representing spacer length. Preliminary analyses were performed using binary and continuous encodings of these predictors. The non-sequence predictors considered werein_enhancer, representing full or partial overlap with enhancer chroma-tin signatures, and in_H3K4me1, in_H3K4me2 and
in_H3K4me3, representing overlap with H3K4me1,
H3K4me2 and H3K4me3 signals, respectively. Non-sequence predictors were encoded as binary variables (1 for overlap and 0 for no overlap).
The sequence-only model used a single predictor, the continuously encoded pair_score, obtained as for the combined-evidence model. This is equivalent to using the 20-mer PWM and allowing a zero-penalty gap of up to 13 bp between bases 10 and 11.
Training and testing
To avoid difficulties with complete or quasi-complete sep-aration or numerical problems in the standard generalized linear model, which relies on maximum likelihood estima-tion, we used penalized likelihood (Firth logistic regres-sion), implemented in the ‘logistf’ function in the ‘logistf’ package (37,38) in R (39). We used backward elimination, starting with a model that included the binary non-sequence predictors and continuous encoding of the primary structure-based predictors pair_score and spacer
with its quadratic term (Supplementary Table S3), and sequentially removed the least important predictors (the ones with the largestP values) until no further improve-ment of the model could be achieved. The remaining pre-dictor variables in the combined-evidence model had individual P values that were less than or close to 0.05, indicating some evidence of statistical significance. The final combined-evidence model was compared with the sequence-only model. We evaluated the quality of the models using the testing dataset. The maximized sum threshold (MST), which gave the best sensitivity (true positive rate or recall) and specificity (true negative rate) on the training dataset, was used as the cutoff for categorizing the predictions obtained from the testing dataset.
Location of genome-wide predictions
Starting at the first position in the genomic sequence we used a sliding window of size 20–33 bp to retrieve all pairs of potential decameric sites separated by a spacer of 0– 13 bp. For each pair of such decameric sites in the human genome, we estimated the probability of being a p53 binding site based on the combined-evidence model. We identified the location of our predictions in the human genome relative to Ensembl genes that are not single-exon
genes and grouped the binding sites into six categories: intragenic (all introns and exons except the first exon and intron), flanking the transcription start site (TSS) (first intron, first exon and 5 kb upstream of TSS), 5 kb downstream (5 kb downstream of last exon), 5–25 kb downstream, 5–25 kb upstream and intergenic regions. A distinction between protein coding region and untrans-lated region was not made. The categories were based on (27) with the exception that we did not merge 5– 25 kb downstream and 5–25 kb upstream regions together as one classification group. G tests were used to compare the distribution of sets of predictions across these genomic categories, between each prediction set and ex-pectations from the proportions of the genome in each category, between pairs of prediction sets, and between positive training data and prediction sets.
The predicted p53 binding sites were assigned to their nearest genes using the Ensembl Perl API (Ensembl release 35). If a prediction was located within the transcribed region of a gene, that gene was considered as the nearest gene. If not within a transcribed region, the prediction was determined to have two nearest genes, one up- and one downstream, that overlapped the 150 kb flanking region at both the 50and 30ends of the prediction.
Those predictions that were>150 kb away from any gene were regarded as having no nearest gene. Non-redundant lists of unique nearest genes were functionally analyzed using Gene Ontology (GO) ‘biological process’ categories (40) and KEGG pathways (41). For given gene lists, stat-istically enriched GO terms were detected using DAVID (http://david.abcc.ncifcrf.gov) (42,43).
Gene set enrichment analysis of genome-wide predictions
To detect any tendency of binding sites predicted by the two models to be in or near genes up- or downregulated by p53, gene set enrichment analysis (GSEA) of a p53 acti-vation experiment was performed. The HCT116 cell line contains wild-type p53 and has been extensively used to study gene expression changes following p53 activation. The .cel files for an Affymetrix microarray experiment in which HCT116 cells were treated with 5-fluorouracil (5FU) to activate p53 were downloaded from GEO, ac-cession GSE36593 (44). The .cel files were normalized for ‘core’ transcripts with ‘rma’ in the ‘oligo’ package in R, then differentially expressed genes were ranked byt stat-istic generated by contrasting control with 5FU-treated cells with the ‘limma’ package (45). GSEA plots were created in R without weighting the step size by thet stat-istic. To create the gene sets, the predictions from the models were ordered by logit score (combined evidence) or bit score (sequence only). To determine whether mean-ingful predictions were concentrated at the top of the pre-diction lists, progressively larger gene sets were tested, in steps of 100 genes. To test the significance of the GSEA enrichment score, the gene ranking from limma was permuted 100 000 times to generate a null distribution for the enrichment scores, which was compared with the observed enrichment using both a Normal assumption (Z
score) and a direct comparison with the empirical null distribution (quantile).
at St Andrews University Library on July 30, 2013
http://nar.oxfordjournals.org/
RESULTS
A logistic regression model to predict p53 binding sites
The final reduced model using combined sources of evidence includes the following continuous inputs: the quality of the match to the p53 decamer RE expressed as the sum of the PWM scores for the two constituent decamers; and the spacer length between the decamers, up to a maximum of 13 bp. We refer to these inputs as
pair_score.cont and spacer.cont, respectively. The final model also includes the following binary inputs, where 1 indicates overlap and 0 indicates no overlap: monomethylation of lysine 4 in histone 3, in the NHLF
(in_NhlfH3K4me1) and NHEK (in_NhekH3K4me1)
cell strains; and trimethylation of lysine 4 in histone 3,
in the NHEK (in_NhekH3K4me3) and HUVEC
(in_HuvecH3K4me3) cell strains. Binary logistic regression combines the inputs to create a logit score. The logit score is a log likelihood ratio, positive when the model predicts a region of the genome is a p53 binding site (y= 1) and negative when the model predicts a region is not a p53 binding site (y= 0). The logit score may be converted to a probability (46), with higher logit scores representing higher probability that a region is a p53 binding site. The logit score for the final reduced model, using combined evidence, is given as follows:
logit½P yð ¼1Þ ¼3:9932+0:8391pair score:cont
1:5315spacer:cont
+0:1039spacer:cont2
+3:6782in NhlfH3K4me1 +5:6133in NhekH3K4me1 7:0282in NhekH3K4me3
+5:9039in HuvecH3K4me3
ð1Þ
A Perl script to apply this model is provided as Supplementary Script 1.
Positive coefficients in the model indicate positive evidence for a site being a functional p53 binding site. Interestingly, one of the coefficients for histone H3 K4 trimethylation in the model is negative, indicating that— in the context of the model as a whole—penalizing these sites improves performance. This makes sense because the strongest signals for trimethylation of histone H3 K4 are found at TSSs independently of p53. The other coefficient for H3 K4 trimethylation in the model is positive, presum-ably because this histone mark is also found to a lesser extent at enhancers.
Training and testing
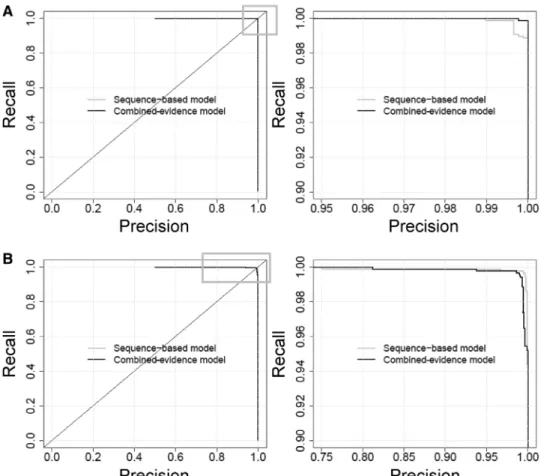
The MST was used to choose the threshold at which to evaluate the performance of the model on the training and testing data. At a logit cutoff of 0.4422 (probability cutoff of 0.6087938), the combined-evidence model achieved a sensitivity of 0.9989, a specificity of 1 and an area under the receiver operating characteristic curve (AUC) of 0.9999974 for the training data. The correspond-ing figures for the test data were sensitivity = 0.9943, spe-cificity = 0.9932 and AUC = 0.9994. In the test data, five
out of the 878 positive sites (including three of the sites shown in Supplementary Table S2 that were included to increase variability) and six out of the 878 negative sites were misclassified by the combined-evidence model. At its MST (bit-score cutoff 3.8731), the sequence-only model achieved a sensitivity of 0.9989, specificity of 0.9966 and AUC of 0.9999573 for the training data, and a sensitivity of 0.9966, specificity of 0.9954 and AUC of 0.9995 for the test data. Precision-recall plots also show high perform-ance for both models, with both training and test data (Figure 1). We conclude from this that there is no gain from including additional predictors in the model when dealing with a small dataset that is highly enriched in p53 binding sites.
Genome-wide prediction of p53 binding sites
It has been estimated that there may be 3000 functional p53 binding sites in the human genome (27). Allowing a binding site to start at any base and including a spacer of length 0 to 13 bp, a priori the number of sites in the human genome where a binding site could potentially occur (which must be at least considered when making computational predic-tions) is the number of nucleotides in the genome multiplied by 14, or 41010 potential binding sites. True binding sites thus represent<1 in 107potential sites. Identification of functional binding sites in the whole genome is thus far more difficult than in small preselected datasets because of the vastly greater number of false positives expected at all levels of sensitivity. For this reason, we suspected that the difference in performance of the combined-evidence and sequence-only models would be greater in genome-wide analyses than in the test dataset. To evaluate the benefit of including modification data, we used the sequence-only and combined-evidence models to predict p53 binding at levels of stringency chosen to give300, 3000 and 30 000 predicted sites. For each prediction method, we refer to these three sets of predictions as the ‘stringent’, ‘intermedi-ate’ and ‘large’ sets, respectively. The ‘large’ set was expected to contain a large fraction of the true p53 binding sites in the genome, whereas the ‘stringent’ set was used to find out whether extreme scores would enrich for the best sites. The thresholds (logit score) used for the combined-evidence model were 30.9749, 27.1470 and 22.5783 for the stringent, intermediate and large sets, re-spectively, yielding 305, 2999 and 30 000 predicted binding sites. The thresholds (bit score) used for the sequence-only model were 24.7577, 21.6901 and 17.97233 for the stringent, intermediate and large sets, respectively, yielding 305, 2998 and 30 006 predicted binding sites. The sets of predictions for each model are provided as Supplementary Material (Supplementary Datasets S3–S8). The combined-evidence model gives high scores for a range of ‘classic’ p53 binding sites (Supplementary Table S4).
As expected, the sequence logos of the p53 binding sites predicted by both models closely resembled the known p53 consensus, [AG][AG][AG]C[AT][TA]G[TC][TC][TC] (Figure 2).
The combined model showed no strong single nucleo-tide preferences other than for the invariant C or G in the fourth and seventh base position in the decamers,
at St Andrews University Library on July 30, 2013
http://nar.oxfordjournals.org/
corresponding to the fourth positions in the primary DNA pentamers that bind to p53 protein monomers. In contrast, the sequence-only model showed a preference for G at the second position in the primary pentamers
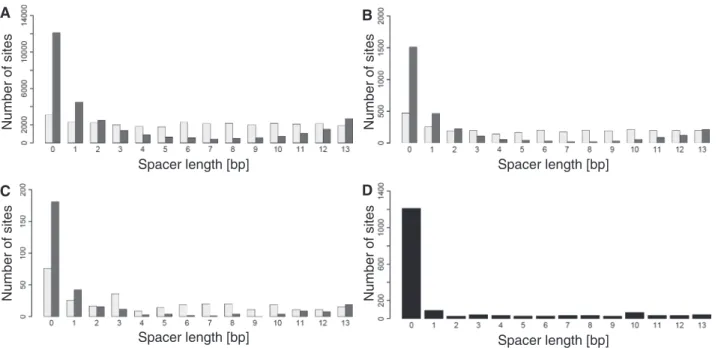
and for AT in the middle of the decamers. Both models showed a preference for no spacer between the decamers, although this effect was stronger for the combined-evidence model (Figure 3). The combined-combined-evidence
Figure 1. Precision-recall curves for (A) the training data and (B) the test data, for the combined-evidence and sequence-only models. To distinguish the performance of the two methods, the varying areas of the full plots on the left side (highlighted with a gray box) are re-plotted at higher magnification (right side).
A B C
D E F
Position
Information content
1 2 3 4 5 6 7 8 9 10 11 12 13 14 15 16 17 18 19 20 2
1.5
0.5
0
Position
Information content
1 2 3 4 5 6 7 8 9 10 11 12 13 14 15 16 17 18 19 20 2
1.5
0.5
0
Position
Information content
1 2 3 4 5 6 7 8 9 10 11 12 13 14 15 16 17 18 19 20 2
1.5
0.5
0
Position
Information content
1 2 3 4 5 6 7 8 9 10 11 12 13 14 15 16 17 18 19 20 2
1.5
0.5
0
Position
Information content
1 2 3 4 5 6 7 8 9 10 11 12 13 14 15 16 17 18 19 20 2
1.5
0.5
0
Position
Information content
1 2 3 4 5 6 7 8 9 10 11 12 13 14 15 16 17 18 19 20 2
1.5
0.5
0
Figure 2. Sequence logos for the predicted p53 binding sites. Combined-evidence model: (A) large set, (B) intermediate set and (C) stringent set of predictions. Sequence-only model: (D) large set, (E) intermediate set and (F) stringent set of predictions. For clarity, spacers between the two decamers were removed for generation of the logos. Any spacer would appear between bases 10 and 11. The logos were generated with the ‘seqLogo’ package for R.
at St Andrews University Library on July 30, 2013
http://nar.oxfordjournals.org/
model includes spacer length as an input, and hence it is expected to better match the training data in this respect (Equation 1). Interestingly, the combined-evidence model showed a progressive fall in the number of sites up to a spacer length of eight base pairs, followed by an increase. Recent structural studies explain the preference for having no spacer (47). In the absence of a spacer, the p53 dimers pack together with a much larger buried surface area and form interdimer salt bridges between 180E and 181R in helix 1. An increase in electrostatic potential induced by minor groove narrowing at Hoogsteen base pairs further improves binding through strengthening the interaction with the positively charged 248R side chain. Early studies showed that spacers of 5 or 15 bp reduced p53 binding and transactivation, whereas spacers of 10 bp did not (48). This phasing behavior was interpreted as indicating a preference for the core DNA binding domain dimers within the p53 tetramer to be placed on the same side of the DNA helix. Consistent with this, the Smeenket al.ChIP-on-chip study showed a greater abun-dance of sites with spacers of length 10 bp than other lengths in the range 2–13 bp (27) but most studies would not support a role for phasing as a major constraint on DNA binding [reviewed in (3)].
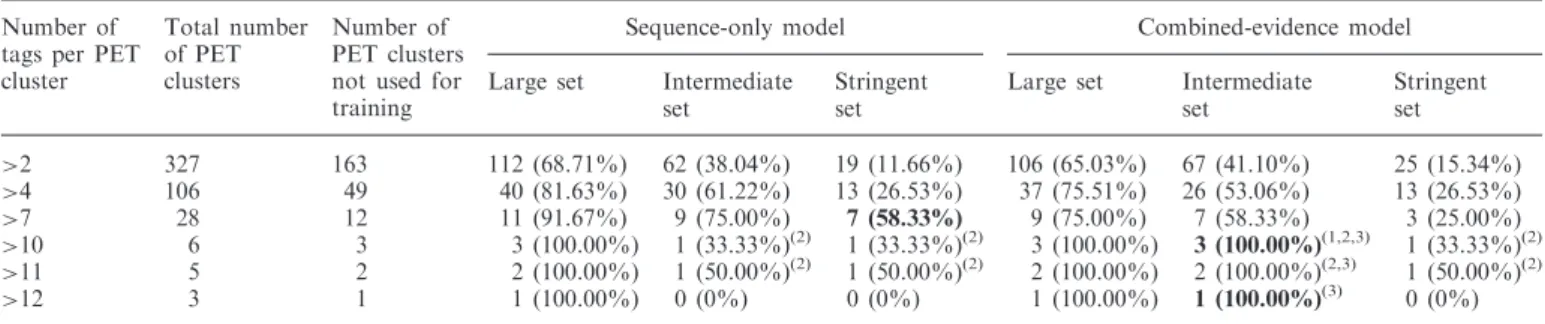
To test the quality of our genome-wide predictions, we first checked the degree of overlap with sites of p53 binding defined experimentally by ChIP-on-chip (27) and ChIP-PET (28). To avoid overestimating the degree of overlap, binding sites present in the training set were excluded from this comparison. For the ChIP-on-chip data, the combined-evidence model discovered a higher proportion of sites than the sequence-only model, at each of the three sizes of prediction set (Table 1). The ChIP-PET dataset (28) lists the number of PET tags per site, a surrogate measure of DNA binding affinity or
enhancer occupancy. With the intermediate prediction sets, the models identified 41.10% (combined evidence) or 38.04% (sequence only) of the ChIP-PET binding sites; with the stringent sets, they identified 15.34% (combined evidence) or 11.66% (sequence only) of the ChIP-PET sites. Table 2 shows that sensitivity was slightly better for sites in PET clusters with a greater number of tags, but sites in the stringent set were not se-lectively enriched for clusters with higher numbers of tags. For the combined-evidence model to identify90% of the ChIP-PET sites, we estimate that a prediction set contain-ing >1 000 000 predicted binding sites would be required (Supplementary Table S6). The benefit was slightly greater for the ChIP-on-chip than for the ChIP-PET sites, perhaps because of the larger number of ChIP-on-chip than ChIP-PET sites used to train the model. Overall, these results show curiously little gain in sensitivity from inclusion of modification and spacing data in the model. This highlights the primacy of DNA sequence in determining DNA binding by p53, even when modifica-tion data are included, but the failure of either model to identify some sites indicates that binding to non-consensus sequences, possibly bridged by another protein (49), may be responsible for recruitment to a substantial number of enhancers.
Location of predicted binding sites relative to genes
An ideal method would identify sites with the following properties: they would differ from randomly chosen sites; they would differ from sites predicted by less effective methods; and they would resemble the sites in the positive training dataset. To test these assumptions, the genome was divided into six categories or regions: intergenic, intragenic, flanking the TSS, 5 kb downstream, 5–25 kb upstream and 5–25 kb downstream. The null
A B
C D
Number of sites
Number of sites
Spacer length [bp]
Spacer length [bp]
Number of sites
Number of sites
Spacer length [bp]
Spacer length [bp]
Figure 3. Spacer length distribution of the sites predicted by the sequence-only model (light gray) and the combined-evidence model (dark gray) for (A) large sets, (B) intermediate sets and (C) stringent sets of predictions, and for the full positive data (D).
at St Andrews University Library on July 30, 2013
http://nar.oxfordjournals.org/
expectation for a model that predicted binding sites at random is that the fraction of predictions in a category should match the fraction of the genome in that category. The overall assignment of binding sites to the six categories departed from the null expectation for all three sets of predictions made by both models. In general, there was enrichment for genes and neighboring regions, and se-lection against intergenic regions (Figure 4; Supplementary Tables S7 and S8). For the combined-evidence model, the departure from the null expectation was more extreme, with far fewer predictions in intergenic regions than were made by the sequence-only model (Figure 4). This difference between the two models was statistically significant (large sets G= 2722.46, 5df, P<2.21016; intermediate sets
G= 218.81, P<2.21016; stringent sets G= 30.34,
P= 1.26105).
Compared with the positive training dataset, there was no significant difference in the location of sites relative to genes for the stringent set predicted by the combined-evidence model (G= 8.06, 5df, P= 0.15), but there were significant differences for the other comparisons for both the combined-evidence model (large set
G= 70.20, P= 9.31014; intermediate set G= 40.29,
P= 1.3107) and for the sequence-only model (large set G= 23.56, P= 2.64104; intermediate set
G= 18.19, P= 2.72103
; stringent set G= 23.04,
P= 3.31104 ).
At the level of individual regions, the differences between the combined-evidence model and the sequence-only model were significant in the large set for the intragenic, TSS, 5 kb downstream, 5–25 kb upstream and intergenic regions (Supplementary Table S9). In the inter-mediate and stringent sets, the differences were signifi-cant for the intragenic, TSS and intergenic regions (Supplementary Table S9).
In summary, both models made predictions that were not randomly placed relative to genes. The combined-evidence and sequence-only models made different predic-tions, showing that the models were not equivalent. At the stringent cutoff, the sites predicted by the combined-evidence model were not significantly different from those in the positive training dataset, whereas those pre-dicted by the sequence-only model did differ from the sites in the positive training dataset. These results are consistent with both models working to some extent, and the combined-evidence model making better predictions than the sequence-only model.
Functional annotation of genome-wide predictions
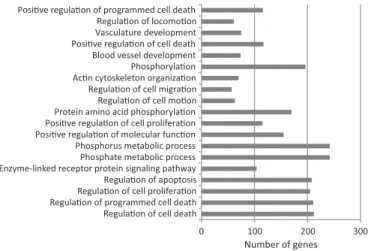
To test whether the genes identified by the combined-evidence model have functions commonly associated with p53, we tested the intermediate sets of predictions for enrichment in relevant GO biological process and KEGG pathway terms. For the combined-evidence model, there was an enrichment for biological process terms linked to cell death and metabolism (Figure 5; Supplementary Table S10) and an enrichment for KEGG pathway terms linked to cancer, including the specific category ‘p53 signaling pathway’ (Figure 6; Supplementary Table S11). In contrast, the top biological process terms for the sequence-only model did not include ‘regulation of apoptosis’, ‘regulation of cell death’ or ‘regulation of programmed cell death’ (Figure 7; Supplementary Table S12). Instead, the top biological process terms were linked to neural differentiation. The KEGG pathways highlighted by the sequence-only model did include ‘p53 signaling pathway’ but did not include the other cancer pathways identified by the
Table 2. ChIP-PET sites in the test set predicted to be p53 binding sites by the sequence-only and combined-evidence models
Number of tags per PET cluster
Total number of PET clusters
Number of PET clusters not used for training
Sequence-only model Combined-evidence model
Large set Intermediate
set
Stringent set
Large set Intermediate
set
Stringent set
>2 327 163 112 (68.71%) 62 (38.04%) 19 (11.66%) 106 (65.03%) 67 (41.10%) 25 (15.34%)
>4 106 49 40 (81.63%) 30 (61.22%) 13 (26.53%) 37 (75.51%) 26 (53.06%) 13 (26.53%)
>7 28 12 11 (91.67%) 9 (75.00%) 7 (58.33%) 9 (75.00%) 7 (58.33%) 3 (25.00%)
>10 6 3 3 (100.00%) 1 (33.33%)(2) 1 (33.33%)(2) 3 (100.00%)
3 (100.00%)(1,2,3) 1 (33.33%)(2)
>11 5 2 2 (100.00%) 1 (50.00%)(2) 1 (50.00%)(2) 2 (100.00%) 2 (100.00%)(2,3) 1 (50.00%)(2)
>12 3 1 1 (100.00%) 0 (0%) 0 (0%) 1 (100.00%) 1 (100.00%)(3) 0 (0%)
The number and fraction of sites identified by each model are given for each level of ChIP-PET stringency (i.e. minimum number of tags per PET cluster). Counts are given with percentages in parentheses. For a given set size, where the fraction of sites predicted by the combined-evidence model differs significantly from that predicted by the sequence-only model (exact binomial test,P<0.05), the count is given in bold font for the model retrieving the largest fraction of the ChIP-PET sites. Significantly different fractions were observed for the sets with>7 (stringent set,P= 0.04),>10 (intermediate set,P= 0.04) and>12 (intermediate set,P<2.201016) tags. No tests were significant after discounting a comparison with zero at
PET>12 and after correction for multiple testing. Superscripts refer to specific PET clusters with>10 tags that are described in Supplementary Table S5.
Table 1. ChIP-on-chip sites in the test set predicted to be p53 binding sites by the sequence-only and combined-evidence models
Model Large set Intermediate set Stringent set
Combined-evidence 330 (42.47 %) 147 (18.92 %) 35 (4.50 %)
Sequence-only 307 (39.51 %) 93 (11.97 %) 14 (1.80 %)
Among the 1545 ChIP-on-chip sites (26), 777 were used as a test set. Counts are given with percentages in parentheses. The fraction of sites predicted by the two models was significantly different for the inter-mediate (exact binomial test, P= 2.62108) and stringent (exact
binomial test,P= 2.01106
) sets.
at St Andrews University Library on July 30, 2013
http://nar.oxfordjournals.org/
combined-evidence model (Figure 8; Supplementary Table S13). We conclude that, compared with the sequence-only model, the combined-evidence model identifies genes that are more likely to be genuine p53 target genes.
Gene set enrichment analysis
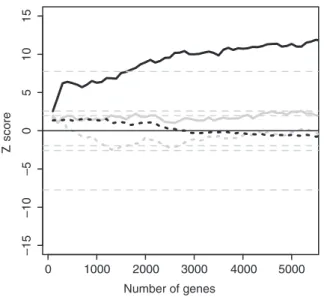
If our predictions identify important p53 binding sites, the expression of neighboring genes should change following p53 activation. To test this, we analyzed gene expression data from HCT116 colon cancer cells before and after p53 activation with 5FU. We ranked genes by strength of in-duction or repression after p53 activation, then asked whether genes near predicted p53 binding sites were overrepresented near the beginning or end of the ranked list. We used GSEA to quantify the results. To gain insight into the performance of the models, we ranked the predic-tions by logit or bit score, then performed GSEA for pro-gressively increasing numbers of predictions. In GSEA terminology, the binding site predictions would be called ‘gene sets’. For computational reasons, we increased the size of the gene sets in steps of 100. The combined-evidence predictions showed extremely significant enrich-ment for all gene sets except the first (Figure 9, solid black
27%
11% 2% 6% 5% 49%
35%
24% 4%
7% 6%
24%
A
27%
11%
2% 6% 5% 49%
35%
23% 3%
7% 6%
26%
27%
11%
2% 6% 5% 49%
30%
22% 4%
9% 6%
29%
B C
*
*
*
*
*
*
*
*
*
*
*
*
*
*
27%
11% 2% 6% 5% 49%
30%
12%
3% 7% 6% 42%
27%
11%
2% 6% 5% 49%
29%
13%
3% 7% 6% 42%
27%
11%
2% 6% 5% 49%
23%
10%
4%
10% 7% 46%
F E
D
*
*
*
*
*
*
*
*
*
*
*
*
Figure 4. Location of p53 binding sites predicted by the combined-evidence model relative to genes. The outer rings describe the predictions; the inner rings describe the distribution over the entire genome. Significantly enriched or under-represented regions (G test,P<0.05) are marked with an asterisk. Combined-evidence model: (A) large set, (B) intermediate set and (C) stringent set. Sequence-only model: (D) large set, (E) intermediate set and (F) stringent set.
0 100 200 300
Regulaon of cell death Regulaon of programmed cell death Regulaon of cell proliferaon Regulaon of apoptosis Enzyme-linked receptor protein signaling pathway Phosphate metabolic process Phosphorus metabolic process Posive regulaon of molecular funcon Posive regulaon of cell proliferaon Protein amino acid phosphorylaon Regulaon of cell moon Regulaon of cell migraon Acn cytoskeleton organizaon Phosphorylaon Blood vessel development Posive regulaon of cell death Vasculature development Regulaon of locomoon Posive regulaon of programmed cell death
Number of genes
Figure 5. Functional enrichment (P<105
) of ‘GO FAT’ terms for biological process for the intermediate set predicted by the combined-evidence model. In all, 2457 genes were associated with GO terms of biological process. The order of the displayed GO terms is from least significant (top) to most significant (bottom). The most significant term was ‘regulation of cell death’.
at St Andrews University Library on July 30, 2013
http://nar.oxfordjournals.org/
line), whereas the sequence-only predictions showed no enrichment (Figure 9, solid gray line; Supplementary Figure S1). Interestingly, the result was only significant for gene induction by p53 (Figure 9, solid black line); there was no enrichment for binding site predictions among genes repressed by p53 (Figure 9, dotted black line). A Mann–Whitney test of median evidence of differ-ential expression confirmed that the predictions for the large prediction sets used above were different for the combined-evidence and sequence-only models (W= 16192384, P= 1.33104
). We conclude that the
combined-evidence model is vastly better than the sequence-only model at identifying functionally important p53 binding sites.
DISCUSSION
The main conclusion from this study is that inclusion of histone modification and spacer data in PWM-based models greatly improves the prediction of functionally im-portant p53 binding sites. Interestingly, the improvement was barely significant in conventional ChIP assays of DNA binding, but stood out clearly in assays for func-tionally important differences.
The first criterion we used to test the quality of our genome-wide predictions was the fraction of known binding sites we could predict. Our initial expectation was that the fraction would be higher for the model including modification and spacer data, but this was not borne out by experiment. Given the large differences seen in the genomic location and GSEA analyses, it may seem paradoxical that the fraction of sites we could predict should be so similar for the combined-evidence and sequence-only models. If we had used only a measure of sensitivity, the similarity could have been explained by the PWM finding the same true positives under both models, from which the combined-evidence model then eliminated some false positives. Because true positives and negatives are not known on a genome-wide scale, we compared the models at equal, fixed numbers of sites. In this setting, sensitivity plays off directly against specificity. If the number of true positives is constant under this constraint,
Number of genes
Z
score
0 1000 2000 3000 4000 5000
–15
–10
–5
0
5
10
15
Figure 9. GSEA for p53 activation by 5FU in HCT116 colon cancer cells. Maximum (solid lines) and minimum (dashed lines)Zscores are shown for the combined-evidence model (black) and sequence-only model (gray). The Z score is positive when genes are induced and negative when they are repressed. TheZscores were obtained by per-mutations of the ranking of the HCT116 gene induction list. Theoretical P= 1 – 51015, 0.995, 0.975, 0.025, 0.005 and 51015
limits for a standard normal distribution are indicated (dotted gray lines). Thex-axis shows the number of genes included in the gene list.
0 20 40 60 80 100 120
Pathways in cancer Focal adhesion Small cell lung cancer Regulaon of acn cytoskeleton Endocytosis Chronic myeloid leukemia Pancreac cancer ECM-receptor interacon Adherens juncon Axon guidance TGF-beta signaling pathway Colorectal cancer p53 signaling pathway
Number of genes
Figure 6. KEGG pathway enrichment (P<0.05) for the intermediate set predicted by the combined-evidence model. In all, 1037 genes were associated with the pathway terms. The most significant term was ‘pathways in cancer’.
0 20 40 60
Type II diabetes mellitus Axon guidance p53 signaling pathway Calcium signaling pathway Arrhythmogenic right ventricular cardiomyopathy (ARVC) Inositol phosphate metabolism Phosphadylinositol signaling system Chondroin sulfate biosynthesis
Number of genes
Figure 8. KEGG pathway enrichment (P<0.05) for the intermediate set predicted by the sequence-only model. In all, 897 genes were associated with the pathway terms. The most significant term was ‘type II diabetes mellitus’.
0 50 100 150
Axon guidance Neuron development Cell morphogenesis involved in neuron differenaon Axonogenesis Neuron projecon morphogenesis Neuron differenaon Cell morphogenesis involved in differenaon
Number of genes
Figure 7. Functional enrichment (P<105) of ‘GO FAT’ terms for biological process for the intermediate set predicted by the sequence-only model. In all, 2256 genes were associated with GO terms of biological process. The most significant term was ‘axon guidance’.
at St Andrews University Library on July 30, 2013
http://nar.oxfordjournals.org/
we can infer that the number of false positives has not shown the expected decrease under the combined-evidence model. We suggest that the answer to this con-undrum is that the combined-evidence model led to the identification of functionally important sites from within a pool of equally plausible sites defined by the essentially biophysical criteria of PWM or ChIP. If correct, this interpretation has two interesting implications: first, the avalanche of chromatin modification data now entering the databases will improve the prediction of functionally important binding sites over and above what can be achieved by ChIP for the factors themselves; and second, many sites identified by ChIP are functionally unimportant.
The first point is underscored by results from several other groups. Ernst et al. (22) combined a general binding preference, based on a variety of features relevant to transcription factor binding, with a subsequent PWM step. This is an active field of research where new modifications are regularly identified and assigned to roles in transcriptional regulation, notably by the international consortium working on the ENCODE project (50). For example, H3 lysine 27 acetylation (H3K27ac) has recently been shown to mark enhancers (51–54). It is particularly useful to distinguish active enhancers, marked by H3K27ac and H3K4me1, from inactive enhancers, marked only by H3K4me1 (51). The fact that our model gave H3K4me3 a positive coefficient in one cell strain and a negative coefficient in another may indicate that pro-moters that are differentially active between the two cell types are enriched in functional p53 sites. The higher mag-nitude of the negative coefficient is not surprising because this particular mark is found both in enhancers, where it should have a positive coefficient, and at TSSs, where in most cases there is no p53 binding and the coefficient should be negative. This type of consideration highlights the importance of incorporating biological insights into future models and hints at the great potential of the tech-nique as more marks are identified and their significance is understood. The strength of approaches that take into account chromatin state is that they can narrow down the regions where functionally important binding occurs. Their weakness is that each modification dataset is unique to a particular cell line or tissue. Hence, they will be most informative when trying to predict the binding of a tran-scription factor in a cell line that has already been characterized epigenetically. Conversely, the sites pre-dicted by our sequence-only model presumably contain a substantial number of genuine binding sites that are only functional, and so marked, in cell lines or tissues that differ substantially from the ones we used to train the model. This may partly explain the implication suggested above, that ChIP does not define functional sites. This should come as no great surprise because it is well recognized that isolated binding of transcription factors activates transcription poorly; this is the reason why luciferase assays are normally performed with highly multimerized sites. For example, the classic PG13-luc vector contains 39 decameric p53 binding sites (55). To create a functional enhancer, a group of transcription factors normally collaborates to establish a state
permissive for transactivation of nearby genes. The chro-matin modifications used in our model are both a cause and a consequence of the efforts of these transcription factors. A more fundamental approach would be to identify the clusters of binding sites that establish the chro-matin modifications. Smeenk et al. (27) performed this type of analysis on their experimentally defined p53 binding sites and identified enrichment for the REs of eight transcription factors: Kru¨ppel-like factors, Sp1/Sp3, basic helix-loop-helix proteins, AP1, AP2, MZF1, CP2 and ETS2. It remains to be seen whether combinations of sequence-specific transcription factors can replace chromatin modification data to identify func-tionally important binding sites. The vocabulary of chro-matin modification is rich but far smaller than that of transcription factors, so it is easier to generate comprehen-sive maps of chromatin modification than of transcription factor binding, a situation that will persist at least into the near future. A more general problem with models based purely on transcription factor PWMs is that chromatin modifications can facilitate or block transcription factor binding. Because chromatin state captures essential infor-mation about cell identity, it is unrealistic to expect tran-scription factors to behave correctly without providing information about cell identity. This could take several forms but the only practical way to access it at present is through epigenetic marks such as histone modification data.
The number of potential binding sites is far greater than the number of genes. For this reason, scientists accus-tomed to thinking in terms of genes commonly underesti-mate the difficulty of identifying transcription factor binding sites: there are roughly 106-fold more potential binding sites than genes. Viewed from this perspective, our estimate that we would require 106 predictions to identify 90% of the ChIP-PET sites is less shocking. That said, one obvious reason for a model to fail is the use of the wrong PWM. This typically occurs when a tran-scription factor binds to DNA indirectly; in this case, the model should use the PWM for the factors directly con-tacting the DNA. A long standing puzzle in genome-wide gene expression studies has been the finding that activa-tion of a single transcripactiva-tion factor leads almost invariably to both induction and repression of target genes, commonly in almost equal numbers. There is no mechan-istic difficulty in explaining this based on the presence of other factors at enhancers, but a simpler explanation is that many of the changes seen may be indirect. Our GSEA data point to this being the case for p53: there is highly significant enrichment for predicted binding sites near genes showing increased expression but no enrichment at all for sites near repressed genes. These data indicate that when p53 binds directly to DNA, it functions overwhelmingly as a transcriptional activator. Given the experimentally proven examples of direct repression (reviewed in 2), it is conceivable that training the linear model with repressive chromatin marks would have allowed us to identify enrichment for functionally important p53 binding sites near repressed genes.
In summary, we have shown that models incorporating histone modification and decamer spacing information
at St Andrews University Library on July 30, 2013
http://nar.oxfordjournals.org/
predict p53 binding scarcely better than models that include only PWM information. We suggest that this is because ChIP and PWMs are at heart biophysical measures of protein–DNA binding. Where we see large and highly significant differences in the binding sites selected by combined-evidence and sequence-only models is in the number of functionally important sites. Because this is the information biologists are most interested in, we conclude that the approach is worthwhile and should be further developed as more chromatin modification data become available. We expect the approach to be useful with a wide range of transcription factors, not just p53, and with genomes other than the human genome.
SUPPLEMENTARY DATA
Supplementary Data are available at NAR Online: Supplementary Tables 1–13, Supplementary Figure 1, Supplementary Datasets 1–8, Supplementary Script 1 and Supplementary Reference [29].
FUNDING
The University of St Andrews School of Medicine and a BBSRC Doctoral Training Grant [BB/D526845/1] (studentship to J.-H.L.); French National Research Agency [ANR grant ANR-08-CEXC-016-01 to R.I.]. Funding for open access charge: University of St Andrews.
Conflict of interest statement. None declared.
REFERENCES
1. Fulwood,M.J., Liu,M.H., Pan,Y.F., Liu,J., Xu,H.,
Mohamed,Y.B., Orlov,Y.L., Velkov,S., Ho,A., Mei,P.H.et al. (2009) An oestrogen-receptor-a-bound human chromatin interactome.Nature,465, 58–64.
2. Bode,A.M. and Dong,Z. (2004) Post-translational modification of p53 in tumorigenesis.Nat. Rev. Cancer,4, 793–805.
3. Riley,T., Sontag,E., Chen,P. and Levine,A. (2008) Transcriptional control of human p53-regulated genes.Nat. Rev. Mol. Cell Biol.,
9, 402–412.
4. Scha¨rer,E. and Iggo,R. (1992) Mammalian p53 can function as a transcription factor in yeast.Nucleic Acids Res.,20, 1539–1545. 5. Sigal,A. and Rotter,V. (2000) Oncogenic mutations of the p53
tumor suppressor: the demons of the guardian of the genome.
Cancer Res.,60, 6788–6793.
6. Vousden,K.H. and Prives,C. (2009) Blinded by the light: the growing complexity of p53.Cell,137, 413–431.
7. El-Deiry,W.S., Kern,S.E., Pietenpol,J.A., Kinzler,K.W. and Vogelstein,B. (1992) Definition of a consensus binding site for p53.Nat. Genet.,1, 45–49.
8. Bailey,T.L. and Elkan,C. (1994) Fitting a mixture model by expectation maximization to discover motifs in biopolymers.
Proc. Int. Conf. Intell. Syst. Mol. Biol.,2, 28–36.
9. Down,T.A. and Hubbard,T.J. (2005) NestedMICA: sensitive inference of over-represented motifs in nucleic acid sequence.
Nucleic Acids Res.,33, 1445–1453.
10. Hertz,G.Z. and Stormo,G.D. (1999) Identifying DNA and protein patterns with statistically significant alignments of multiple sequences.Bioinformatics,15, 563–577.
11. Liu,X., Brutlag,D.L. and Liu,J.S. (2001) BioProspector:
discovering conserved DNA motifs in upstream regulatory regions of co-expressed genes.Pac. Symp. Biocomput.,6, 127–138. 12. Liu,X.S., Brutlag,D.L. and Liu,J.S. (2002) An algorithm for
finding protein-DNA binding sites with applications to
chromatin-immunoprecipitation microarray experiments.
Nat. Biotechnol.,20, 835–839.
13. Mendes,N.D., Casimirov,A.C., Santos,P.M., Sa´-Correia,I., Oliveira,A.L. and Freitas,A.T. (2006) MUSA: a parameter free algorithm for the identification of biologically significant motifs.
Bioinformatics,22, 2996–3002.
14. Roth,F.P., Hughes,J.D., Estep,P.W. and Church,G.M. (1998) Finding DNA regulatory motifs within unaligned noncoding sequences clustered by whole-genome mRNA quantitation.Nat. Biotechnol.,16, 939–945.
15. Smith,A.D., Sumazin,P. and Zhang,M.Q. (2005) Identifying tissue-selective transcription factor binding sites in vertebrate promoters.Proc. Natl Acad. Sci. USA,102, 1560–1565. 16. Thijs,G., Lescot,M., Marchal,K., Rombauts,S., De Moor,B.,
Rouze´,P. and Moreau,Y. (2001) A higher-order background model improves the detection of promoter regulatory elements by Gibbs sampling.Bioinformatics,17, 1113–1122.
17. Huang,J. and Li,S. (2005) Mining p53 binding sites using profile hidden Markov model. In: Selvaraj,H. and Srimani,P.K. (eds), In:
Proceedings of the International Conference on Information Technology: Coding and Computing (ITCC’05), Vol. 1. IEEE Computer Society, Los Alamitos, California. pp. 146–151. 18. Levkovitz,L., Yosef,N., Gershengorn,M.C., Ruppin,E., Sharan,R.
and Oron,Y. (2010) A novel HMM-based method for detecting enriched transcription factor binding sites reveals RUNX3 as a potential target in pancreatic cancer biology.PLoS One,5, e14423.
19. Riley,T., Yu,X., Sontag,E. and Levine,A. (2009) The p53HMM algorithm: using profile hidden markov models to detect p53-responsive genes.BMC Bioinformatics,10, 111.
20. Jiang,B., Zhang,M.Q. and Zhang,X. (2007) OSCAR: one-class SVM for accurate recognition of cis-elements.Bioinformatics,23, 2823–2828.
21. Sinha,A.U., Phatak,M., Bhatnagar,R. and Jegga,A.G. (2007) Identifying functional binding motifs of tumor protein p53 using support vector machines. In: Wani,M.A., Kantardzic,M.M., Li,T., Liu,Y., Kurgan,L., Ye,J.et al. (eds), In:Proceedings of the Sixth International Conference on Machine Learning and Applications (ICMLA’07). IEEE Computer Society, Los Alamitos, pp. 506–511.
22. Ernst,J., Plasterer,H.L., Simon,I. and Bar-Joseph,Z. (2010) Integrating multiple evidence sources to predict transcription factor binding in the human genome.Genome Res.,20, 526–536. 23. Won,K.J., Ren,B. and Wang,W. (2010) Genome-wide prediction of transcription factor binding sites using an integrated model.
Genome Biol.,11, R7.
24. An,W., Kim,J. and Roeder,R.G. (2004) Ordered cooperative functions of PRMT1, p300, and CARM1 in transcriptional activation by p53.Cell,117, 735–748.
25. Zhang,Y. and Reinberg,D. (2001) Transcription regulation by histone methylation: interplay between different covalent
modifications of the core histone tails.Genes Dev.,15, 2343–2360. 26. Fingerman,I.M. and Briggs,S.D. (2004) p53-mediated
transcriptional activation: from test tube to cell.Cell,117, 690–691.
27. Smeenk,L., van Heeringen,S.J., Koeppel,M., van Driel,M.A., Bartels,S.J., Akkers,R.C., Denissov,S., Stunnenberg,H.G. and Lohrum,M. (2008) Characterization of genome-wide p53-binding sites upon stress response.Nucleic Acids Res.,36, 3639–3654. 28. Wei,C.L., Wu,Q., Vega,V.B., Chiu,K.P., Ng,P., Zhang,T.,
Shahab,A., Yong,H.C., Fu,Y., Weng,Z.et al. (2006) A global map of p53 transcription-factor binding sites in the human genome.Cell,124, 207–219.
29. Horvath,M.M., Wang,X., Resnick,M.A. and Bell,D.A. (2007) Divergent evolution of human p53 binding sites: cell cycle versus apoptosis.PLoS Genet.,3, e127.
30. Fujita,P.A., Rhead,B., Zweig,A.S., Hinrichs,A.S., Karolchik,D., Cline,M.S., Goldman,M., Barber,G.P., Clawson,H., Coelho,A.
et al. (2011) The UCSC Genome Browser database: update 2011.
Nucleic Acids Res.,39, D876–D882.
31. Kent,W.J., Sugnet,C.W., Furey,T.S., Roskin,K.M., Pringle,T.H., Zahler,A.M. and Haussler,D. (2002) The human genome browser at UCSC.Genome Res.,12, 996–1006.
at St Andrews University Library on July 30, 2013
http://nar.oxfordjournals.org/
32. Altschul,S.F., Madden,T.L., Scha¨ffer,A.A., Zhang,J., Zhang,Z., Miller,W. and Lipman,D.J. (1997) Gapped BLAST and PSI-BLAST: a new generation of protein database search programs.
Nucleic Acids Res.,25, 3389–3402.
33. Flicek,P., Amode,M.R., Barrell,D., Beal,K., Brent,S., Carvalho-Silva,D., Clapham,P., Coates,G., Fairley,S., Fitzgerald,S.et al. (2012) Ensembl 2012.Nucleic Acids Res.,40, D84–D90. 34. Grant,C.E., Bailey,T.L. and Noble,W.S. (2011) FIMO: scanning
for occurrences of a given motif.Bioinformatics, 27, 1017–1018. 35. Bailey,T.L., Boden,M., Buske,F.A., Frith,M., Grant,C.E.,
Clementi,L., Ren,J., Li,W.W. and Noble,W.S. (2009) MEME SUITE: tools for motif discovery and searching.Nucleic Acids Res.,37, W202–W208.
36. Heintzman,N.D., Stuart,R.K., Hon,G., Fu,Y., Ching,C.W., Hawkins,R.D., Barrera,L.O., Van Calcar,S., Qu,C., Ching,K.A.
et al. (2007) Distinct and predictive chromatin signatures of transcriptional promoters and enhancers in the human genome.
Nat. Genet.,39, 311–318.
37. Firth,D. (1993) Bias reduction of maximum likelihood estimates.
Biometrika,80, 27–38.
38. Heinze,G. and Schemper,M. (2002) A solution to the problem of separation in logistic regression.Stat. Med.,21, 2409–2419. 39. R Development Core Team. (2010)R: A Language and
Environment for Statistical Computing. R Foundation for Statistical Computing, Vienna, Austria.
40. The Gene Ontology Consortium. (2013) Gene Ontology annotations and resources.Nucleic Acids Res.,41, D530–D535. 41. Kanehisa,M., Goto,S., Sato,Y., Furumichi,M. and Tanabe,M.
(2012) KEGG for integration and interpretation of large-scale molecular data sets.Nucleic Acids Res., 40, D109–D114. 42. Huang,D.W., Sherman,B.T. and Lempicki,R.A. (2009)
Bioinformatics enrichment tools: paths toward the comprehensive functional analysis of large gene lists.Nucleic Acids Res.,37, 1–13.
43. Huang,D.W., Sherman,B.T. and Lempicki,R.A. (2009) Systematic and integrative analysis of large gene lists using DAVID bioinformatics resources.Nat. Protoc.,4, 44–57.
44. Sullivan,K.D., Padilla-Just,N., Henry,R.E., Porter,C.C., Kim,J., Tentler,J.J., Eckhardt,S.G., Tan,A.C., DeGregori,J. and
Espinosa,J.M. (2012) ATM and MET kinases are synthetic lethal
with nongenotoxic activation of p53.Nat. Chem. Biol.,8, 646–654.
45. Smyth,G.K. (2004) Linear models and empirical Bayes methods for assessing differential expression in microarray experiments.
Stat. Appl. Genet. Mol. Biol.,3, Article3.
46. Sokal,R.R. and Rohlf,F.J. (2012) Biometry: The Principles and Practice of Statistics in Biological Research. W. H. Freeman, New York.
47. Kitayner,M., Rozenberg,H., Rohs,R., Suad,O., Rabinovich,D., Honig,B. and Shakked,Z. (2010) Diversity in DNA recognition by p53 revealed by crystal structures with Hoogsteen base pairs.Nat. Struct. Mol. Biol.,17, 423–429.
48. Wang,Y., Schwedes,J.F., Parks,D., Mann,K. and Tegtmeyer,P. (1995) Interaction of p53 with its consensus DNA-binding site.
Mol. Cell. Biol.,15, 2157–2165.
49. Narlikar,L. (2013) MuMoD: a Bayesian approach to detect multiple modes of protein–DNA binding from genome-wide ChIP data.Nucleic Acids Res.,41, 21–32.
50. Mahler,B. (2012) ENCODE: The human encyclopaedia.Nature,
489, 46–48.
51. Creyghton,M.P., Cheng,A.W., Welstead,G.G., Kooistra,T., Carey,B.W., Steine,E.J., Hanna,J., Lodato,M.A., Frampton,G.M., Sharp,P.A.et al. (2010) Histone H3K27ac separates active from poised enhancers and predicts developmental state.Proc. Natl Acad. Sci. USA,107, 21931–21936.
52. Heintzman,N.D., Hon,G.C., Hawkins,R.D., Kheradpour,P., Stark,A., Harp,L.F., Ye,Z., Lee,L.K., Stuart,R.K., Ching,C.W.
et al. (2009) Histone modifications at human enhancers reflect global cell-type-specific gene expression.Nature,459, 108–112. 53. Rada-Iglesias,A., Bajpai,R., Swigut,T., Brugmann,S.A.,
Flynn,R.A. and Wysocka,J. (2011) A unique chromatin signature uncovers early developmental enhancers in humans.Nature,470, 279–283.
54. Shen,Y., Yue,F., McCleary,D.F., Ye,Z., Edsall,L., Kuan,S., Wagner,U., Dixon,J., Lee,L., Lobanenkov,V.V.et al. (2012) A map of the cis-regulatory sequences in the mouse genome.Nature,
488, 116–120.
55. El-Deiry,W.S., Tokino,T., Velculescu,V.E., Levy,D.B., Parsons,R., Trent,J.M., Lin,D., Mercer,W.E., Kinzler,K.W. and Vogelstein,B. (1993) WAF1, a potential mediator of p53 tumor suppression.
Cell,75, 817–825.
at St Andrews University Library on July 30, 2013
http://nar.oxfordjournals.org/