The Pattern of Learned Visual Improvements in
Adult Amblyopia
Andrew T. Astle, Ben S. Webb, and Paul V. McGraw
PURPOSE.Although amblyopia is diagnosed in terms of a mon-ocular letter acuity loss, individuals typically present with def-icits on a wide range of spatial tasks. Many of these defdef-icits can be collapsed along two basic visual dimensions (visual acuity and contrast sensitivity) that together account for most of the variability in performance of the amblyopic visual system. In this study, this space was exploited, to target the main deficits and fully characterize the pattern of learned visual improve-ments in adult amblyopic subjects.
METHODS.Twenty-six amblyopic subjects (mean age, 39 ⫾12 years) were trained on one of four tasks, categorized as either visual acuity (letter or grating acuity) or contrast sensitivity (letter or grating contrast) tasks. Performance was measured on all tasks before and after training, to quantify learning along each dimension and generalization to the other dimension. Performance in 35 visually normal subjects (mean, age 24⫾5 years) was used to establish normal variation in visual perfor-mance along each dimension, against which the learned im-provements in amblyopic subjects was compared.
RESULTS. Training on the contrast sensitivity tasks produced substantial within-task learning and generalization to measures of visual acuity. The learned improvements in performance after training on the letter acuity task were also substantial, but did not generalize to contrast sensitivity.
CONCLUSIONS.Mapping the pattern of learning onto the known deficit space for amblyopia enabled the identification of tasks and stimulus configurations that optimized learning, guiding further development of learning-based interventions in this clinical group. (Invest Ophthalmol Vis Sci.2011;52:7195–7204) DOI:10.1167/iovs.11-7584
A
mblyopia is a common developmental visual disorder that is diagnosed by reduced visual acuity in one, or occasion-ally both, eyes— despite full optical correction and no evident ocular pathology.1It affects approximately 2% to 4% of the population2
and remains the most common form of monocular vision loss in children,3
accounting for most children’s eye appointments in the United Kingdom.4
Orthodox treatment for amblyopia involves occlusion of the good eye, typically by covering it with a patch for lengthy periods. Amblyopia is caused by the disruption of normal visual input during the
critical period(s) of visual development—postnatal windows of experience-dependent neural plasticity.5
The neural site of the amblyopic deficit is widely thought to be the primary visual cortex,6
although extrastriate areas may have a supplementary role.7
Until relatively recently, the adult visual cortex had not been considered capable of retaining any of the experience-dependent neural plasticity, which is so prominent during early visual development. However, it is becoming increasingly clear that altering visual experience, either by occluding the non-amblyopic eye or repeated exposure to controlled visual stimulation, can reshape brain function throughout the lifes-pan (see Ref. 8 for a review).
A much studied behavioral manifestation of neural plasticity in normal vision is perceptual learning, in which repeatedly practicing a challenging task can lead to substantial and long-lasting improvements in visual performance. Work on percep-tual learning spans more than 150 years,9
and its effects have been widely documented in adulthood, well beyond the criti-cal period(s) of development. In visually normal adults, per-ceptual learning has been shown to improve performance on a wide range of visual tasks,10 –12
its hallmark being that improve-ments in performance are strongly coupled to trained visual attributes, such as the orientation10
of a stimulus. In contrast to the task-specific learning found in subjects with normal vision, trained improvements in amblyopic visual performance gener-alize to untrained tasks and novel stimuli, including visual acuity,13
visual counting,14
and stereoacuity.15
Generalization of perceptual learning to untrained tasks is key to harnessing this form of plasticity as an effective treatment for amblyopia, whether as a primary intervention or supplementary to tradi-tional methods, such as occlusion therapy.
Although amblyopia is diagnosed in terms of a monocular letter acuity loss, individuals typically present with deficits on a wide range of spatial tasks.16,17
Many of these deficits can be collapsed along two basic visual dimensions that together ac-count for virtually all the variation in performance of the amblyopic visual system.18
A factor analysis of visual function in 427 individuals with amblyopia, each of whom performed a range of spatial tasks, revealed two orthogonal dimensions of variation: visual acuity and contrast sensitivity. Subjects with different presumed etiologies occupied unique positions within this space, largely related to their degree of residual binocularity.18
In this study, we exploited this space (shown in Fig. 1), to target the main visual deficits and characterize the pattern of learned improvements and generalization in adult amblyopic subjects.
M
ETHODSSubjects
Thirty-five visually normal subjects and 26 subjects with naturally occurring amblyopia participated. The age of the normal and
amblyo-pic subjects ranged from 16 to 38 (mean, 24⫾5) and 17 to 63 (mean,
39⫾12) years, respectively. All subjects who participated provided
written informed consent. The experimental procedures adhered to From the Visual Neuroscience Group, School of Psychology,
Uni-versity of Nottingham, Nottingham, United Kingdom.
Supported by The College of Optometrists and a European Com-mission FP7 Grant. BSW was funded by a Wellcome Trust Research Career Development Fellowship.
Submitted for publication March 18, 2011; revised June 23, 2011; accepted July 20, 2011.
Disclosure:A.T. Astle, None;B.S. Webb, None;P.V. McGraw,
None
Corresponding author: Andrew T. Astle, Visual Neuroscience Group, School of Psychology, University Park, University of Notting-ham, NottingNotting-ham, NG7 2RD, UK; [email protected].
Investigative Ophthalmology & Visual Science, September 2011, Vol. 52, No. 10
the tenets of the Declaration of Helsinki and were approved by a local ethics committee at the School of Psychology, The University of Not-tingham.
Subjects underwent a full ocular examination, refraction to deter-mine their optical correction, and a full assessment of their binocular status, including a cover test. Best-corrected visual acuity was
mea-sured in each eye with the Bailey-Lovie chart.19The subjects were
classified as amblyopic if they had a visual acuity difference between the two eyes of at least 0.2 logMAR that could not be eliminated optically and had no evident ocular pathology. This is a widely
ac-cepted definition of amblyopia,20 which accommodates test–retest
variability in visual acuity measurements.21Twenty-one people did not
meet our criteria for inclusion in the study. Table 1 shows clinical details for the amblyopic subjects.
Apparatus
Each subject’s head was held in position with a forehead and chin rest. Unless otherwise stated, all stimuli for the following psychophysical tests were generated on a computer with custom software written in
Python22and presented on a gamma-corrected CRT monitor (Vision
Master Pro 514; IIyama, Oude Meer, The Netherlands) with a refresh
rate of 85 Hz and resolution of 1024⫻768 pixels. A digital-to-analog
converter (Bits⫹⫹; Cambridge Research Systems, Cambridge, UK) was
used to increase the dynamic range of the luminance levels from 256 gray levels (standard 8-bit graphics card) to 16,384 levels (14-bit). Unless otherwise stated, all screen-based tests were performed in a dark room, and the screen was viewed via a mirror at a distance of 6 m.
Stimuli
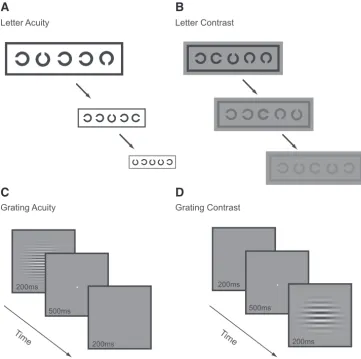
Letters.Landolt C’s were 5⫻5 sans serif letters. Gap width was equal to the stroke width and one fifth of letter width and height. Five Landolt C’s were arranged in a row (Fig. 2), each letter randomly oriented in one of the four cardinal directions, spaced half a letter width away from the next letter, and surrounded by a crowding bar to
control for contour interactions.23The width of the crowding bar was
equal to the stroke width of the Landolt C’s and spaced a half letter
width away from the letters. Uniform white (luminance, 180 cd䡠m⫺2)
and gray (luminance, 90 cd 䡠m⫺2) backgrounds were used for the
letter acuity and letter contrast tasks, respectively.
Gabors.Gabor patches (example shown in Fig. 2) consisted of a horizontal sinusoidal carrier modulated on a uniform background (90
cd 䡠 m⫺2), windowed by a two-dimensional Gaussian function (SD
0.5°). The mathematical expression describing a Gabor is:
L共x,y兲⫽Lm
再
1 ⫹ Cpcos关2xfc ⫹ c兴 ⫻exp冋
⫺1
2
冉
x x
冊
⫺1
2
冉
y y
冊
2
册冎
(1)
whereLmis the mean luminance of the display,Cpis the peak contrast
of the Gabor,fc is the carrier spatial frequency, andxandyare
standard deviations of the Gaussian envelope.
Tasks
Letter Acuity. Moving from left to right along a row of five Landolt C’s (Fig. 2), subjects indicated with a key press the orientation of the gap. The target letter was indicated by a marker above it (two letter widths above, two thirds letter height, one third letter width). On completing a line, the size of all letters was reduced in logarithmic steps, and letter acuity was scored in logMAR units on a letter-by-letter basis. Each letter scored 0.02 logMAR and a letter-by-letter
(complete-line) termination criterion of four mistakes was used.24
Letter Contrast.Subjects viewed the screen at 1.5 m (except subject KT who was tested at 1 m). With the following exceptions, the stimulus configuration and judgment were the same as those used for the letter acuity task. Letter size was fixed at 1.30 logMAR (1.50 logMAR for KT), well above the acuity limit of all amblyopic subjects, ensuring that any deficit measured is likely to be the result of impaired contrast sensitivity rather than spatial resolution. The Michelson con-trast (equation 2) was varied in logarithmic steps (Fig. 2). Performance on the task was scored in log 1/contrast units, such that a higher positive score corresponded to a lower contrast level and better
per-formance (analogous to the Pelli-Robson chart scoring system25). Each
letter scored 0.02 log 1/contrast, and a letter-by-letter (complete-line)
termination criterion of four mistakes was used.24
Grating Acuity.Horizontally oriented Gabor patches (envelope SD, 0.54°), were used to measure grating acuity (Fig. 2). In a temporal two-alternative, forced-choice task, subjects indicated which of two intervals contained the Gabor. On each trial, one randomly chosen interval contained the Gabor on a mean luminance background; the other interval contained the mean luminance background alone. A brief tone indicated the onset of an interval, each of which lasted 200 ms and were separated by 500-ms interstimulus intervals containing a fixation spot on a mean luminance background. Gabors were pre-sented at 80% Michelson contrast (equation 2) for 180 ms in a raised cosine temporal window (10-ms onset and offset).
共Lmax⫺Lmin兲/共Lmax ⫹Lmin兲 (2)
where Lmax is the maximum luminance and Lmin is the minimum
luminance.
Spatial frequency was varied using a three-up, one-down stair-case procedure that terminated after six reversals. Auditory feed-back was provided for incorrect responses after each trial. Grating acuity thresholds were estimated as the geometric mean of the last four reversals.
Grating Contrast.With the following exceptions, the timing, procedure, and staircases were the same as those used for grating acuity. Gabor patches, were used to measure contrast sensitivity in a range of spatial frequencies (0.5, 1, 2, 4, 8, 16, and 32 cyc/deg). Contrast was varied in Michelson units (equation 2), and contrast sensitivity was calculated as the reciprocal of the geometric mean of the contrast threshold for the last four reversals. Staircases for different frequencies were randomly interleaved and terminated once all stair-cases had completed six reversals.
Training
Before and after training, we measured the subjects’ performance on all four of the tasks described above. Task order was randomized and the pre- and posttraining phases each lasted approximately 90 minutes. During training, subjects were randomly assigned to train on one of the tasks for 10 daily sessions. Five visually normal subjects trained on each task. Table 2 shows, for each test, how many amblyopic subjects trained, the approximate number of trials completed, the number of runs completed per training session, and the approximate duration of each training session. The number of trials per run and the duration Acuity
Contrast Sensitivity
Low High
Low High
of each training session were dependent on the performance and termination criteria of each test. Training sessions were separated by no more than 3 days.
Fifteen observers with normal vision did not undergo training and instead had performance measured on each task during a test session, followed by repeat measurement of performance during a retest ses-sion 2.5 weeks later. The visual acuity of all subjects was measured before and after training with the Bailey-Lovie chart, as well as the computer-based Landolt C letter acuity test.
All testing and training was performed with the amblyopic eye of amblyopic observers or the nondominant eye in normal observers. All subjects were optically corrected for the working distances used.
Data Analysis
Using 30 visually normal subjects (those who did not train on the task), we derived test and retest confidence intervals (CIs) in sessions sepa-rated by 2 weeks for each of the four tasks. The 95% CIs were calculated by taking the 2.5% and 97.5% percentiles from 10,000
TABLE1. Clinical Details of Amblyopic Subjects
Subject’s
Initials Task Age M/F Amb Eye Refractive Error VA Strab
Amblyopia
Type Treatment History
DC GA/LC 42 F L R pl/⫺0.75⫻85 0.00 LSOT Strab and aniso Specs and occlusion
L⫹3.00 DS 0.94
NGM GA 29 M R R⫹3.00/⫺1.00⫻60 0.32 NMD Aniso Specs and occlusion
L⫹0.50 DS ⫺0.02
PCP GA 40 M R R⫹3.75/⫺0.75⫻55 0.24 RSOT Strab and aniso Specs and occlusion
L⫹1.00/⫺0.50⫻175 ⫺0.22
RLC GA 29 M L R⫹0.25 DS 0.00 NMD Aniso Specs and occlusion
L⫹2.50/⫺1.00⫻60 0.24
MP GA/LC 52 M R R⫹4.50/⫺1.00⫻80 0.70 NMD Aniso Specs
L⫹1.50/⫺0.25⫻30 ⫺0.30
LE GA/LC 54 M L R⫺5.25/⫺0.50⫻85 0.00 NMD Aniso Specs and occlusion
L⫺0.50/⫺2.00⫻170 0.50
TS GA 45 F L R pl 0.04 NMD Aniso Specs and occlusion
L⫹4.75/⫺0.50⫻180 0.80
JW GA 55 F L R⫹0.75/⫺0.25⫻75 0.00 NMD Aniso Specs
L⫹4.50/⫺1.00⫻30 0.28
CM LA 24 F L R⫹0.25 DS ⫺0.08 NMD Aniso Specs and occlusion
L⫹0.25/⫺2.50⫻55 0.28
WT LA 44 F L R⫹0.25 DS 0.00 LSOT Strab and aniso Strab op, specs and
L⫹3.00/⫺2.00⫻10 1.30 occlusion
CH LA 50 M L R⫹2.75/⫺1.75⫻65 0.02 L microt Strab None
L⫺3.75/⫺0.50⫻85 0.32
AG LA 42 M R R⫺4.00/⫺1.00⫻165 0.50 RXOT Strab None
L⫺4.75/⫺0.50⫻25 0.02 ⫹L/R tropia
ACT LA 31 F L R⫹3.00/⫺1.50⫻45 ⫺0.06 LSOT Strab and aniso Specs and occlusion
L⫹4.25/⫺3.00⫻157 0.16
AS GC 47 M L R⫺1.75/⫺1.00⫻30 ⫺0.10 LSOT Strab and aniso Specs and occlusion
L⫹3.50/⫺0.25⫻10 0.80
KAN GC 63 F L R⫹1.50/⫺0.25⫻130 ⫺0.20 LSOT Strab None
L⫹1.50/⫺1.00⫻105 0.80
SB GC 37 F L R⫺1.00 DS 0.00 NMD Aniso Specs and occlusion
L⫹4.00 DS 0.90
EF GC 45 M R R⫹5.50/⫺2.00⫻130 0.60 NMD Aniso Specs and occlusion
L⫺0.25/⫺0.75⫻45 ⫺0.22
CMW GC 22 M R R⫹4.75 DS 0.60 NMD Aniso Specs and occlusion
L pl ⫺0.10
FH GC 33 F R R⫹3.00/⫺2.00⫻135 0.32 NMD Aniso Specs
L pl 0.00
BM LC 27 F L R⫹3.75/⫺0.50⫻140 0.24 LSOT Strab and aniso Specs and occlusion
L⫹5.50/2.00⫻55 0.84
CB LC 21 F R R⫹4.00/⫺0.25⫻110 0.14 NMD Aniso Specs and occlusion
L⫹0.75/⫺0.25⫻180 ⫺0.16
JN LC 17 F R R⫹3.00/⫺1.00⫻10 0.20 NMD Aniso Specs and occlusion
L pl ⫺0.06
KR LC 56 M L R⫹2.00/⫺0.50⫻10 ⫺0.24 LXOT Strab and aniso Strab op, specs and
L⫹3.50 DS 0.82 ⫹R/L tropia occlusion
KT LC 26 F R R⫺4.00/⫺2.00⫻10 1.35 R Microt Strab and aniso Specs and occlusion
L⫺1.75/⫺0.50 0.02
RL LC 47 M R⫹L R⫹8.00/⫺2.50⫻18 0.26 NMD Bilateral Specs
L⫹7.75/⫺1.50⫻12 0.18 hypermetropic
IMB LC 41 M L R⫹0.50DS ⫺0.10 NMD Aniso Specs and occlusion
L⫹5.50/⫺0.25⫻180 0.62
M, male; F, female; Amb, amblyopia; Strab, strabismus; GA, grating acuity; LA, letter acuity; GC, grating contrast; LC, letter contrast; R, right; L, left; pl, plano; VA, initial visual acuity (logMAR with Bailey-Lovie); NMD, no movement detected; RSOT/LSOT, right/left esotropia; RXOT/LXOT, right/left exotropia; Aniso, anisometropia; Specs, spectacles; R/L tropia, right hypertropia; L/R, left hypertropia; microt, microtropia. Subjects DC; MP and LE were trained on GA then LC.
bootstrapped samples (using the bias-corrected accelerated-percentile method) of the ratio between test and retest scores for these subjects. We expressed changes in performance on a task across different training sessions as the ratio between performance on each training day and the first day of training. We compared the trained within- and between-task performance improvements to the untrained test and retest bootstrapped CIs for that task (described above). To determine whether within- and between-task improvements in performance were significantly different between trained amblyopic groups and non-trained normal subjects, we performed Monte Carlo permutation test-ing (ustest-ing 10,000 resamples).
To characterize performance on the grating contrast task, the area under the log contrast sensitivity function (AULCSF) was calculated by fitting a third-order polynomial to the log contrast sensitivity versus log spatial frequency data of each subject and integrating between the lowest and highest spatial frequencies. A similar method has been used
to compare changes in contrast sensitivity.26
R
ESULTSWe first considered the variability of taking repeated perfor-mance measurements on a task and then compared the esti-mates to training-induced changes in performance on the same task. This method enabled us to infer whether training had produced perceptual improvements greater than the inherent variability in repeated measurements of performance. Figure 3 shows the mean scores and 95% CIs for test and retest mea-sures on each task. Performance was better (on average, by 3%) and less variable on most tasks at retest, possibly because of procedural effects.
Figure 4 shows example learning curves for normal and amblyopic subjects on each of the four trained tasks. Figures 4A and 4B show letter-based tasks, and Figures 4C and 4D show grating-based tasks. Mean performance and CIs of normal sub-jects who did not train on the tasks are shown by dashed Time
200ms 500ms
200ms 200ms
500ms 200ms
Time
Letter Acuity Letter Contrast
Grating Acuity Grating Contrast
A
B
C
D
FIGURE2. The four computer-based psychophysical tasks used to assess performance along the acuity and sensitivity dimensions. There are two tests of visual acuity (letter acuity and grating acuity) and two of con-trast sensitivity (letter concon-trast and grating contrast).
TABLE2. Number of Amblyopic Subjects Trained on and Approximate Number of Trials Completed for
Each Task, along with the Number of Runs Completed and Duration of Each Training Session
Trained Task
Amblyopic Subjects Trained (n)
Trials (⬃n)
Runs of Test per Training Session
Approximate Time per Training Session (min)
Letter acuity 5 2000 5 10
Letter contrast 10 3795 5 20
Grating acuity 8 3300 5 20
Grating contrast 6 4200 1 30
[image:4.594.44.406.59.419.2] [image:4.594.112.475.643.714.2]horizontal lines and gray shaded regions at sessions 1 and 12. Normal subjects (filled circles) showed modest improvements on all the tasks over the course of training. In contrast, am-blyopic subjects (open circles) started with poor performance when compared with their normal counterparts, improved significantly during the course of training, and in some in-stances reached performance levels that were within the
nor-mal range. For example, a nornor-mal subject (DPM) showed little change in performance over the course of letter acuity training, with performance remaining at the normal level of the task throughout, whereas an amblyopic subject (ACT) had rela-tively poor visual acuity at the start of training, but improved by more than 3 lines (0.32 logMAR) over the course of training. In fact, by the final session, their acuity was better than 0.00 Letter Acuity
Grating Acuity
Letter Contrast
Grating Contrast Test Retest -0.10 -0.08 -0.06 -0.04 -0.02 0.00 L e tt e r A c u it y (l o g M A R ) Test Retest 0.0 0.5 1.0 1.5 2.0 2.5 L e tt e r C o n tra s t (L o g 1/ c o n tra s t) Test Retest 1 10 100 Gr a ti n g A c ui ty ( c pd) Test Retest 0 1 2 3 Gr a ti n g Cont ra s t (A U L C S F )
A
B
C
D
FIGURE3. Task CIs. Mean test and retest measurements for each of the tasks. Error bars show the lower (2.5%) and upper (97.5% percentile) bounds of each CI.
Letter Acuity
1 2 3 4 5 6 7 8 9 10 11 12
-0.3 -0.2 -0.1 -0.0 0.1 0.2 0.3 ACT DPM Session Vi s u a l A c ui ty ( log M A R) Grating acuity
1 2 3 4 5 6 7 8 9 10 11 12
10 100 VHP DC Session Gr at in g A c u ity (c /d e g ) Grating Contrast Letter Contrast
1 2 3 4 5 6 7 8 9 10 11 12
0 1 2 3 Session Le tt e r Con tra s t (lo g c o n tr a s t) SN BM Normal Amblyopic
1 2 3 4 5 6 7 8 9 10 11 12
1 2 3 FH VW Session C o n tr a s t S e n s itiv ity (A U L C S F )
A
B
C
D
FIGURE4. Example learning curves for normal and amblyopic subjects for each of the four trained tasks. Thresholds are plotted as a func-tion of training session. The ordi-nates have been oriented so that points plotted closer to the bottom of the graphs refer to sessions with
better performance. Open and
closed circlesindicate subjects with
amblyopic and normal data,
respec-tively. Dashed horizontal lines:
logMAR, equivalent to the mean performance of visually nor-mal subjects (⫺0.05 logMAR). On the grating acuity task, how-ever, we found little or no learning in both the normal and the amblyopic subjects.
We expressed learned improvements in performance rela-tive to performance before training (post-/pretraining ratio for the letter tests and pre-/posttraining ratio for the grating tests, hereafter referred to as PPR), where numbers less than one constitute learning. Group mean PPR scores (⫾SEM) were calculated for each of the tasks and are shown in Figure 5. Since the performance on the letter acuity task is expressed in logMAR units, some scores are negative. This is problematic when calculating ratios such as the PPR. To circumvent the problem, we converted letter acuity scores to MAR and letter contrast scores converted into raw Michelson contrast units before PPR was calculated.
Normal subjects showed limited improvements in perfor-mance over the course of training: Those who trained on the letter contrast task improved by the largest amount (mean PPR, 0.65; SEM ⫾ 0.07), followed by letter acuity (0.82 ⫾ 0.08), grating contrast (0.90 ⫾ 0.05), and grating acuity (0.93 ⫾ 0.06). The improvements found for normal subjects trained on these tasks were not significantly different from the changes in performance found for normal subjects who did not train, apart from those trained on the letter contrast task (P ⫽
0.0011). Amblyopic subjects, on the other hand, improved more than normal subjects on all the tasks apart from grating acuity, where both groups showed little or no change in performance. Amblyopic subjects who trained on letter con-trast improved the most (PPR, 0.41⫾0.09), followed by letter acuity (PPR, 0.66,⫾0.06), and grating contrast (PPR, 0.75⫾
0.04) over the period of training. Apart from the grating acuity task, the improvement of all amblyopic groups significantly exceeded the change in performance of normal subjects who did not train (allP⬍0.001).
Figure 6 shows individual amblyopic data. Posttraining per-formance is plotted against perper-formance before training for each of the tests. Points lying outside of the shaded region correspond to subjects whose performance improved after training. Taken together, these data suggest that contrast sen-sitivity is much more amenable to learning in both normal and amblyopic subjects than are acuity-based tasks.
Even though subjects were randomly assigned to the train-ing groups, we wondered whether the composition of these groups may have contributed to the differential levels of learn-ing on each task. Since neural plasticity is thought to dissipate over the course of the lifespan,27
the age of subjects could be confounded by the amount of learning. We therefore com-pared the age of the subjects in each group (Table 3). Amblyo-pic subjects trained on the letter contrast task had the lowest mean age of the amblyopic groups and showed the greatest amount of learning on the trained task. However, there was no statistically significant correlation between age and the magni-tude of improvement on the trained task for these subjects (r27 ⫽ 0.26;P ⫽ 0.17). Alternatively, the different levels of learning between the groups might be related to their respec-tive visual acuities before training. Even though mean acuity before training was poorest in the amblyopic groups who improved most (contrast trained), again there was no correla-tion between Bailey-Lovie visual acuity (which no subjects trained on) and the magnitude of improvement in these sub-jects (r27⫽ ⫺0.18;P⫽0.34).
Letter Acuity
1 2 3 4 5 6 7 8 9 10 11 12 0.0
0.2 0.4 0.6 0.8 1.0 1.2
Session
L
e
tt
er
A
c
u
it
y
(
PPR
)
Grating Acuity
1 2 3 4 5 6 7 8 9 10 11 12 0.0
0.2 0.4 0.6 0.8 1.0 1.2
Session
G
ra
ti
n
g Ac
ui
ty
(
P
P
R
)
Grating Contrast
1 2 3 4 5 6 7 8 9 10 11 12 0.0
0.2 0.4 0.6 0.8 1.0 1.2
Session
G
ra
ti
n
g Cont
ra
s
t (
P
P
R
)
Letter Contrast
1 2 3 4 5 6 7 8 9 10 11 12 0.0
0.2 0.4 0.6 0.8 1.0 1.2
Session
Le
tt
e
r Cont
ra
s
t (
P
P
R
)
Normal Amblyopic
A
B
C
D
FIGURE5. Normalized meanlearn-ing curves for each of the tasks. Mean normalized performance is shown for each of the tasks for subjects with
normal (F) and amblyopic (E)
vi-sion. Learned improvements in per-formance are expressed relative to performance on the first day of
train-ing. Points lying below thesolid
hor-izontal line (PPR⫽ 1) indicate an
improvement beyond the level of performance on the first day of
train-ing.Dashed horizontal lines: mean
test–retest ratio of normal subjects who did not undergo training on the
task (gray shaded regionshows 95%
In the amblyopic subjects trained on the letter contrast task, the level of improvement found correlated with the initial performance on the task (r8⫽0.76;P⬍0.05). This relation-ship is shown in Figure 7. Greater levels of improvement are found in subjects with poorer starting performance compared with those with better starting performance.
Thus far, only improvements in performance on the trained task have been considered (within-task learning). We now considered how these improvements generalize to untrained tasks (between-task learning). Figure 8 shows the transfer of learning for both normal and amblyopic subjects to all un-trained tasks. We considered only transfer between tasks that converge on similar performance levels.
Each shows the average trained improvement on each task (bars in lower contrast) and how these transferred to the respective letter or grating task on the other dimension. Subjects with normal vision showed modest amounts of transfer to other tasks. Amblyopic subjects who trained on
letter contrast, not only improved significantly on the task itself, but also improved on letter acuity (beyond the change in performance found in normal observers who did not undergo training).
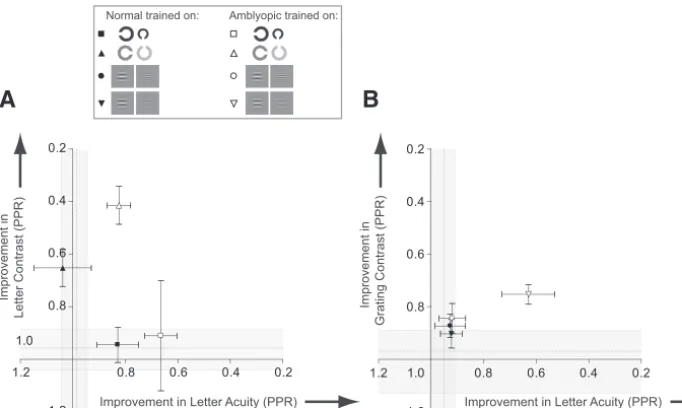
This pattern of transfer is represented in Figure 9, where improvements on each task are plotted in the acuity– contrast space. Changes in visual acuity are shown on the abscissas and changes in contrast sensitivity on the ordinates. Shaded regions
Letter Acuity -0.5 0.0 0.5 1.0 1.5 -0.5 0.0 0.5 1.0 1.5 Pre-training (logMAR) P o s t-tr a in in g ( lo g M A R ) Letter Contrast
0 1 2
0 1 2
Pre-training (log 1/contrast)
P o s t-tr a in in g ( lo g 1 /c o n tr a s t) Grating Acuity
1 10 100
1 10 100 Pre-training (cpd) Po s t-tr a in in g ( c p d ) Grating Contrast
0 1 2 3
0 1 2 3 Pre-training (AULCSF) Po s t-tr a in in g (A U L C S F ) A B C D
FIGURE6. Performance for individual amblyopic subjects as a func-tion of performance before training. Subjects with results lying on the diagonal showed no benefits from training. Axes have been oriented such that points lying outside the shaded region denote subjects whose
performance improved on the task after training. (B)Gray filled circles
correspond to subjects previously trained on the grating task.
TABLE3. Mean Age and Visual Acuity (Trained Eye, Measured with
Bailey-Lovie Chart) before Training for Each Training Group
Group/Trained Task
Mean Age (ⴞSD)
Mean Visual Acuity before Training (ⴞSD)
Normal
Letter acuity 24 (3) ⫺0.08 (0.09)
Letter contrast 26 (5) ⫺0.04 (0.08)
Grating acuity 25 (4) ⫺0.08 (0.07)
Grating contrast 25 (3) ⫺0.04 (0.10)
Amblyopic
Letter acuity 38 (10) 0.50 (0.50)
Letter contrast 38 (14) 0.64 (0.38)
Grating acuity 43 (10) 0.50 (0.28)
Grating contrast 42 (14) 0.67 (0.21)
0.0 0.5 1.0 1.5 2.0 2.5 0.00
0.25 0.50 0.75 1.00
Start Letter Contrast (log 1/contrast)
PPR L e tt e r C o n tr a s
t Amblyopic subjects
FIGURE7. Improvement in letter contrast plotted against start letter contrast, for amblyopic subjects trained on the letter contrast task with
linear regression curve fit. The two variables correlated strongly (r8⫽
0.76;P⬍0.05).
Trained on Letter Acuity
0.0 0.2 0.4 0.6 0.8 1.0 1.2 Cha n g e in pe rf orm a nc e ( P P R )
Trained on Letter Contrast
0.0 0.2 0.4 0.6 0.8 1.0 1.2 Cha n g e in pe rf orm a nc e ( P P R )
Trained on Grating Acuity
0.0 0.2 0.4 0.6 0.8 1.0 1.2 Cha n g e in pe rf orm a nc e ( P P R )
Trained on Grating Contrast
0.0 0.2 0.4 0.6 0.8 1.0 1.2 Cha n g e in pe rf orm a nc e ( P P R ) Transfer to: Normal Amblyopic Transfer to:
Transfer to: Transfer to:
A
B
C
D
represent 95% CI for the respective dimensions. The origin in Figure 9 represents no learning along both dimensions (PPR⫽ 1) and the initial performance level of all amblyopic groups before training. The axes are oriented such that, if a group of subjects improves in visual acuity over the course of training, the data point representing the group will move rightward in this space; improvements in contrast sensitivity, on the other hand, will produce upward movement.
The most notable features of the amblyopic data are that training on contrast-based tasks confers significant visual ben-efits along both dimensions, whereas letter acuity training produces benefits that are tightly coupled to the trained di-mension. We wondered whether the lack of improvement on the grating acuity task was due to a characteristic of the task itself or had something to do with the subjects who were assigned to train on the task. Therefore, we asked three am-blyopic subjects who had trained on the grating acuity test (LE, MP, DC) to return and train on the letter contrast task. Even though these subjects showed no improvement on the grating acuity test, they showed learning on the letter contrast task and transfer of learning to the letter acuity test beyond the 95% CI for normal subjects who did not train on these tasks. Adding the data for these participants to the results of those previously trained on the letter contrast task had little effect on the magnitude of within-task learning (PPR⫽0.39) or the degree of transfer to the letter acuity task (PPR⫽0.80) and did not change the pattern of improvements found.
D
ISCUSSIONWe defined the visual deficits of adult amblyopic subjects using two dimensions of variation: visual acuity and contrast sensi-tivity. Using this deficit space, we found that amblyopic sub-jects showed greater learning within and across these dimen-sions relative to normal control subjects, benefiting most from training on a letter-based contrast task. Other studies have shown that amblyopic subjects can learn on a range of visual tasks, including positional acuity, contrast detection, and letter recognition (see Ref. 28 for a review). Transfer of learning has also been demonstrated to untrained tasks such as letter acu-ity,13visual counting,14and stereoacuity.15However, previous learning studies have used a wide range of visual tasks, psy-chophysical procedures, stimuli, subject numbers, and differ-ent forms of experimdiffer-ental control, making it difficult to estab-lish patterns of learning in adult amblyopia. To faithfully
characterize the rich pattern of learned improvements in adult amblyopia, it is critical not only to consider the broader spec-trum of visual deficits, but also to consider the generalization of learning within a framework that imposes a priori constraints on their interpretation.
In this study, we adapted a framework developed by McKee et al.,18
which classifies the visual loss in amblyopic subjects within an acuity– contrast space. We used this space to char-acterize learning-induced changes in amblyopic visual perfor-mance relative to normal variation along each dimension. We designed tests that used common stimuli (letters and gratings) and similar test procedures to limit the impact of procedural learning on our results, facilitating comparison between test results. Mean and variation of normative scores for each of the tests were in good accordance with previous reports in the literature.29 –31
Quite often, improvement in amblyopic performance is compared to that in the fellow eye.32
This may not be a valid control since performance of one eye can change after training of the other eye.33 Moreover, the fellow eye of amblyopic subjects is not considered by many to be completely normal.34 To avoid this problematic comparison, we compared perfor-mance of amblyopic subjects to visually normal controls and calculated CIs for each task. This sets a minimum baseline and level of variation against which any improvements in visual performance can be compared. This approach is an alternative to showing that the slope of a learning function is significantly different from 0 (flat line)—a situation that compares perfor-mance changes to a baseline with no associated variation.
If asked to define the quality of vision using a single num-ber, most clinicians would opt for an estimate of letter acuity. Because of the familiarity and sensitivity of this measure, it is also used as a key indicator of treatment success in amblyo-pia.35
Amblyopic subjects that trained on a letter acuity task showed a 34% change in letter score, which equates to an improvement of 0.2 logMAR. The maximum improvement for an amblyopic subject was more than 0.3 logMAR (ACT). An improvement of this magnitude would require around 380 hours of patching in a child.36
In the present study, we were able to generate these changes in a fraction of the time (⬍10 hours). Apart from the rapidity of learning, more interesting in many ways is the generalization of learning: Training on letter contrast generated levels of improvement on letter acuity sim-ilar to those generated by training on the task itself.
Improvement in Letter Contrast (PPR) Improvement in Grating Contrast (PPR)
Improvement in Letter Acuity (PPR) Normal trained on: Amblyopic trained on:
Improvement in Letter Acuity (PPR) 0.2
0.4 0.6 0.8 1.2
0.2
0.4
0.6
0.8
1.2
0.2 0.4 0.6 0.8 1.2
0.2
0.4
0.6
0.8
1.2 1.0
1.0
A
B
FIGURE9. Improvements in perfor-mance mapped onto acuity– contrast
space.18 Improvements are
ex-pressed as changes in performance along two dimensions: acuity (ab-scissa) and contrast (ordinate). (A) Data for those trained on letter tasks.
(B) Grating task data. Horizontal
dashed line: the mean letter contrast
(A) or grating contrast (B) improve-ment for normal subjects who did
not train (shaded regionsstraddling
these lines show 95% CIs).Vertical
dashed line: the letter (A) or grating
[image:8.594.46.387.57.261.2]In contrast to two previous reports, we found no improve-ment in grating acuity for either normal or amblyopic subjects. One study37
that did show learning on this task used only a single subject, who had lost the fellow eye. It is likely that the mechanisms of visual recovery in this subject will be very different from those of our cohort.38
The other study39 found improvements in amblyopic subjects who had no previous treatment, but little or no improvements in previously treated subjects. Most of our grating acuity group (6/8) had undergone patching during childhood. These differences in treatment history may partially explain the lack of learning in this group. It may not be the full explanation, however, since many sub-jects in the other groups that did show learning had previously been treated with occlusion therapy. Alternatively, the capac-ity for improvement may be limited for grating acucapac-ity tasks in adulthood or fundamental differences between stimuli (broad-band versus narrow(broad-band) and task (detection versus discrimi-nation) may be important. Consistent with this notion, when gratings are used in a spatial frequency discrimination task, learning can be substantial.40
Other studies (also using contrast based tasks) have achieved PPRⱖ0.34 (PPR found for letter contrast task),41– 43 although subjects received more training. We suspect that the very rapid rate of learning and degree of generalization in our letter contrast group is due to optimization of the stimulus configuration and procedural demands. The letters are broad-band (both in spatial frequency and orientation), which facili-tates transfer across these dimensions, and crowded, which encourages large amounts of learning (Hussain et al. manu-script submitted).
We restricted our comparisons to those between tasks of equal precision (i.e., those between the two letter tasks and those between the two grating tasks only), as differences in task precision can influence the amount of learning and trans-fer found.44
Differences in the amount of transfer found for each task may be due to differences in the number of trials completed per training session for each task. Greater levels of transfer are to be expected for briefer periods of training.45 However, we showed greater levels of transfer for contrast tasks on which subjects received more training. Therefore, the greater levels of transfer found for the contrast tasks are un-likely to be accounted for by the differential amount of training received.
One could argue that improvements in performance on tests are due to factors other than genuine perceptual improve-ments in performance. For example, better control of accom-modation may play a role in the improvements found. How-ever, the amount of accommodation necessary to focus on the test targets would have been minimal due to the distances used and the fact that subjects were optically corrected for the working distances used.
From a clinical perspective, any therapeutic intervention should optimize the magnitude, timescale, and generaliza-tion of learned visual improvements in amblyopia. Mapping the pattern of learning onto the known deficit space for amblyopia enabled us to identify which task best met these conditions for a fixed training period. Letter-based contrast training confers the largest magnitude of within dimension learning and across dimension generalization over very short time scales. This makes crowded contrast-based letter tasks ideal candidates for further development of learning-based interventions in this clinical group. Recently, we have also shown that this approach puts in place the necessary neural precursors required to fully recover stereo acuity in adult amblyopic subjects.46
References
1. Ciuffreda K, Levi DM, Selenow A.Amblyopia:Basic and Clinical
Aspects. Stoneham, MA: Butterworth-Heinemann; 1991.
2. von Noorden GK.Binocular Vision and Ocular Motility:Theory
and Management of Strabismus. 5th ed. St. Louis: Mosby; 1996.
3. Attebo K, Mitchell P, Smith W. Visual acuity and the causes of
visual loss in Australia. The Blue Mountains Eye Study.
Ophthal-mology.1996;103:357–364.
4. Stewart CE, Fielder AR, Stephens DA, Moseley MJ. Design of the Monitored Occlusion Treatment of Amblyopia Study (MOTAS).
Br J Ophthalmol.2002;86:915–919.
5. Wiesel TN, Hubel DH. Single-cell responses in striate cortex of
kittens deprived of vision in one eye.J Neurophysiol. 1963;26:
1003–1017.
6. Kiorpes L, McKee SP. Neural mechanisms underlying amblyopia.
Curr Opin Neurobiol.1999;9:480 – 486.
7. Barrett BT, Bradley A, McGraw PV. Understanding the neural basis
of amblyopia.Neuroscientist.2004;10:106 –117.
8. Levi DM, Li RW. Improving the performance of the amblyopic
visual system.Phil Trans R Soc B Biol Sci.2009;364:399 – 407.
9. Gold J, Watanabe T. Perceptual learning.Curr Biol.2010;20:R46 –
R48.
10. Fiorentini A, Berardi N. Perceptual learning specific for orientation
and spatial frequency.Nature.1980;287:43– 44.
11. Schoups A, Vogels R, Qian N, Orban G. Practising orientation
identification improves orientation coding in V1 neurons.Nature.
2001;412:549 –553.
12. Dosher BA, Lu ZL. Perceptual learning reflects external noise filtering and internal noise reduction through channel
reweight-ing.Proc Natl Acad Sci U S A.1998;95:13988 –13993.
13. Polat U, Ma-Naim T, Belkin M, Sagi D. Improving vision in adult
amblyopia by perceptual learning.Proc Natl Acad Sci USA.2004;
101:6692– 6697.
14. Li RW, Levi DM. Characterizing the mechanisms of improvement
for position discrimination in adult amblyopia.J Vis.2004;4:476 –
487.
15. Li RW, Provost A, Levi DM. Extended perceptual learning results in substantial recovery of positional acuity and visual acuity in
juve-nile amblyopia.Invest Ophthalmol Vis Sci.2007;48:5046 –5051.
16. Levi DM, Saarinen J. Perception of mirror symmetry in amblyopic
vision.Vision Res.2004;44:2475–2482.
17. Hess RF, McIlhagga W, Field DJ. Contour integration in strabismic amblyopia: the sufficiency of an explanation based on positional
uncertainty.Vision Res.1997;37:3145–3161.
18. McKee SP, Levi DM, Movshon JA. The pattern of visual deficits in
amblyopia.J Vis.2003;3:380 – 405.
19. Bailey IL, Lovie JE. New design principles for visual acuity letter
charts.Am J Optom Physiol Opt.1976;53:740 –745.
20. Holmes JM, Clarke MP. Amblyopia.The Lancet.2006;367:1343–
1351.
21. Holmes JM, Beck RW, Repka MX, et al. The Amblyopia Treatment
Study visual acuity testing protocol.Arch Ophthalmol.2001;119:
1345–1353.
22. Peirce JW. PsychoPyL psychophysics software in Python.J
Neu-rosci Methods.2007;162:8 –13.
23. McGraw PV, Winn B. Glasgow Acuity Cards: a new test for the
measurement of letter acuity in children.Ophthalmic Physiol Opt.
1993;13:400 – 404.
24. Carkeet A. Modeling logMAR visual acuity scores: effects of
termi-nation rules and alternative forced-choice options.Optom Vis Sci.
2001;78:529 –538.
25. Pelli DG, Robson JG, Wilkins AJ. The design of a new letter chart
for measuring contrast sensitivity.Clin Vis Sci.1988;2:187–199.
26. Applegate RA, Howland HC, Sharp RP, Cottingham AJ, Yee RW. Corneal aberrations and visual performance after radial
keratot-omy.J Refract Surg.1998;14:397– 407.
27. Vaegan, Taylor D. Critical period for deprivation amblyopia in
children.Trans Ophthalmol Soc U K.1979;99:432– 439.
28. Levi DM, Li RW. Perceptual learning as a potential treatment for
29. Thorn F, Schwartz F. Effects of dioptric blur on Snellen and grating
acuity.Optom Vis Sci.1990;67:3–7.
30. Elliott DB, Sanderson K, Conkey A. The reliability of the
Pelli-Robson contrast sensitivity chart.Ophthalmic Physiol Opt.1990;
10:21–24.
31. Raasch TW, Bailey IL, Bullimore MA. Repeatability of visual acuity
measurement.Optom Vis Sci.1998;75:342–348.
32. Zhou Y, Huang C, Xu P, et al. Perceptual learning improves contrast sensitivity and visual acuity in adults with anisometropic
amblyopia.Vision Res.2006;46:739 –750.
33. Lu ZL, Chu W, Dosher BA, Lee S. Perceptual learning of Gabor orientation identification in visual periphery: complete
inter-ocu-lar transfer of learning mechanisms.Vision Res. 2005;45:2500 –
2510.
34. Giaschi DE, Regan D, Kraft SP, Hong XH. Defective processing of motion-defined form in the fellow eye of patients with unilateral
amblyopia.Invest Ophthalmol Vis Sci.1992;33:2483–2489.
35. Hiscox F, Strong N, Thompson JR, Minshull C, Woodruff G.
Oc-clusion for amblyopia: a comprehensive survey of outcome.Eye.
1992;6:300 –304.
36. Stewart CE, Moseley MJ, Stephens DA, Fielder AR. Treatment dose-response in amblyopia therapy: the Monitored Occlusion
Treatment of Amblyopia Study (MOTAS).Invest Ophthalmol Vis
Sci.2004;45:3048 –3054.
37. Fronius M, Cirina L, Cordey A, Ohrloff C. Visual improvement during psychophysical training in an adult amblyopic eye
follow-ing visual loss in the contralateral eye.Graefes Arch Clin Exp
Ophthalmol.2005;243:278 –280.
38. Levi DM. Perceptual learning in adults with amblyopia: a
reevalu-ation of critical periods in human vision.Dev Psychobiol.2005;
46:222–232.
39. Liu X-Y, Zhang T, Jia Y-L, Wang N-L, Yu C. The therapeutic impact of perceptual learning on juvenile amblyopia with or without
previous patching treatment.Invest Ophthalmol Vis Sci.2011;52:
1531–1538.
40. Astle AT, Webb BS, McGraw PV. Spatial frequency discrimination learning in normal and developmentally impaired human vision.
Vision Res.2010;50:2445–2454.
41. Huang C, Zhou Y, Lu ZL. Broad bandwidth of perceptual learning
in the visual system of adults with anisometropic amblyopia.Proc
Natl Acad Sci USA.2008;105:4068 – 4073.
42. Chen P-L, Chen J-T, Fu J-J, Chien K-H, Lu D-W. A pilot study of anisometropic amblyopia improved in adults and children by
per-ceptual learning: an alternative treatment to patching.Ophthalmic
Physiol Opt. 2008;28:422– 428.
43. Chung STL, Li RW, Levi DM. Learning to identify near-threshold luminance-defined and contrast-defined letters in observers with
amblyopia.Vision Res.2008;48:2739 –2750.
44. Jeter PE, Dosher BA, Petrov A, Lu ZL. Task precision at transfer
determines specificity of perceptual learning.J Vis.2009;9:1.1–13.
45. Jeter PE, Dosher BA, Liu SH, Lu ZL. Specificity of perceptual
learning increases with increased training.Vision Res. 2010;50:
1928 –1940.
46. Astle AT, McGraw PV, Webb BS. Recovery of stereo acuity in
adults with amblyopia. BMJ Case Reports. 2011;10.1136/bcr.