Supplementary appendix
This appendix formed part of the original submission and has been peer reviewed.
We post it as supplied by the authors.
1
Supplementary Appendix
Novel insights into the genetics of smoking behaviour, lung function, and chronic
obstructive pulmonary disease (UK BiLEVE): a genetic association study in UK
Biobank
Louise V Wain1* PhD, Nick Shrine1* PhD, Suzanne Miller2 PhD, Victoria Jackson1 MSc, Ioanna Ntalla1 PhD, María Soler Artigas1 PhD, Charlotte K Billington2 PhD, Abdul Kader Kheirallah2 BSc, Richard Allen1 MSc, James P Cook1 PhD, Kelly Probert2 BSc, Ma'en Obeidat3 PhD, Yohan Bossé4 PhD, Ke Hao5,6,7 ScD, Prof. Dirkje S Postma8 PhD, Peter D Paré3 MD, Adaikalavan Ramasamy9,10,11 DPhil, UK Brain Expression Consortium (UKBEC) 12, Reedik Mägi13 PhD, Evelin Mihailov13 MSc, Eva Reinmaa13 MSc, Erik Melén14 MD, Jared O'Connell15,16 DPhil, Eleni Frangou15,17 MSc(Res), Olivier Delaneau15,18 PhD, OxGSK Consortium12, Colin Freeman16 PhD, Desislava Petkova16 PhD, Prof. Mark McCarthy19,16 MD, Ian Sayers2 PhD, Prof. Panos Deloukas20,21 PhD, Prof. Richard Hubbard22 MD, Ian Pavord23 FMedSci, Anna L Hansell24,25 MB BChir, Prof. Neil C Thomson26 MD, Eleftheria Zeggini27 PhD, Prof Andrew P Morris28 PhD, Prof. Jonathan Marchini15,16 DPhil, Prof. David P Strachan29* MD, Prof. Martin D Tobin1, 30* PhD, Prof. Ian P Hall2* MD
*These authors contributed equally
1. Department of Health Sciences, University of Leicester, Leicester LE1 7RH, UK
2. Division of Respiratory Medicine, University of Nottingham, Queen’s Medical Centre, Nottingham NG7 2UH, UK
3. University of British Columbia Centre for Heart Lung Innovation, St. Paul’s Hospital, Vancouver, BC, Canada
4. Institut universitaire de cardiologie et de pneumologie de Québec, Department of Molecular Medicine, Laval University, Québec, Canada
5. Department of Genetics and Genomic Sciences, Icahn School of Medicine at Mount Sinai, New York, NY, USA
6. Department of Respiratory Medicine, Shanghai Tenth People’s Hospital, Tongji University, Shanghai, China 7. Icahn Institute of Genomics and Multiscale Biology, Icahn School of Medicine at Mount Sinai, New York, NY, USA
8. University of Groningen, University Medical Center Groningen, Department Pulmonary Medicine and Tuberculosis, Groningen, The Netherlands
9. Department of Molecular Neuroscience, UCL Institute of Neurology, London WC1N 3BG, UK 10. Department of Medical & Molecular Genetics, King’s College London SE1 9RT, UK
11. Jenner Institute, University of Oxford, Oxford OX3 7DQ, UK 12. List of members and affiliations appears at the end of the paper 13. Estonian Genome Center, University of Tartu, Tartu, 51010, Estonia
14. Institute of Environmental Medicine, Karolinska Institutet and Sachs’ Children’s Hospital, Stockholm, Sweden
15 Department of Statistics, University of Oxford, UK
16. Wellcome Trust Centre for Human Genetics, University of Oxford, Oxford OX3 7BN, UK
17. Centre for Statistics in Medicine Nuffield Department of Orthopaedics, Rheumatology and Musculoskeletal Sciences, University of Oxford, UK
18. Department of Genetic Medicine and Development, University of Geneva Medical School, Geneva, Switzerland
19. Oxford Centre for Diabetes, Endocrinology & Metabolism, University of Oxford, Oxford, UK
20. William Harvey Research Institute, Barts and The London School of Medicine and Dentistry, Queen Mary University London, London, UK
21. Princess Al-Jawhara Al-Brahim Centre of Excellence in Research of Hereditary Disorders (PACER-HD), King Abdulaziz University, Jeddah 21589, Saudi Arabia
22. Faculty of Medicine and Health Sciences, School of Medicine, University of Nottingham, Nottingham, UK 23. Respiratory Medicine, University of Oxford, Oxford, UK
24. UK Small Area Health Statistics Unit, MRC-PHE Centre for Environment and Health, School of Public Health, Imperial College London, UK
25. Imperial College Healthcare NHS Trust, St Mary’s Hospital, Paddington, London, UK 26. Institute of Infection, Immunity & Inflammation, University of Glasgow, UK
27. Wellcome Trust Sanger Institute, Hinxton, Cambridgeshire, UK 28. Department of Biostatistics, University of Liverpool, Liverpool, UK
2
Table of Contents
Supplementary Methods
... 3
Description of selection of 50,008 samples from UK Biobank (n=502,682)
... 3
Description of array design and genotyping process
... 5
Description of post-genotyping quality control (QC) steps undertaken for samples and variants
... 8
Description of genotype imputation using 1000 Genomes Project and UK10K Project reference
panels
... 15
Description of association testing for autosomal and X, Y and mitochondrial variants
... 17
Proportion of variance explained
... 17
Genome-wide analysis of SNP x smoking interaction
... 17
Association with GOLD Stage 2+ COPD for novel signals of association with extremes of FEV
1 . 18Analysis of polygenic architecture of diseases and health-related traits
... 18
Association with self-reported/doctor diagnosed asthma of loci previously reported for
genome-wide significant association with asthma
... 21
Effect on quantitative FEV
1for novel signals of association with extremes of FEV
1 ... 21Analysis of expression data from lung, blood and brain tissues to identify if our novel signals affect
gene expression (eQTL)
... 21
Analysis of differential expression of candidate genes in the lungs of individuals with and without
COPD
... 22
Analysis of differential expression of candidate genes in the developing foetal lung
... 22
Messenger RNA sequencing in human bronchial epithelial cells (HBECs) to identify novel
transcripts of genes at novel loci associated with the extremes of FEV
1 ... 22Pathway analysis using MAGENTA
... 23
Stepwise conditional analysis to identify additional independent signals at the novel loci
... 23
Imputation and association testing of structural variation haplotypes in the inversion locus at
chromosome 17q21.31 (
KANSL1
)
... 23
Corroborative evidence supporting loci with genome-wide significant evidence of association with
extremes of FEV
1 ... 24Corroborative evidence supporting loci with genome-wide significant evidence of association with
smoking behaviour (heavy smokers vs never smokers)
... 24
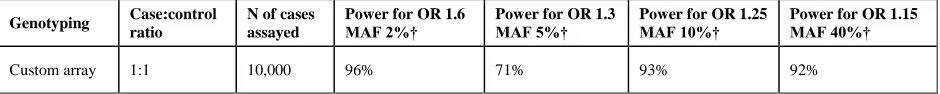
Power Calculations
... 25
Analysis to identify whether variants with a high functional score explain the signal.
... 26
Gene-based analysis of rare and low-frequency variants (MAF < 5%) using SKAT-O
... 26
Analysis of the effect of geographical location on novel loci
... 26
Supplementary Tables
... 29
Supplementary Figures
... 95
UK Brain Expression Consortium
... 124
OxGSK Consortium
... 125
Appendix 1:
... 127
UK Biobank Unique Identifiers (UDIs) used to select individuals for UK BiLEVE.
... 127
OxGSK Consortium information
... 128
3
Supplementary Methods
Description of selection of 50,008 samples from UK Biobank (n=502,682)
This section describes how UK Biobank samples were selected for inclusion in this study (UK Biobank Lung Exome Variant Evaluation (UK BiLEVE) consortium study).
Sampling frame
UK Biobank contained information for 502,682 individuals, of which 472,858 were of white European ancestry (based on UK Biobank Unique Data Identifier (UDI) 21000). A total of 426,797 individuals of white European ancestry had at least 2 Forced Expiratory Volume in 1 second (FEV1) (UDI 3063) and forced volume vital
capacity (FVC) (UDI 3062) measures and had complete information for spirometry method used, age, sex and standing height (UDIs 23, 21003, 31 and 50, respectively). Spirometry was undertaken using a Vitalograph Pneumotrac 6800. The participant was asked to record two to three blows (lasting for at least 6 seconds) within a period of about 6 minutes. The reproducibility of the first two blows was compared and, if acceptable (defined as a <5% difference in FVC and FEV1), a third blow was not required. A total of 275,939 participants had
spirometry measures which met ERS/ATS guidelines1 and these individuals were taken forward as the sampling frame for further selection. Post-bronchodilator spirometry was not available for any participants and medication was not withheld prior to spirometry being undertaken.
Never smokers were defined as individuals who had not smoked tobacco in the past and did not currently smoke tobacco. Ever smokers were defined as individuals who currently smoked cigarettes most days or occasionally, or who had smoked cigarettes in the past on most days or occasionally, or who had tried smoking once or twice. Current cigar/pipe smokers who smoked most days and previously smoked cigarettes were also designated as ever smokers. A pack years variable was defined for all ever smokers as:
(𝑛𝑢𝑚𝑏𝑒𝑟 𝑜𝑓 𝑐𝑖𝑔𝑎𝑟𝑒𝑡𝑡𝑒𝑠 𝑝𝑒𝑟 𝑑𝑎𝑦
20 ) × (𝑎𝑔𝑒 𝑠𝑡𝑜𝑝𝑝𝑒𝑑 𝑠𝑚𝑜𝑘𝑖𝑛𝑔 − 𝑎𝑔𝑒 𝑠𝑡𝑎𝑟𝑡𝑒𝑑 𝑠𝑚𝑜𝑘𝑖𝑛𝑔)
For individuals who gave up smoking for more than 6 months, pack years was defined as:
(𝑛𝑢𝑚𝑏𝑒𝑟 𝑜𝑓 𝑐𝑖𝑔𝑎𝑟𝑒𝑡𝑡𝑒𝑠 𝑝𝑒𝑟 𝑑𝑎𝑦
20 ) × (𝑎𝑔𝑒 𝑠𝑡𝑜𝑝𝑝𝑒𝑑 𝑠𝑚𝑜𝑘𝑖𝑛𝑔 − 𝑎𝑔𝑒 𝑠𝑡𝑎𝑟𝑡𝑒𝑑 𝑠𝑚𝑜𝑘𝑖𝑛𝑔 − 0.5)
A percentage of life span smoking variable was defined as:
(𝑛𝑢𝑚𝑏𝑒𝑟 𝑜𝑓 𝑐𝑖𝑔𝑎𝑟𝑒𝑡𝑡𝑒𝑠 𝑝𝑒𝑟 𝑑𝑎𝑦
20 ) × (
𝑎𝑔𝑒 𝑠𝑡𝑜𝑝𝑝𝑒𝑑 𝑠𝑚𝑜𝑘𝑖𝑛𝑔 − 𝑎𝑔𝑒 𝑠𝑡𝑎𝑟𝑡𝑒𝑑 𝑠𝑚𝑜𝑘𝑖𝑛𝑔 𝑎𝑔𝑒 𝑎𝑡 𝑟𝑒𝑐𝑟𝑢𝑖𝑡𝑚𝑒𝑛𝑡 − 16 )
For individuals who gave up smoking for more than 6 months, percentage of life span smoking was defined as:
(𝑛𝑢𝑚𝑏𝑒𝑟 𝑜𝑓 𝑐𝑖𝑔𝑎𝑟𝑒𝑡𝑡𝑒𝑠 𝑝𝑒𝑟 𝑑𝑎𝑦
20 ) × (
𝑎𝑔𝑒 𝑠𝑡𝑜𝑝𝑝𝑒𝑑 𝑠𝑚𝑜𝑘𝑖𝑛𝑔 − 𝑎𝑔𝑒 𝑠𝑡𝑎𝑟𝑡𝑒𝑑 𝑠𝑚𝑜𝑘𝑖𝑛𝑔 − 0.5 𝑎𝑔𝑒 𝑎𝑡 𝑟𝑒𝑐𝑟𝑢𝑖𝑡𝑚𝑒𝑛𝑡 − 16 )
For current smokers, pack years variables were calculated using age at recruitment in place of age stopped smoking. Heavy smokers were defined as individuals with a percentage of life span smoking ≥ 42% (equivalent to a minimum pack years of 10 in the youngest participants). See Appendix 1 for all UDIs for smoking behaviour.
Within the 275,939 European ancestry individuals with 2 or more FEV1 and FVC measures which met
ERS/ATS guidelines and who had non-missing information for spirometry method, age, sex and standing height, 105,281 were never smokers and 46,763 were heavy smokers. After exclusion of 14 individuals who had outlying FEV1 after adjusting for sex, age, age2, height and height2, 105,272 never smokers and 46,758 heavy
smokers remained.
4 Allocation to lung function subgroups
Individuals were grouped into 58 age-sex bands (29 age bands per sex; ages 39, 40 and 41 were grouped into one band and ages 69, 70 and 72 were grouped into one band with ages 42 to 68 each forming a separate band). Predictive values to calculate percent predicted FEV1 were calculated within each age-sex band in healthy never
smokers only by linear regression with FEV1 as the response variable and standing height as the only covariate
with the following equation:
predicted FEV1 = β0(age−sex band)+ β1(age−sex band)height
Percent predicted FEV1 was then calculated for the i th
individual within each age-sex band:
% predicted FEV1 i= FEV1i
predicted FEV1 i× 100
Our study design specified the selection of 10,000 individuals with low percent predicted FEV1, 10,000
individuals with average percent predicted FEV1 and 5,000 individuals with high percent predicted FEV1 from
each of the heavy smoker and never smoker groups (50,000 individuals in total). Sampling was undertaken such that equal numbers of males and females were selected in total and the numbers of individuals selected from each age-sex band were proportional to the number of individuals in the band being sampled from.
For heavy smokers and never smokers separately, individuals were ranked to define each FEV1 subgroup (high,
low and average) within each age-sex band according to their percent predicted FEV1 such that the 5,000
individuals with the highest percent predicted FEV1 were selected for the high FEV1 subgroup and the 10,000
individuals with the lowest percent predicted FEV1 were selected for the low FEV1 subgroup. For the average
FEV1 subgroup, the median percent predicted FEV1 within each age-sex band was calculated and individuals
were ranked according to the distance of their percent predicted FEV1 to the median (the individual with percent
predicted FEV1 closest to the median was therefore ranked 1). 10,000 individuals were then selected for the
average FEV1 subgroup. Where individuals had the same percent predicted FEV1, they were ranked in a random
order.
An extra 5% of individuals were also selected for each FEV1 subgroup and age-sex band to use as reserves. A
total of 50,008 individuals were selected (additional 8 selected to complete plates). Provision of sample IDs to UK Biobank for DNA extraction
The 50,008 selected individuals were randomised (using a random number generator in R) and sample IDs were provided to UK Biobank who undertook DNA extraction (described below) in the order in which the sample IDs were listed. For samples which failed DNA extraction quality control steps, we selected a replacement from the reserve list for the same lung function subgroup and age-sex band as the failed sample. This list of reserve sample IDs was randomised and provided to UK Biobank such that DNA extraction and genotyping of these replacement samples (after randomisation) was undertaken last.
Sample descriptives
Supplementary Methods Figure 1 shows the distribution of mean % predicted FEV1 by age for each FEV1
5 Supplementary Methods Figure 1: Distributions of mean % predicted FEV1 by age in each FEV1 group in
heavy and never smokers separately.
Description of array design and genotyping process
The Affymetrix Axiom® array used for genotyping the UK BiLEVE samples was an early version of the UK Biobank Axiom® array which has subsequently been made publicly available (and used to genotype the rest of UK Biobank). Details of the final version of the UK Biobank Axiom® array, are available at
http://media.affymetrix.com/support/technical/brochures/uk_axiom_biobank_contentsummary_brochure.pdf?cm pid=2014070005.
The UK BiLEVE array was designed to i) measure rare functional variation (akin to the aims of commercially available “exome chip” arrays), ii) provide a framework for optimal imputation of variants that are common (minor allele frequency (MAF) > 5%) or low frequency (MAF 1 to 5%) in the European population, and iii) optimise coverage of genes and genomic regions with established or putative roles in lung health and disease. As the UK BiLEVE array design was to form the basis for the UK Biobank array, additional categories of variants were included which were of potential relevance to a broad range of phenotypes. The UK BiLEVE array and the UK Biobank Axiom arrays have > 95% identical content.
6 Array design: Genome-wide coverage for imputation
A key objective for the UK BiLEVE array was to achieve high imputation accuracy in the 1% to 5% MAF range. Variants were selected from Affymetrix databases using a custom algorithm. A total of 246,055 variants in the 5% to 50% were selected from the 1000 Genomes CEU population. This set was boosted to improve imputation in the UK population and in the 1% to 5% MAF range by the addition of 102,514 variants with MAF 5% to 50% from the EUR population (union of CEU, GBR, FIN, IBS and TSI populations) and a further 293,050 variants with MAF 1% to 5% in the EUR population. These booster variants were polymorphic in CEU and GBR populations.
Array design: Rare functional variation
Approximately 130,000 rare coding variants from two sources were included on the array; the exome chip project (http://genome.sph.umich.edu/wiki/Exome_Chip_Design) and the Exome Aggregation Consortium (ExAC) (http://exac.broadinstitute.org/). In brief, the exome chip project developed a design for an array based on exome sequencing data from > 12,000 individuals of multiple ancestries (predominantly European). Allele frequency information collected by the UK Exome chip consortium, and from ExAC European exome sequencing data and UK10K non-Finnish exome sequencing data informed selection of variants expected to be polymorphic in the 500,000 individuals in UK Biobank.
Rare coding variants were selected according to estimated minor allele frequencies (EMAFs) as follows: - All protein truncating variants (PTV, e.g. premature stop, frameshift, loss of start) with
EMAF > 0.0002
- PTV variants with 0.00005 < EMAF < 0.0002 which require 1 or 2 features (see above) - Additional PTV variants present in the ExAC exomes with EMAF > 0.0002
In addition, 21,000 rare variants in cancer and cardiac disease predisposition genes, as well as other disorders relevant to lung function were selected from HGMD (Human Gene Mutation database).
Array design: Respiratory content
Additional content was added to the design to optimise coverage of variants and genomic regions with known or putative associations with lung function.
Lung function associated variants included in the design were:
- 26 top variants previously reported as being associated with lung function2-5 plus two tag variants (r2 > 0.9 where possible) each.
- Approximately 390 variants representing potentially interesting regions which showed evidence of nominal significance for association with lung function4, plus 1 tag variant (r2 > 0.9) where available. In brief, all variants with P < 10-4 for either FEV1 or FEV1/FVC and which were defined as
independent (r2 < 0.5 with other variants with P < 10-4) were extracted from the genome-wide meta-analysis results (www.GWAScentral.org, identifier: HGVST946).
- Variant rs9316500 associated with lung function decline (not GW-significant)6 plus one tag variant. - 20 exonic variants with P < 10-3 for association with resistance to smoking related airflow obstruction7
plus 2 tags per variant.
- 92 novel putatively functional variants identified in a whole exome sequencing experiment of 100 individuals with resistance to smoking related airflow obstruction7 (earlier version of the analysis than that published).
- 982 exonic variants identified in a whole exome sequencing experiment of 100 individuals with resistance to smoking related airflow obstruction7 and which lie within the 26 lung function-associated loci2-5.
- 58 variants showing nominal evidence of association in an unpublished study of longitudinal lung function.
COPD associated variants included explicitly in the design were:
- Top variants from Wilk et al COPD GWAS8, a variant in MMP12 which showed evidence of association with COPD in a candidate gene study9 and variants with P < 5 x 10⁻⁴ evidence for association with lung function in a set of COPD candidate genes (SERPINA1, MACROD2, ABCC1, CNTN5 and PDE4D3, 10), plus one tag variant per variant.
- Approximately 390 variants representing potentially interesting regions which showed nominal significance for association with COPD8. In brief, all variants with P < 10-4 for association with COPD and which were defined as independent (r2 < 0.5 with other variants with P < 10-4) were extracted from the full 2.5million publicly available results.
- 16 variants showing suggestive evidence of association with COPD in a pooled case-control analysis of re-sequencing data from the 26 lung function regions, plus 1 tag variant per variant (unpublished). - 16 variants in SERPINA1 including the Z and S alleles and all variants that exist in the OMIM database
7 Asthma associated variants included explicitly in the design were:
- 63 variants listed for asthma phenotypes in the GWAS catalog as downloaded on 23rd January 2013 plus one tag variant per variant.
- 111 variants representing potentially interesting regions which showed evidence of nominal significance for association with severe asthma11. In brief, all variants with P < 10-4 for association with severe asthma and which were defined as independent (r2 < 0.5 with other variants with P < 10-4) were extracted from the full 2.5million imputed database.
Smoking, idiopathic pulmonary fibrosis (IPF) or lung cancer associated variants included explicitly in the design were:
- 21 variants with genome-wide significant (P < 5 x 10⁻⁸) evidence of association with cigarettes smoked per day, smoking cessation and smoking initiation12-14 plus 2 tag variants per variant.
- Variants with genome-wide significant evidence of association with IPF15, 16 in the MUC5B promoter and TERT, plus one tag variant per variant.
- Four variants associated with lung cancer17.
Regions showing robust or putative association with lung function and/or disease were highlighted for inclusion of additional content to boost imputation coverage and quality. These regions were:
- 26 regions associated with lung function2-5, defined based on P values and linkage disequilibrium (LD) (variants with – 𝑙𝑜𝑔10(𝑃 − 𝑣𝑎𝑙𝑢𝑒) > 2.5 and not further from 50kb away from the next variant were selected, including any gene intersecting with the region or the nearest gene, if the region did not include any, ±10kb).
- Chromosome 15q25 region which shows strong association with smoking behaviour 12-14, defined as chr15: 78720518-79113773 (build 37).
- Six additional regions associated with smoking behaviour, defined based on region of association illustrated in published region plots12-14.
- Three regions ±10kb of three genes associated with IPF (TERT, MUC5B and TERC)15, 16, 18 Summary of final array content
Of the 808,370 variants targeted in the design, 802,283 were able to be assayed directly by at least 1 probe on the Axiom® UK BiLEVE genotyping array. A tag variant was assayed for 5,340 variants that could not be directly measured, with 134 tag variants being used for more than 1 target variant and 951 tag variants also being a target variant, giving a total of 806,626 unique variants. An additional 785 variants included by Affymetrix for quality control purposes, gave a total of 807,411 variants assayed by the array. 781,732 variants were targeted by a single probe, with 25,679 targeted by 2 probes to increase the chance of successful genotyping, giving a total of 833,090 probes on the array.
Genotyping
DNA extraction was undertaken at the UK Biobank laboratories ( http://www.ukbiobank.ac.uk/wp-content/uploads/2014/04/DNA-Extraction-at-UK-Biobank-October-2014.pdf). 850ul buffy coat from 9ml of whole blood was extracted on a custom TECAN Freedom EVO® 200 platform using Promega Maxwell® 16 Blood DNA Purification Kit (AS1010) (modified to optimise DNA yield from a large volume of buffy coat, including additional lysis and wash buffer and an additional pass through the extraction process). DNA concentration and quality was assessed via 260/280 using a Trinean DropSense® 96. DNA concentration was required to be > 10ng/ul for > 80% of samples on a plate and purity as measured by 260/280 was required to be between 1.8 and 2.2 for > 80% of samples on the plate. Samples were shipped on dry ice for genotyping. Samples were shipped to Affymetrix, Santa Clara, CA, USA for genotyping. Genotype calling was undertaken using Affymetrix Power Tools v1.15.1 (Axiom® GT1 algorithm) in 11 batches of 4,800 samples comprised of UK BiLEVE samples and Affymetrix control samples (numbers shown in Supplementary Methods Table 1).
Genotyping batch
b1 b2 b3 b4 b5 b6 b7 b8 b9 b10 b11
UK BiLEVE
samples 4,598 4,606 4,589 4,603 4,600 4,573 4,596 4,597 4,595 4,600 4,604
Affymetrix
Controls 202 194 211 197 200 227 204 203 205 200 205
Total 4,800 4,800 4,800 4,800 4,800 4,800 4,800 4,800 4,800 4,800 4,809
Supplementary Methods Table 1: Numbers of UK BiLEVE samples and Affymetrix control samples in each genotyping batch
8 variants (unpublished data comparing genotype calls with re-sequencing data from non UK BiLEVE samples, Affymetrix).
Description of post-genotyping quality control (QC) steps undertaken for samples and variants Variants were excluded prior to sample QC if they failed the basic Affymetrix genotyping quality metrics indicating poor genotype clustering (cluster QC). This included exclusion of variants for which more than three genotype clusters were observed (indicating an off-target measurement), for which the call rate was less than 95% or for which there was failure of one of three cluster quality metrics (Fisher’s linear discriminant (FLD), Heterozygous cluster strength offset (HetSO), Homozygote Ratio Offset (HomRO)) defined in the Affymetrix Axiom® Genotyping Solution Data Analysis Guide
(http://media.affymetrix.com/support/downloads/manuals/axiom_genotyping_solution_analysis_guide.pdf). Where a variant was assayed by 2 probes the genotypes from the probe with the highest call rate were used. A total of 50,561 UK BiLEVE samples were genotyped. Samples were excluded sequentially from the analysis according to each of the following criteria (n indicates the number of samples excluded for each step) (Supplementary Methods Table 2):
1. Poor DNA quality – Indicated by Affymetrix’s dish QC (dQC) metric. Samples were excluded if dQC < 0.82. (n=100)
2. Call rate – Samples with call rate < 97% were excluded by Affymetrix in an initial round of genotype clustering. The batches were then re-clustered without these samples. (n=31)
3. Sex mismatch – Samples were excluded if the sex inferred from X chromosome genotypes did not match submitted sex (see below for method). (n=125)
4. Call rate - Samples with a call rate < 95% after the second round of clustering were excluded. (n=1) 5. Outlying heterozygosity (high or low, indicative of a contaminated sample) – Samples with
heterozygosity which was three standard deviations (SD) from the mean heterozygosity of all samples were excluded (see below for method). (n=333)
6. Unintended duplicates – Samples which share > 98% of alleles identical by descent (IBD) were consistent with either being duplicated samples (with different IDs) or identical twins. Where the duplication could be resolved (e.g. where we could identify which sample of the pair had the correct ID, or they were likely to be twins based on other information) then only 1 sample of the pair was excluded, otherwise both samples were excluded. (n=17)
7. Intended duplicates –The sample with the lowest genotyping call rate from each pair of intended duplicates was removed. (n=481)
8. Principal Components Analysis (PCA) outliers – Ancestry informative principal components (PCs) were derived from variant genotypes (see detailed methods below). Samples with a score for any of the first 10 principal components that was outside 10 SD from the mean were excluded. (n=104)
9. Withdrawn consent – One individual withdrew consent from further study after steps 1 to 8 above had been completed. This sample was excluded from all subsequent steps. (n=1)
10. Related individuals (see detailed methods below) – For any pair of samples which shared more than 20% of alleles IBD, the sample with the lowest call rate was excluded. Where more than 2 samples were mutually related, examination of the relationships between the samples was studied to identify which sample(s) were excluded. (n=515)
Details of each step are given below. A total of 48,943 samples remained for subsequent analysis.
Removed Remaining
No filters 0 50,561
DNA quality (dQC) 10 50,551
Initial clustering CR<97% 31 50,520
Sex mismatch 125 50,395
Final clustering CR<95% 1 50,394
Heterozygosity outlier 333 50,061
Unintended duplicates 17 50,044
Intended duplicates 481 49,563
PCA outliers 104 49,459
Withdrawn participant 1 49,458
Related individuals 515 48,943
Supplementary Methods Table 2: Sample exclusions
Sample QC: Sex mismatches
9 intensities (XY ratio) against X chromosome heterozygosity rate (X het rate) was plotted. Secondly, using PLINK v1.0719, the chromosome X inbreeding (homozygosity) estimate, F, was used to classify samples as male (F > 0.8), female (F < 0.2) or unknown/ambiguous (0.2 < F < 0.8). A total of 82 samples were reported as showing a sex mismatch using both methods and an additional 28 samples were reported using the PLINK approach (Supplementary Methods Figure 2). Seventeen of the samples reported by PLINK only, and one sample reported by both methods were subsequently found to be heterozygosity outliers and were excluded. Thirty-one of the samples detected by both methods had an XY ratio indicative of being male and an X het rate indicative of being female suggesting that these samples had two copies of the X chromosome and a Y chromosome, consistent with Klinefelter syndrome and were excluded from further analysis. Plots of X het rate and XY ratio of the 11 remaining samples reported as showing a sex mismatch by PLINK were re-examined. Three of these samples had a low XY ratio and low X het rate and were likely to be XO (Turner syndrome) or XX/XO mosaics. All 11 samples were subsequently excluded leading to a total exclusion of 110 samples for sex mismatches.
Supplementary Methods Figure 2: Samples reported as having a different sex based on genotype data to that provided by UK Biobank
Sample QC: Heterozygosity
Heterozygosity rate per sample was calculated based on 602,584 autosomal variants with MAF>1%. Supplementary Methods Figure 3 shows a scatter plot of heterozygosity rate against call rate. A total of 333 Samples with a heterozygosity rate greater than 3 SD from the mean were excluded.
82 samples reported
as sex inconsistency
by analysis of XY ratio
and X het rate
110 samples
reported as sex
inconsistency by
PLINK method
18 heterozygosity
outliers
32 samples identified as
XXY by analysis of XY ratio
10 Supplementary Methods Figure 3: Heterozygosity rate vs sample call rate.
Sample QC: Relatedness estimation
The proportion of alleles shared IBD, inferred using PLINK v1.0719, was used to identify unintended duplicates, confirm intended duplicates and infer relatedness. A subset of autosomal variants was selected based on the following criteria: MAF > 1%, Hardy Weinberg Equilibrium (HWE) (P > 10-6), outside regions of strong LD and inversions. These variants were then pruned based on LD (r2 > 0.2 within 50 variant windows) to identify a subset of 244,507 independent variants.
Supplementary Methods Figure 4 shows a scatterplot of the proportion of variants where a pair share 1 allele IBD (Z1) plotted against the proportion sharing 0 alleles IBD (Z0). Hence parents and offspring who share 1 allele IBD at all genotypes (Z1=1, Z0=0) are in the top-left, duplicates and identical twins share 2 alleles IBD across all variants and hence have 0 variants sharing only 1 or 0 alleles IBD (Z1=0, Z0=0) and siblings on average have 50% of variants where they share 1 allele IBD and 25% of variants where they share 0 alleles IBD (Z1=0.5, Z0=0.25). Cousins, half-siblings etc. lie on the line of slope -1, intercept 1, with relatedness decreasing towards Z1=1, Z0=0. A threshold of PI_HAT < 0.2 was used to define unrelated pairs where PI_HAT = Z2 + 0.5 × Z1.
11 Supplementary Methods Figure 4: Proportion of genotypes where a pair share 1 allele IBD (Z1) plotted against the proportion sharing 0 alleles IBD (Z0) for samples submitted as unique (left panel) and samples submitted as intended duplicates (right panel). Each point represents a pair of samples.
Seven unintended duplicate pairs were identified and were reported back to UK Biobank. Further investigation of these pairs led to exclusion of 6 unique participants corresponding to 17 sets of genotype data.
A total of 481 duplicate pairs which were intended were identified and the sample with the lowest call rate of the pair was removed in each case.
Sample QC: Principal components analysis of ancestry
The intersection of variants used for IBD analysis (described above) and the HapMap3 reference panel were used for PCA of ancestry (43,232 variants). Principal component variant weightings were derived using 987 unrelated HapMap samples and then used to calculate the scores on the principal components of the UK BiLEVE samples using EIGENSOFT 4.2. Supplementary Methods Figure 5 shows that the UK BiLEVE samples’ principal component scores lie in the region associated with European ancestry (HapMap CEU and TSI) as expected. Samples which were more than 10 SD outside of the mean score for any of the first 10 principal components were excluded. A total of 104 samples (58 male, 46 female) were excluded, with the following breakdown of outliers excluded by principal component: PC1=19, PC2=56, PC3=22, PC5=7.
Parent/offsping
Siblings
Unintended duplicates or identical twins
Intended duplicates
12 Supplementary Methods Figure 5: First 2 ancestry principal components for HapMap3 populations (top), with UK BiLEVE samples overlaid (bottom).
±10SD
13 To test whether there was an association between PCA outlier status and lung function subgroup, we performed a chi-squared test and found no significant evidence of association (P=0.07) (Supplementary Methods Table 3).
Heavy smokers Never smokers
Outlier Low FEV1 Average FEV1 High FEV1 Low FEV1 Average FEV1 High FEV1
FALSE 9,883 9,902 4,955 9,855 9,907 4,950
TRUE 19(-2) 25(+4) 6(-4) 31(+10) 16(-5) 7(-3)
Supplementary Methods Table 3: Contingency table for association of PCA outlier status with phenotype group. The difference from the expected count under independence is shown in brackets.
Sample QC: Related individuals
Prior to PCA analysis, a total of 526 pairs of samples showed evidence of relatedness by IBD analysis (PI_HAT > 0.2, see above). One of the samples in one of these pairs was subsequently excluded by the PCA analysis leaving 525 pairs of samples showing evidence of relatedness. Although association testing methods that take relatedness into account are well-developed, given the small proportion of related individuals amongst the UK BiLEVE samples (~1%), we excluded related individuals from downstream association testing as follows (NB: related individuals were included in the imputation process but excluded prior to association testing).
Of the 525 pairs of samples showing evidence of relatedness, 1,000 samples were related to only one other sample and for these 500 pairs, the sample with the lowest call rate was excluded. Within the remaining 25 pairs, 30 samples were related to more than one other sample (indicative of more than 2 members of the same family). For these 25 pairs, we grouped the samples into families and assessed family relationships based on ages and sex. In all families, all samples were recruited from the same recruitment centre. We excluded individuals from each family so as to retain as many unrelated individuals as possible. For example, for a mother-father-offspring trio, the offspring was excluded so as to retain the unrelated mother and father. Where only one sample could be retained from a family, the sample with the highest call rate was selected. A total of 515 samples were excluded from association testing.
Variant QC: plate effects
14 Supplementary Methods Figure 6: Number of plates out of 550 showing a plate effect for N variants. There were 116 plates that showed a plate effect for a single variant. The worst performing plate showed a plate effect for 1,457 variants (0.2% of total of 807,411 variants).
Following merging of variants across all 11 batches, for a given variant, if there was a batch that had a significantly different allele frequency compared to the other batches then that variant was flagged as exhibiting a batch effect. A total of 4,009 variants were flagged as having a batch effect.
Variants which failed cluster QC or plate effect QC in more than 2 batches were considered to have failed overall and were removed from the data set. Variants which failed in 1 or 2 batches had all genotypes set to missing in those 1 or 2 batches but genotypes were retained for other batches. NB: a variant that failed in 1 batch would have had a maximum call rate in the final merged data set of 91% and a variant that failed in 2 batches would have had a maximum call rate in the final merged data set of 82%. A total of 782,260 variants remained after QC.
15 Supplementary Methods Figure 7: Number of variants out of 807,411 failing different genotyping QC filters in N batches. Cluster QC is the clustering quality filters calculated by Affymetrix based on relative genotype cluster positions (FLD, HomRO, HetSO etc.) and also call rate <95%. Note for Batch Effect filter, once a variant had failed in 3 batches no further testing was done.
Description of genotype imputation using 1000 Genomes Project and UK10K Project reference panels Variants with MAF < 1% (123,306 variants) and HWE P<10-6 (39,924 variants) were excluded leaving 619,030 variants for input into imputation. Pre-imputation phasing was performed with SHAPEIT v2.r727 and SHAPEIT v3 across all 49,458 samples, separately by chromosome, using the default parameters and HapMap phase II map of recombination sites. Imputation was undertaken against the 1000 Genomes Project Phase 120 and UK10K21 (EGA study and dataset codes: EGAS00001000713 and EGAD00001000776) reference panels which were combined using IMPUTE2 v2.3.1 (using the –merge-ref-panels option22 with a buffer of 250 kb and an effective population size of 20,000). 7,053,246 singletons not present in the UK10K panel, 23,932 sites with a SNP and an INDEL at the same position and 443 within large structural deletions were removed from the 1000 Genomes panel before merging. The combined reference panel consisted of 42,792,356 variants across a panel of 4,783 samples. Imputation was undertaken in subsets of 5,000 samples and in 3 Mb genomic chunks with a 250 kb overlap between adjacent chunks. After imputation of all 49,458 UK BiLEVE samples, imputation quality information scores were re-calculated across the 49,458 using QCTOOL v1.4 (-snp-stats option) and used for subsequent filtering. A total of 3,076 variants were genotyped in UK BiLEVE, had MAF > 1% and HWE P > 10-6 and were input into the imputation but were not in the combined reference panel. This led to a final imputation output of 42,795,484 variants. Variants with an imputation quality information score (INFO) < 0.5 were excluded. A total of 55,260 directly genotyped variants were of MAF < 1% or HWE P < 10-6 and so were excluded from the input for imputation and were not in the combined reference panel. These variants were merged back into the dataset and 28,509,962 variants were taken forward for association testing.
Of our 21.6 M well-imputed and genotyped-only, common autosomal variants (imputation INFO > 0.5, MAC ≥ 20), 6,279 (0.03%) had HWE P < 10-6 and 2,359 had HWE P < 10-12.
17 Description of association testing for autosomal and X, Y and mitochondrial variants
Genome-wide association testing was carried out for the following nested comparisons Heavy smokers with low FEV1 vs heavy smokers with high FEV1
Never smokers with low FEV1 vs never smokers with high FEV1 Heavy smokers with low FEV1 vs heavy smokers with average FEV1 Never smokers with low FEV1 vs never smokers with average FEV1 Heavy smokers with high FEV1 vs heavy smokers with average FEV1 Never smokers with high FEV1 vs never smokers with average FEV1 Heavy smokers vs never smokers
Within each comparison subset of the data, variants with a MAC < 3 were discarded. 515 samples were excluded due to evidence of relatedness, as described above. Association testing of each case-control group was undertaken using SNPTEST v2.5b423 (score test) under an additive genetic model of genotype dose (continuous from 0 to 2 reflecting imputation uncertainty), with the first 10 ancestry principal components as covariates and pack years of smoking as an additional covariate in the heavy smoking stratum. The same association model was used for the X chromosome but with male reference allele coded as 0 and alternate allele as 2; likewise for the Y chromosome (female samples removed) and mitochondrial (MT) SNPs (0 to 2 for both male and female) (Supplementary Table 20). For variants with MAC < 400 the association testing was repeated using the Firth test implemented in EPACTS v3.2.4, which is better calibrated for testing low MAC variants than the score test24. The genomic control inflation factor lambda was calculated across autosomes for each comparison and used to adjust for population stratification.
For all chromosomes, a P value threshold of 5x10⁻⁸ was used to signify genome-wide significant association. P < 5 x 10⁻⁷ was used to signify suggestive association for autosomal chromosomes and chromosome X. Bonferroni-corrected suggestive significance thresholds for signals on the Y and MT chromosomes and in the pseudo-autosomal region were defined as P < 2 x 10⁻⁴ (250 variants), P < 3.6 x 10⁻⁴ (3.3 x 10⁻⁴, 140 variants) and P < 3.7 x 10⁻⁵ (1342 variants), respectively.
Full genome-wide association results are available via UK Biobank (access@ukbiobank.ac.uk). Selection of signals
“Sentinel” variants representing independent signals of association were identified by iteratively selecting the variant with the lowest P value, assigning that variant as a sentinel and excluding all variants +/-500kb from the sentinel variant before repeating the process. Sentinel variants were annotated using ANNOVAR25. For sentinel variants with MAC < 400, we repeated local imputation and association testing following removal of genotyped SNPs with poor clustering (judged by eye); the variant was retained if P<5x10⁻⁸ following re-analysis.
Calculations of linkage disequilibrium
LD between variants was calculated based on all 49,458 samples using vcftools v0.1.12a (--geno-r2 option i.e. squared correlation coefficient between genotypes encoded 0 to 2).
Proportion of variance explained
The proportion of variance in FEV1 explained by the previously and newly reported variants was calculated as: ∑𝑛𝑖=12𝑓𝑖(1 − 𝑓𝑖)𝛽𝑖2
𝑉
where n is the number of variants fi and βiare the effect-allele frequency and effect estimate of the i’th variant,
and V is the phenotypic variance. We used the effect estimates from a meta-analysis of quantitative FEV1 across
smokers and non-smokers where FEV1 is adjusted for age, age2, sex and height and then rank inverse-normal
transformed. As with previously reported proportion of FEV1 variance explained4 we assumed a heritability of
40% to estimate the proportion of additive polygenic variance. Genome-wide analysis of SNP x smoking interaction
The following statistic was used, both comparing the FEV1 comparison for which the variant was significant in
the heavy smokers with that in the never smokers (or vice versa), and also the low FEV1 vs high FEV1
comparison in the heavy smokers and in the never smokers:
𝑍 = 𝛽ℎ𝑒𝑎𝑣𝑦 𝑠𝑚𝑜𝑘𝑒𝑟𝑠− 𝛽𝑛𝑒𝑣𝑒𝑟 𝑠𝑚𝑜𝑘𝑒𝑟𝑠 √𝑆𝐸ℎ𝑒𝑎𝑣𝑦 𝑠𝑚𝑜𝑘𝑒𝑟𝑠2 + 𝑆𝐸𝑛𝑒𝑣𝑒𝑟 𝑠𝑚𝑜𝑘𝑒𝑟𝑠2
18 A genome-wide scan for smoking interaction was also performed using the above test with the effect estimates and standard errors from the low FEV1 vs high FEV1 comparison in the heavy and never smokers. Variants with
P < 5×10⁻⁷ were followed up with 2 further tests: i) using the same Z statistic as above but with effects and standard errors from a Firth test to control for type I error in low MAC variants; ii) fitting a logistic model, updated from the logistic model used in the main analysis with a variant × smoking interaction term (implemented in R) and using a likelihood ratio test for significance, thereby using the individual level data to estimate the interaction effect.
Association with GOLD Stage 2+ COPD for novel signals of association with extremes of FEV1
We undertook a case-control analysis for all SNPS in novel regions, which showed genome-wide significant association in at least one of the nested lung function comparisons. We selected 9,564 COPD cases, defined as those samples with GOLD Stage 2+ COPD according to spirometry (FEV1/FVC < 0.7 and % predicted
FEV1 < 80%), and 9,453 controls, selected from the high FEV1 strata and with FEV1/FVC > 0.7 (all had %
predicted FEV1 in excess of 80%). Post-bronchodilator spirometry was not available for any participants and
medication was not withheld prior to spirometry being undertaken. Summaries of these samples are given in Supplementary Methods Table 4.
Analyses were carried out using the score test, implemented in SNPTEST v2.5b423 and assuming an additive genetic model of genotype dose. For never smokers, sex, age and the first 10 ancestry principal components were included as covariates. For heavy smokers, pack years were included as an additional covariate. The results for never and heavy smokers were then combined, using inverse variance weighted meta-analysis.
COPD Cases Controls Total
Heavy smokers
n 5,803 4,661 10,464
% predicted FEV1
mean (SD) 61.2 (11.8) 118.0 (8.1)
FEV1/FVC
mean (SD) 0.60 (0.08) 0.78 (0.04)
Never smokers
n 3,761 4,792 8,553
% predicted FEV1
mean (SD) 65.4 (11.4) 130.3 (8.3)
FEV1/FVC
mean (SD) 0.63 (0.07) 0.79 (0.04)
Total 9,564 9,453 19,017
Supplementary Methods Table 4: Sample sizes and mean and standard deviation % predicted FEV1 and
FEV1/FVC of GOLD stage 2+ COPD cases and controls in heavy smokers and never smokers.
Analysis of polygenic architecture of diseases and health-related traits
Risk scores26 and GCTA27, 28 were used a) to investigate whether there was evidence for polygenic architecture29 of FEV1-defined traits, b) to investigate shared genetic aetiology of FEV1 between never smokers and heavy
smokers, c) to identify whether the genetic variants underlying high FEV1 also predicted low FEV1 and d) to
explore shared aetiology between individuals with asthma and individuals without asthma. The scores allow the combined influence of many variants with weak effects to be observed by comparing a discovery group and a target group. GCTA was used to estimate the proportion of variance explained in the target population by subsets of variants chosen from the discovery population.
QC of individuals and genotyped variants was undertaken as described above, with additional exclusion of variants based on HWE (P < 0.001 excluded) and MAF (MAF < 1% excluded). Only autosomal variants were included in these analyses.
The discovery and target groups for each analysis are described below. For each analysis, a GWAS was performed using PLINK v1.9 (Wald test) with the same covariates and additive genetic model, as described above, for the discovery group. For each variant a value for the log odds ratio and P value were obtained. Scores for each allele were assigned as equal to the log odds ratio in the discovery group for variants which met a pre-defined P value threshold (scores were set to zero otherwise). P value thresholds of 1.0, 0.5, 0.4, 0.3, 0.2, 0.1, 0.05, 0.01 and 0.001 were investigated. To aid interpretation of the score analysis, log odds ratios were set in the same direction, i.e. the effect allele was chosen as that with log odds ratio > 0.
Risk scores were then calculated for each individual in the target group by summing the score for each allele multiplied by the number of effect alleles across all variants, i.e.:
Risk score𝑖= ∑(Score for allele)𝑗 𝑛
𝑗=1
× (Number of effect alleles)𝑖,𝑗
19 were associated with the phenotype in the target group, logistic regression was performed with the individuals’ risk score as the only covariate.
The proportion of variance explained by the subset of variants generated for each target population from each P value threshold was calculated using GCTA27, 28. GCTA estimates the genetic relationship between individuals, and then, using REML and adjusting for covariates (in this instance the first 10 principal components and pack years), estimates the proportion of variance explained. Using all variants, for every pair of individuals found to have cryptic relatedness (cut-off value of 0.025) one individual was removed from analyses for each subset of variants. Case-control data is transformed onto a liability scale through an assumed prevalence level30. For investigating shared polygenic effects in FEV1-defined traits, between high FEV1 and low FEV1 and between
asthma and no asthma; prevalence was set to the proportion of low FEV1 (21,000) in the whole sampling frame
(275,915), i.e. the prevalence was set at 7.611%. We based estimates of prevalence on the known sampling frame from which the UK BiLEVE samples were selected with a known sampling strategy. Thus, when investigating the shared genetic architecture of low FEV1 across the strata defined by smoking status the prevalence was assumed to be the number of never smokers with low FEV1 (10,500) divided by the number of
never smokers in the sampling frame (105,272), i.e. a prevalence of 9.974%.
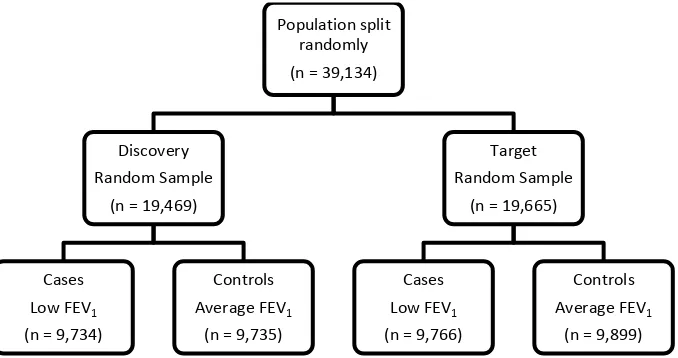
To first investigate whether there was a polygenic component associated with low FEV1, individuals with low
FEV1 and average FEV1 were randomly split into discovery and target populations (Supplementary Methods
Figure 9). To assess whether the genetic variants underlying high FEV1 also predicted low FEV1 (airflow
obstruction), the discovery group comprised individuals with high FEV1 and a random sub-sample of those with
average FEV1. The target sample consisted of those with low FEV1 and the remaining individuals with average
FEV1 who were not included in the discovery sample (Supplementary Methods Figure 10). To investigate the
shared genetic aetiology of low FEV1 between never smokers and heavy smokers, heavy smokers with average
FEV1 and low FEV1 were used as the discovery group and never smokers with average and low FEV1 as the
target group (Supplementary Methods Figure 11). Finally, to investigate shared genetic variants between those with and without asthma, the discovery population was selected as those reporting doctor diagnosed asthma with low FEV1 or average FEV1 and the target population as those with no doctor diagnosed asthma with low FEV1
or average FEV1 (Supplementary Methods Figure 12). Results are presented in Supplementary Table 2. Results
were similar if variants with MAF < 5% were excluded.
Supplementary Methods Figure 9: Sample sizes for the investigation of the polygenic architecture of FEV1-defined traits.
Population split randomly (n = 39,134)
Discovery Random Sample
(n = 19,469)
Cases Low FEV1
(n = 9,734)
Controls Average FEV1
(n = 9,735)
Target Random Sample
(n = 19,665)
Cases Low FEV1
(n = 9,766)
Controls Average FEV1
[image:20.595.121.460.404.583.2]20 Supplementary Methods Figure 10: Sample sizes for the investigation of the shared genetic aetiology between high FEV1 and low FEV1.
Supplementary Methods Figure 11: Samples sizes for the investigation of the shared genetic aetiology between heavy and never smokers.
Supplementary Methods Figure 12: Sample sizes for the investigation of the shared genetic aetiology between individuals with doctor diagnosed asthma and individuals with no doctor diagnosed asthma.
Population split by lung function (n = 48,943)
Discovery High and Average FEV1
(n = 19,551)
Cases High FEV1
(n = 9,809)
Controls Average FEV1
(n = 9,742)
Target Low and Average FEV1
(n = 29,392)
Cases Low FEV1
(n = 19,500)
Controls Average FEV1
(n = 9,892)
Population split by smoking
status (n = 39,134)
Discovery Heavy Smokers
(n = 19,533)
Cases Low FEV1
(n = 9,750)
Controls Average FEV1
(n = 9,803)
Target Never Smokers
(n = 19,581)
Cases Low FEV1
(n = 9,750)
Controls Average FEV1
(n = 9,831)
Population split by asthma
status (n = 39,134)
Discovery Asthma (n = 6,877)
Cases Low FEV1
(n = 4,905)
Controls Average FEV1
(n = 1,972)
Target No Asthma (n = 32,257)
Cases Low FEV1
(n = 14,595)
Controls Average FEV1
21 Association with self-reported/doctor diagnosed asthma of loci previously reported for genome-wide significant association with asthma
Asthma cases were defined as participants that either (i) answered “asthma” to a touchscreen question "Has a doctor ever told you that you have had any of the following conditions? (You can select more than one answer) (Blood clot, DVT, bronchitis, emphysema, asthma, rhinitis, eczema, allergy)”, or (ii) reported asthma in verbal interview, as per any of the self-reported, non-cancer illness fields. Using this definition, we identified 7,488 asthma cases and 41,455 controls within the 48,931 unrelated samples passing the QC steps described above. We tested for association with asthma for 17 variants at 12 loci which had previously shown genome-wide significant (P<5x10⁻⁸) association with asthma11, 31-34. Association testing was undertaking using SNPTEST using a logistic model with genotype dose with 10 ancestry principal components and pack years as covariates (0 for never smokers). Results are in Supplementary Table 1.
Effect on quantitative FEV1for novel signals of association with extremes of FEV1
For each of the 6 novel signals of association with extremes of FEV1, we tested association of FEV1 as a
quantitative trait separately in heavy smokers and never smokers using a linear model with imputed genotype dose and P values from a score test implemented in SNPTEST v2.5. Firstly, residuals from a linear regression of FEV1 with age, age2, sex, height and 10 ancestry principal components were obtained, which were then ranked
and inverse-normal transformed. These normally distributed z-scores were used as the dependent phenotype in the linear regression. Results are presented in Table 2.
Analysis of expression data from lung, blood and brain tissues to identify if our novel signals affect gene expression (eQTL)
Lung
The descriptions of the lung eQTL dataset and subject demographics have been published previously35-37. Briefly, non-tumor lung tissues were collected from patients who underwent lung resection surgery at three participating sites: Laval University (Quebec City, Canada), University of Groningen (Groningen, The Netherlands), and University of British Columbia (Vancouver, Canada). Whole-genome gene expression and genotyping data were obtained from these specimens. Gene expression profiling was performed using an Affymetrix custom array (GPL10379) testing 51,627 non-control probe sets and normalized using RMA38. Genotyping was performed using the Illumina Human1M-Duo BeadChip array (using blood or lung samples). Genotype imputation was undertaken using the 1000G reference panel. Following standard microarray and genotyping quality controls, 1,111 patients were available including 409 from Laval, 363 from Groningen, and 339 from UBC. Lung eQTLs were identified to associate with mRNA expression in either cis (within 1 Mb of transcript start site) or in trans (all other eQTLs) and meeting the 10% false discovery rate (FDR) genome-wide significant threshold. Variants which showed evidence of association (P < 5 x 10⁻⁷) with extremes of FEV1 and
all proxy variants (r2 > 0.3 with the sentinel variants) were queried. The results for the most significant variant × probeset pair for any genes identified in the look-up and the results for the sentinel variant and/or strongest proxy variants are presented in Supplementary Table 9. There was no significant evidence of association (FDR < 10%) for chr12:114743533, chr11:109843513 and rs34712979 (or proxies) in the data set.
Blood
Evidence for association with gene expression in blood was assessed for all variants which showed evidence of association (P < 5 x 10⁻⁷) with extremes of FEV1 or smoking behaviour, and their proxies (r2 > 0.3). A publicly
available resource based on blood expression data from 5,311 individuals, imputed to HapMap 2 was used (resource previously described39). Cis and trans eQTL signals meeting the 10% FDR genome-wide significant threshold were identified. The results for the most significant variant × probeset pair for any genes identified in the look-up and the results for the sentinel variant and/or strongest proxy variants are presented in Supplementary Table 10a. Data were only available where FDR < 50%.
For loci where it could not be established whether an absence of signals with FDR<10% was due to signals of association with FDR > 10% (only results with FDR < 50% were publicly available) or because there were no data for those variants (either due to absence of a proxy in HapMap or variant QC failure), a 1000 Genomes Project imputed eQTL dataset from the Estonian Genome Project was also queried. These loci were those represented by the following sentinel variants: chr12:114743533, rs2047409, rs34712979, rs4466874, rs10193706, rs61784651 and rs10807199 (Table 2).
22 office, including personal data (place of birth, place(s) of living, nationality. etc.), genealogical data (three generation family history), educational and occupational history, and lifestyle data (physical activity, dietary habits, smoking, alcohol consumption, women’s health, quality of life).
EGCUT data contained 469 male and 490 female samples with average age 38.1. All samples were genotyped using HumanCNV370-DUO BeadChip and then imputed using 1000G phase 1 integrated variant set (Mar 2012), all ancestries reference set.
A total of 712 markers representing 8 loci (sentinel variants plus proxies with r2>0.3) were specified and those with INFO > 0.5 were included in linear regression analysis with gene expression data (N=29,018 probes with full annotation information) with adjustments for sex, age, plate-id and top 46 principal components from the expression values with using SNPTEST2 v.2.523 software. Variant × probeset associations with P < 2.15 x 10⁻⁷ (Bonferroni-correction for analysis of 8 loci and 29,018 probes) were retained and results are presented in Supplementary Table 10b.
Brain
Evidence for association with gene expression in brain was assessed for all variants which showed evidence of association (P < 5 x 10⁻⁷) with smoking behaviour, and their proxies (r2 > 0.3). A publicly available resource of expression data from 10 brain regions in 134 individuals, with variant genotype data imputed to 1000 Genomes Project phase 1 reference panel was used (resource previously described40). Cis and trans eQTL signals meeting the 1% FDR genome-wide significant threshold were identified. The results for the most significant variant × probeset pair for any genes identified in the look-up and the results for the sentinel variant and/or strongest proxy variants are presented in Supplementary Table 14.
Analysis of differential expression of candidate genes in the lungs of individuals with and without COPD Genes were defined as candidate genes for novel signals of association with extremes of FEV1 if they contained
a) the sentinel variant or were the nearest genes, b) a putatively functional variant within the gene, correlated with the sentinel variant, was identified through conditional analysis as explaining the observed association (see Supplementary Table 21) or c) the sentinel variant or a strong proxy variant (r2 > 0.8) was an eQTL for that gene. Publically available microarray data (GSE3714741) was mined using GEO2R on the gene expression omnibus website (http://www.ncbi.nlm.nih.gov/geo/info/geo2r.html). Two sample groups were defined. Affymetrix Human ST1.0 array expression data for 87 bronchial brushings in the lungs of individuals with COPD was defined as the first group, whilst the second group had the expression profiles of 151 bronchial brushings from individuals without COPD. There were no significant differences in age, cumulative smoking exposure or smoking status between the individuals with COPD and those without COPD41. Differential expression between the 2 groups was identified using the default array statistics. P values were adjusted for multiple testing using the Benjamini & Hochberg method42. Results are presented in Supplementary Table 22. Analysis of differential expression of candidate genes in the developing foetal lung
Genes were defined as candidate genes for novel signals of association with extremes of FEV1 if they contained
a) the sentinel variant or were the nearest genes, b) a putatively functional variant within the gene, correlated with the sentinel variant, was identified through conditional analysis as explaining the observed association (see Supplementary Table 21) or c) the sentinel variant or a strong proxy variant (r2 > 0.8) was an eQTL for that gene. Publically available Affymetrix U133 Plus 2 array data (Gene expression omnibus: GSE14334) of 38 foetal lung samples from the Pseudoglandular (7 - 16 weeks) and Canalicular (17 - 22 weeks) stages of lung development was mined as previously reported43. Results are presented in Supplementary Table 7.
Messenger RNA sequencing in human bronchial epithelial cells (HBECs) to identify novel transcripts of genes at novel loci associated with the extremes of FEV1
We looked for evidence of novel transcripts for genes containing the sentinel SNPs associated with extremes of FEV1 and for genes which were regulated by nearby (<1Mb) SNPs (eQTLs) using RNA sequencing in HBECs.
23 files (100 base pairs; Sanger / Illumina 1.9 encoding) were quality evaluated using FastQC. Mean quality scores across the bases for all reads in all twelve samples were above 28. Un-modified reads were used for subsequent analysis on Ubuntu 12.04 LTS operating system. Un-spliced alignments onto human genome build GRCh37 were performed for each sample individually using Bowtie2 tool utilized by TopHat v2.0.1254. Reads aligning to more than 20 positions were discarded. The subset of reads that were not aligned uniquely were used by TopHat to identify splice junctions. Cufflinks v2.2.155,56 programme was used to assemble transcriptome for each individual sample. Transcriptomes from all the samples were merged using Cuffmerge v1.0.0 feature in order to identify low-expression transcripts requiring deep sequencing coverage. The Cuffmerge generated novel gene transfer format (GTF) annotation file was compared to Ensembl GTF annotation of GRCh37 genome build by using Cuffcompare v2.2.1. All 12 NHBEC samples were used for transcriptome assembly in order to identify reported and novel transcripts. Cuffdiff v2.2.1 generated isoform expressions file was used to determine mRNA variants abundance in untreated NHBEC under basal culture conditions by calculating isoforms’ percentage of total transcripts fragments per kilobase of exon per million fragments mapped (FPKM) expression. Splicing graphs depicting novel and known splice transcripts were generated using SpliceGrapher v0.2.457 (Supplementary Figure 6).
Pathway analysis using MAGENTA
We tested whether the results of the meta-analysis of low FEV1 vs high FEV1 across heavy smokers and never
smokers were enriched for known biological pathways using MAGENTA v244. Briefly, MAGENTA defines a P value for each gene that is the lowest variant P value within 110kb upstream and 40kb downstream of the gene and is corrected for gene size, number of variants per gene and LD within the region. For each gene set, the null hypothesis that there is a random distribution of gene association score ranks within the gene set is tested against the alternative hypothesis that there are more gene association score ranks above a given rank cut-off (75th percentile cut-off is recommended for polygenic traits) compared to random sampling of 10,000 gene sets of identical size. For each gene set, a FDR is calculated as the fraction of all randomly sampled gene sets (10,000 × number of gene sets tested) that have more genes with P value below the cut off (75th percentile) than in the gene set being tested, divided by the fraction of real gene sets that have more genes with P value below the cut off (75th percentile) than in the gene set being tested.
Six databases of biological pathways were tested: including Ingenuity Pathway (June 2008, number of pathways n=92), KEGG (2010, n=186), PANTHER Molecular Function (January 2010, n=276), PANTHER Biological Processes (January 2010, n=254), PANTHER Pathways (January 2010, n=141) and Gene Ontology (April 2010, n=9542). Significance thresholds were Bonferroni corrected for each database.
Variants with MAC less than 400 were excluded. Genes within 500kb of the genome-wide significant associations with FEV1reported in this paper, and within 500kb of the 32 variants previously reported as
associated with FEV1, FEV1/FVC and/or FVC2-4, 45 were flagged. Results are listed in Supplementary Table 17. Stepwise conditional analysis to identify additional independent signals at the novel loci
We used a stepwise selection procedure implemented in GCTA46 to identify independent signals within all the novel regions. This method starts by conditioning all the variants in a region by the most significant variant and then it uses a stepwise procedure to select other variants for which joint P values meet a pre-specified threshold (10-3 in this analysis).The software then returns P values for a joint model containing the stepwise-selected independent variants. The joint model P values returned by GCTA were checked by fitting the joint model in R with the glm function. Results are presented in Supplementary Table 6. Variants with a joint conditional P < 10-4 were defined as being independent.
Imputation and association testing of structural variation haplotypes in the inversion locus at chromosome 17q21.31 (KANSL1)