Emission line diagnostics for accretion and outflows in young
very low-mass stars and brown dwarfs
B.Stelzer1,a, J.M.Alcalá2, E.Whelan3, and A.Scholz4
1INAF - Osservatorio Astronomico di Palermo, Piazza del Parlamento 1, 90134 Palermo, Italy 2INAF - Osservatorio Astronomico di Capodimonte, Via Moiariello 16, 80131 Napoli, Italy
3Institut für Astronomie & Astrophysik, Eberhard-Karls-Universität Tübingen, 72076 Tübingen, Germany 4School of Physics & Astronomy, University of St. Andrews, The North Haugh, St. Andrews, Fife KY16 9SS, United Kingdom
Abstract. We discuss accretion and outflow properties of three very low-mass young stellar objects based on broad-band mid-resolution X-Shooter/VLT spectra. Our targets (FU Tau A, 2M 1207-39, and Par-Lup3-4) have spectral types between M5 and M8, ages between 1 Myr and∼10 Myr, and are known to be accreting from previous studies. The final objective of our project is the determination of mass outflow to accretion rate for objects near or within the substellar regime as a probe for the T Tauri phase of brown dwarfs and the investigation of variability in the accretion and outflow processes.
1 Introduction
According to the paradigm of accretion in low-mass young stellar objects (YSOs) the inner-disk ma-terial is channeled along magnetic field lines onto the star [1] where it dissipates its kinetic energy in standing shocks [2]. Jets and molecular outflows are believed to be intimately related to the accretion process, carrying away the angular momentum. The ratio between mass outflow and mass accretion rate ( ˙Mout/M˙acc) is, therefore, a key parameter of jet launching models [3, 4]. For T Tauri stars values
in a range of≈0.01−0.1 have been measured [5, 6]. Only few estimates have been obtained for the faint end of the stellar sequence where preliminary results suggest the ˙Mout/M˙accratio to be
signifi-cantly higher (e.g. [7]). The sensitive latest generation spectrographs enable to extend studies of the accretion/outflow connection into the brown dwarf regime.
We present results of broad-band mid-resolution (350−2500 nm, R ∼ 9000) X-Shooter/VLT spectroscopy for three YSOs. The data were obtained in the framework of the Italian GTOSurvey of nearby galactic star forming regions[8]. X-Shooter spectroscopy allows for a detailed characteriza-tion of YSOs, including an accurate assessment of their fundamental parameters, kinematics, rotacharacteriza-tion, and magnetic activity. It provides a rich database of accretion diagnostics from the Brγand Paβlines in the near-IR to the Balmer jump in the UV including the full optical band with the Balmer series and Heλ5876 and the Ca IRT. Finally, outflows can be traced through forbidden line emission.
In this contribution we focus on three of the most interesting individual objects from our survey. The characteristics and a motivation for their selection as X-Shooter targets are given in Sect. 2. We
ae-mail: stelzer@astropa.inaf.it
DOI: 10.1051/
C
Owned by the authors, published by EDP Sciences, 2014 /201
epjconf 46408005
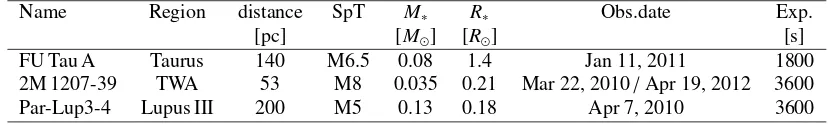
Table 1.Target properties and X-shooter observing log. Additional data for Par-Lup3-4 is described in Sect. 4.3.
Name Region distance SpT M∗ R∗ Obs.date Exp.
[pc] [M⊙] [R⊙] [s]
FU Tau A Taurus 140 M6.5 0.08 1.4 Jan 11, 2011 1800
2M 1207-39 TWA 53 M8 0.035 0.21 Mar 22, 2010/Apr 19, 2012 3600
Par-Lup3-4 Lupus III 200 M5 0.13 0.18 Apr 7, 2010 3600
describe the methods to derive mass accretion and outflow rates in Sect. 3. The results are presented in Sect. 4, conclusions and open questions are summarized in Sect. 5.
2 Targets
More than 80 YSOs were observed with X-Shooter in our survey of low-mass galactic star form-ing regions. Here we describe the results for three objects with particularly interestform-ing or puzzlform-ing properties in the previous literature. The target list is presented in Table 1.
FU Tau Ais the primary in a wide brown dwarf binary system with 5.7′′separation corresponding
to≈ 800 AU at the distance of Taurus [9]. Various signatures of youth include the presence of a circumstellar disk for both components inferred from near-IR excess emission and ongoing accretion inferred from Hαemission. The binary is located in the Barnard 215 dark cloud with no other young star nearby. Its isolation makes FU Tau a benchmark object for brown dwarf formation scenarios. FU Tau A appears well above the youngest isochrone of evolutionary pre-main sequence models in the HR diagram. FU Tau B, also appears younger than 1 Myr but by a smaller amount [10]. One objective for observing FU Tau A with X-Shooter was a better characterization of its accretion given the evidence for X-ray emission produced by an accretion shock from aChandraobservation [11].
2M1207-39is the most well-studied among the brown dwarfs in the nearby≈10 Myr old TW Hya
association. It has a disk from which it is accreting [12], an outflow [13] and a planetary companion [14]. An almost two orders of magnitude variation of the accretion rate has been inferred in the past based on the Hαemission from different epochs [15]. This strong variability and the perception of 2M 1207-39 as a kind of prototype accreting brown dwarf have led us to include it in our X-Shooter survey.
Par-Lup3-4is a very low-mass star in the Lupus III cloud discovered by [16]. It is underluminous
by≈ 4 mag with respect to other young M5 stars in the same star forming complex. This can be explained by an edge-on disk. In fact, a disk inclination angle of∼ 81◦ was inferred from SED
modelling [17]. The jet of Par-Lup3-4 was imaged in optical forbidden lines [18]. Our multi-epoch X-Shooter spectroscopy aims at studying the accretion and outflow variability and the relation of the mass accretion and mass outflow rates. The high inclination of the disk is believed to be favorable for the detection of variations related to non-azimuthal structures in the accretion geometry.
3 Measurement of mass accretion and outflow rates
We use three methods to measure mass accretion rates, ˙Macc, from the X-Shooter spectra. First,
we use the empirical relation with the full width of the Hα line at 10 % of the peak height, log ˙Macc[M⊙/yr]=(−12.89±0.3)+(9.7±0.7)·10−3·W10%[km/s]; see [19]. Secondly, we apply
empirical correlations between the luminosity of individual emission lines (Lline) and the accretion
luminosity of the typeLacc = a+b·Lline wherea,b are coefficients that have been presented e.g.
Figure 1.Mass accretion rate for FU Tau A derived from various emission line fluxes and luminosities using new calibrations from [21], and from the Hα10 % width. Dashed and dotted lines are mean and standard deviation for the luminosity-based ˙Maccexcluding lines with suspected wind contribution, blending or uncertain calibration.
on the basis of the X-Shooter spectra of low-mass stars in Lupus obtained within our GTO program [21]. Finally, we measure the excess emission with respect to a purely photospheric spectrum. This is done by adding to the spectrum of a non-accreting template star, that has the same spectral type as the target, the emission of an isothermal slab model for a hot hydrogen gas. The model parameters (temperature, density and length of the slab) are adapted until the template plus model give the best fit to the target spectrum. This provides the accretion luminosity,Lacc, which can be transformed into
mass accretion rate according to ˙Macc=(1−1/Rin)−1·LGMaccR∗
∗ whereR∗andM∗are the stellar radius and
mass,Gthe gravitational constant, andRinthe inner disk radius, assumed here to be 5R∗(see [22]).
Outflow rates are measured from line luminosities using the prescription given by [5]. In particu-lar, we use the relation log ˙Mout =X·(1+nnc
e)( VT 150 km/s)(
lT 2·1015cm)
−1
(Lline
L⊙ ). Here,ncis the ion-specific
critical density andnethe electron density. The projected aperture size on the plane of the sky (lT) is determined by the slit width and the distance to the target. The tangential velocity (VT) can be obtained from the measured radial velocity if the inclination angle of the outflow is known. X is a numerical constant calculated by [5] for the most prominent forbidden lines.
4 Results
4.1 FU Tau A
In Fig. 1 we show the values for ˙Maccthat we obtain from the individual emission line luminosities
using the calibrations of [21] and from the Hα10 % width applying the relation from [19]. While the various line luminosities yield consistent values within the uncertainties, the width of Hαresults in a lower estimate for ˙Macc. From the slab model we obtain a third value for ˙Macc. That latter
estimate is log ˙Macc[M⊙/yr]=−10.1 and it agrees well with the result from the line luminosities. The
discrepancy of the value obtained from the Hαwidth supports previous notions of the poor reliability of this tracer as quantitative measure for accretion (e.g. [20, 21, 23]).
We have found for the first time outflow activity in FU Tau A, detected in the form of forbidden emission lines, and we use the [OI]λ630.0 nm and [SII]λ673.1 nm emission to derive the mass loss rate, ˙Mout. The values of ˙Mout (≈ 4·10−11M⊙/yr), and consequently ˙Mout/M˙acc ≈ 0.3, are not
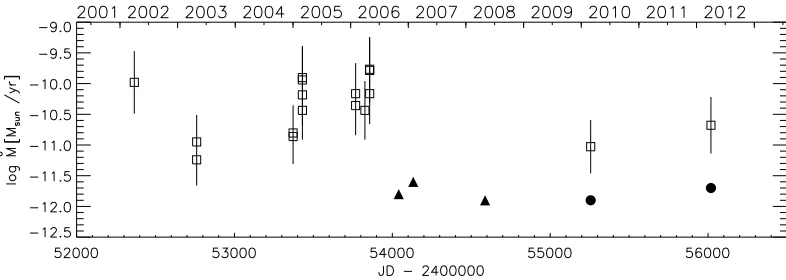
Figure 2.Mass accretion rate of 2M 1207-39 measured throughout the last decade with different methods: line luminosity (filled circles), modelling of UV excess (filled triangles) and Hα10 % width (open squares). For the latter one the plotting symbols denote the highest and the lowest values measured in the respective month and the vertical bars include the uncertainties of the conversion to mass accretion rate. The two most recent epochs shown in this graph are from our X-Shooter observations.
to calculate the tangential velocity. Specifically, as a result of the non-detection of [S II]λ617.7 nm emission only a lower limit can be determined forne. Furthermore, the disk inclination angle required
to calculateVT is also a lower limit,idisk ≥ 50◦ from a comparison of the measuredvsini and the
rotation period observed photometrically by [24]; see also [25] for details. The outflow of FU Tau A has recently also been detected at millimeter wavelengths [26], and this estimate of the molecular outflow rate is an order of magnitude higher than that obtained from the atomic transitions.
4.2 2M 1207-39
2M 1207-39 is one of the best-studied young accreting brown dwarfs. We have collected accretion measurements from the literature. The resulting time-series for ˙Macc is shown in Fig. 2. Different
plotting symbols refer to different techniques for calculating the accretion rate (see figure caption). Our X-Shooter observations are represented by the two most recent epochs. It can be noticed that all values derived from the Hαwidth yield systematically higher ˙Macc than other methods (UV excess
modelling and line luminosity). Our simultaneous measurement of Hαwidth and line luminosities (the two most recent epochs in Fig. 2) prove that there are discrepancies associated with the different analysis methods which, if ignored, could be mistaken for true accretion variations. As noted above for the case of FU Tau A UV excess and line luminosity are considered more reliable quantitative accretion diagnostics. All data points obtained so far for 2M 1207-39 from these two tracers suggest at most modest variability of the accretion rate on time-scales of years.
4.3 Par-Lup3-4
normalized to black spectrum
388 390 392 394 396 398 400
λ[nm]
2•10−16 4•10−16 6•10−16 8•10−16 1•10−15
flux [erg/cm
2/s/nm]
2010−04−07T04:07
[image:5.482.58.448.91.266.2]2012−06−08T04:03 2013−05−11T07:04
Figure 3. Results from X-Shooter spectroscopy of Par-Lup3-4: (Left) - Mass accretion rates calculated from line luminosities with the calibrations of [21] (black symbols) and same measurements corrected for the grey extinction induced by the edge-on disk (red symbols); see [27] for details. (Right) - Three different epochs showing apparently uncorrelated changes in the emission line fluxes. Shown are the spectrum obtained in the GTO program (yellow) and two spectra from our follow-up programs carried out in June 2012 and May 2013.
can be corrected according to ( ˙Macc)corr=OF1.5·M˙acc. This is based on the relation between accretion
rate and luminosity given in Sect. 3 and considers theR2
∗proportionality of the bolometric luminosity;
see [27] for more details. The corrected values for ˙Maccare shown in red in Fig. 3. No obscuration
correction is applied to the [OI]λ630 nm emission because forbidden lines are generated in outflows not in accretion streams. The good agreement between the ˙Maccderived from [OI]λ630 nm with the
extinction corrected values obtained for the other lines confirms (1) that the outflow is not obscured by the disk and (2) that there is a tight connection between outflow and accretion activity.
In June 2012 and May 2013 we obtained in total nine additional X-Shooter spectra of Par-Lup3-4 with the aim of studying its emission line variability. Thus, the available spectra for this object cover timescales from few hours to three years. Our preliminary analysis shows evidence for changes in the flux distribution from years 2010 to 2013, e.g. the June 2012 spectrum displays the strongest Balmer H8 line but the weakest Ca II H&K lines in Fig. 3. The changes in emission line flux are accompanied by variations in the spectral slope (not shown). A detailed investigation of all available spectra will shed light on variations on different timescales.
5 Conclusions and open questions
For all our observations, but particularly demonstrated for 2M 1207-39, the Hα10 % width yields mass accretion rates that are inconsistent with results from other methods, possibly due to the influ-ence of outflows on the line profiles. The case of Par-Lup-3-4 shows the importance of an accurate assessment of extinction for measuring ˙Maccand, consequently, the mass inflow-to-outflow ratio. For
forbid-den lines. Future sensitive observations of larger samples of very low-mass objects will also have to address the discrepancies between outflow rates determined from atomic and molecular transitions.
References
[1] A. Koenigl, ApJL370, L39 (1991)
[2] N. Calvet, E. Gullbring, ApJ509, 802 (1998)
[3] R.E. Pudritz, R. Banerjee, The disc-jet connection, in Massive Star Birth: A Crossroads of Astrophysics, edited by R. Cesaroni, M. Felli, E. Churchwell, M. Walmsley (2005), Vol. 227 of IAU Symposium, pp. 163–173,arXiv:astro-ph/0507268
[4] J. Ferreira, C. Dougados, S. Cabrit, A&A453, 785 (2006),arXiv:astro-ph/0604053 [5] P. Hartigan, S. Edwards, L. Ghandour, ApJ452, 736 (1995)
[6] S.Y. Melnikov, J. Eislöffel, F. Bacciotti, J. Woitas, T.P. Ray, A&A506, 763 (2009),0910.0379 [7] E.T. Whelan, T.P. Ray, L. Podio, F. Bacciotti, S. Randich, ApJ706, 1054 (2009),0910.2665 [8] J.M. Alcalá, B. Stelzer, E. Covino, G. Cupani, A. Natta, S. Randich, E. Rigliaco, L. Spezzi,
L. Testi, F. Bacciotti et al., Astronomische Nachrichten332, 242 (2011)
[9] K.L. Luhman, E.E. Mamajek, P.R. Allen, A.A. Muench, D.P. Finkbeiner, ApJ691, 1265 (2009a), 0902.0425
[10] K.L. Luhman, E.E. Mamajek, P.R. Allen, A.A. Muench, D.P. Finkbeiner, ApJ720, 1781 (2010) [11] B. Stelzer, A. Scholz, C. Argiroffi, G. Micela, MNRAS408, 1095 (2010),1006.2717
[12] A. Scholz, R. Jayawardhana, A. Brandeker, ApJL629, L41 (2005),astro-ph/0507122 [13] E.T. Whelan, T.P. Ray, F. Comeron, F. Bacciotti, P.J. Kavanagh, ApJ 761, 120 (2012),
1210.7106
[14] G. Chauvin, A.M. Lagrange, C. Dumas, B. Zuckerman, D. Mouillet, I. Song, J.L. Beuzit, P. Lowrance, A&A425, L29 (2004),astro-ph/0409323
[15] B. Stelzer, A. Scholz, R. Jayawardhana, ApJ671, 842 (2007),arXiv:0707.1754 [16] F. Comerón, M. Fernández, I. Baraffe, R. Neuhäuser, A.A. Kaas, A&A406, 1001 (2003) [17] N. Huélamo, H. Bouy, C. Pinte, F. Ménard, G. Duchêne, F. Comerón, M. Fernández, D. Barrado,
A. Bayo, I. de Gregorio-Monsalvo et al., A&A523, A42 (2010),1008.5065 [18] M. Fernández, F. Comerón, A&A440, 1119 (2005),astro-ph/0506307
[19] A. Natta, L. Testi, J. Muzerolle, S. Randich, F. Comerón, P. Persi, A&A424, 603 (2004), arXiv:astro-ph/0406106
[20] G.J. Herczeg, L.A. Hillenbrand, ApJ681, 594 (2008),0801.3525
[21] J.M. Alcalá, A. Natta, C.F. Manara, L. Spezzi, B. Stelzer, A. Frasca, K. Biazzo, E. Covino, S. Randich, E. Rigliaco et al., A&A submitted (2013)
[22] E. Gullbring, L. Hartmann, C. Briceno, N. Calvet, ApJ492, 323 (1998)
[23] G. Costigan, A. Scholz, B. Stelzer, T. Ray, J.S. Vink, S. Mohanty, MNRAS427, 1344 (2012), 1209.0462
[24] A. Scholz, B. Stelzer, G. Costigan, D. Barrado, J. Eislöffel, J. Lillo-Box, P. Riviere-Marichalar, H. Stoev, MNRAS419, 1271 (2012),1109.3474
[25] B. Stelzer, J.M. Alcalá, A. Scholz, A. Natta, S. Randich, E. Covino, A&A551, A106 (2013), 1301.0410
[26] J.L. Monin, E.T. Whelan, B. Lefloch, C. Dougados, C. Alves de Oliveira, A&A551, L1 (2013), 1301.4387
![Figure 1. Mass accretion rate for FU Tau A derived from various emission line fluxes and luminosities using newcalibrations from [21], and from the Hthe luminosity-based α 10 % width](https://thumb-us.123doks.com/thumbv2/123dok_us/8699094.381133/3.482.54.431.85.218/figure-accretion-derived-various-emission-luminosities-newcalibrations-luminosity.webp)
![Figure 3. Results from X-Shooter spectroscopy of Par-Lup3-4: (Left) - Mass accretion rates calculated fromline luminosities with the calibrations of [21] (black symbols) and same measurements corrected for the greyextinction induced by the edge-on disk (re](https://thumb-us.123doks.com/thumbv2/123dok_us/8699094.381133/5.482.58.448.91.266/spectroscopy-accretion-calculated-luminosities-calibrations-measurements-corrected-greyextinction.webp)
