Development of an optimised subharmonic
dynamic contrast-enhanced ultrasound imaging
technique for liver cancer
Submitted in accordance with the requirements for the degree of
Doctor of Philosophy
Discipline of Clinical Medicine, School of Medicine,
Trinity College Dublin
2018
i
Declaration
I declare that this thesis has not been submitted as an exercise for a degree at this or any other university and it is entirely my own work.
I agree to deposit this thesis in the University’s open access institutional repository or allow the library to do so on my behalf, subject to Irish Copyright Legislation and Trinity College Library conditions of use and acknowledgement.
________________________
ii
Summary
For many years the clinical use of contrast enhanced ultrasound (CEUS) with ultrasound contrast agents (UCA) has been implemented using harmonic imaging, in which the first harmonic of the transmit frequency is received to form the resultant images. Currently, the clinical practice of CEUS is predominantly used for qualitative imaging, although in recent years quantitative perfusion ultrasound imaging with UCAs has demonstrated potential for diagnosing tumour malignancy and determining angiogenesis; however, poor reproducibility, low signal and poor contrast performance often lead to poor quantification accuracy. Recent advances in ultrasound technology have demonstrated potential to improve signal quality (and hence image quality) and allow for more robust modelling of contrast agent uptake curves. However, optimal strategies for implementing these concepts have not been fully investigated or exploited. One such concept is ‘subharmonic imaging’, which has been suggested as a method for enhanced tissue suppression. Subharmonic imaging involves receiving at half the fundamental transmit frequency.
iii frequency of the UCA, measured from attenuation curves at 2.1 MHz for the ‘Native’ UCA and 2.4 MHz for the ‘Altered’ UCA. Furthermore, combining these results with the resonance frequencies predicted from the size and volume-weighted distributions indicated that the volume distribution was a better indicator of bubble response.
The optimised subharmonic generation technique was then transferred to a clinical ultrasound system (Aixplorer®, V11.2, Supersonic Imagine, France) and tested on two newly-developed phantoms which mimicked both healthy and diseased liver tissue: (i) a foam perfusion phantom, which was designed to produce different tissue representative time-intensity curves at different depths, with ‘healthy’, ‘diseased’ and ‘necrotic’ mimicking regions, and (ii) a hepatic artery attenuating flow phantom, which mimicked clinically relevant attenuation for ‘healthy’, ‘fatty’ and ‘fibrotic’ liver tissue. The perfusion phantom was used to compare the use of the newly developed optimised subharmonic imaging technique with the clinically practiced CEUS harmonic pre-set. CEUS harmonic imaging was carried out with the ‘Native’ UCA, to mimic current clinical applications, and the subharmonic technique was carried out using both the ‘Native’ and ‘Altered’ UCA. The optimised subharmonic imaging technique was shown to result in improved measurement of perfusion dynamics, particularly at depth, with less shadowing, due to lower attenuation of the lower subharmonic frequencies and no tissue signal contamination due to ‘tissue harmonic signals’. The ‘Altered’ UCA resulted in improved estimation of the time intensity curves, with less error and variation associated with the measurements and, furthermore, imaging with this UCA better indicated changes in UCA concentration. Therefore, the use of UCA altered in an application specific manner may lead to improved quantification accuracy.
iv
Acknowledgements
I would like to extend my sincere thanks and gratitude to the following people:
Firstly to my supervisors, Prof Andrew Fagan and Prof Jacinta Browne, for their valuable advice and guidance during my studies. Thank you for your support and words of encouragement throughout the past three and half years and for sharing your vast knowledge and expertise with me.
Thank you to the Irish Research Council for awarding me the Government of Ireland Postgraduate Scholarship to allow me to carry out this research.
Thank you to Dr Carmel Moran (University of Edinburgh) for sharing her knowledge and expertise in acoustic characterisation techniques.
The Irish Association of Physicist in Medicine (IAPM; Dublin, Ireland), for their support of the project in the form of a “Young Investigator Grant”, awarded to help with the purchase of equipment for the bubble acoustic characterisation system.
Thank you to Bracco Suisse SA (Italy) and Supersonic Imagine (France) for their experimental support throughout this work.
The staff at the National Centre for Advanced Medical Imaging (CAMI), St James’s Hospital (Dublin Ireland) for allowing me access to the clinical ultrasound system. The technical staff and researchers in Focas Research Institute (Dublin Institute of Technology) for their kind help and assistance in the laboratory.
My colleagues, Dr Silvin Knight, Andrea Doyle, Andrew Malone and Conor Hayden in the Imaging Physics Group, Trinity College, University of Dublin (Dublin, Ireland) and the Medical Ultrasound Group, Dublin Institute of Technology (DIT, Dublin, Ireland), thank you for your help and feedback throughout my project but more importantly for the day-to-day encouragement and moral support.
1
Contents
Chapter 1 Introduction ... 17
1.1 Context and Motivation... 17
1.2 Aim and Objectives ... 18
1.3 Thesis Overview ... 19
Chapter 2 Background ... 23
2.1 Microcirculation and Angiogenesis ... 23
2.2 Liver Cancer and Contrast Enhanced Ultrasound (CEUS) ... 24
2.3 Microbubble Ultrasound Contrast Agents ... 26
2.4 Nonlinearity and Harmonics ... 29
2.5 Dynamic Contrast Enhanced Ultrasound ... 33
2.6 Subharmonic Generation ... 35
2.7 Subharmonic Imaging in vivo ... 41
2.8 Microbubble Encapsulation Models ... 45
2.9 Ultrafast Imaging ... 48
2.10 Summary ... 50
Chapter 3. Development of a system for acoustic characterisation of ultrasound contrast agents (UCAs) ... 51
3.1 Introduction ... 51
3.1.1 UCA characterisation systems ... 51
3.1.2 Ultrasound transducer operation and characteristics ... 52
3.1.3 Single Element transducers ... 55
3.2 Methods ... 56
3.2.1 Development of acoustic characterisation systems ... 56
3.2.2 Characterisation of single element transducers ... 62
3.3 Results ... 67
3.3.1 Comparison of narrowband characterisation systems output ... 67
3.3.2 Characterisation of Single Element Transducers ... 68
3.4 Discussion ... 75
3.5 Conclusions ... 77
Chapter 4 Subharmonic Characterisation of Ultrasound Contrast Agents ... 78
4.1 Introduction ... 78
4.2 Methods ... 80
4.2.1 ‘Native’ UCA ... 80
2
4.3 Results ... 91
4.3.1 ‘Native’ UCA ... 91
4.3.2 ‘Altered’ UCA ... 101
4.4 Discussion ... 106
4.5 Conclusions ... 111
Chapter 5 Transfer of the optimised subharmonic imaging technique to a clinical ultrasound system ... 112
5.1 Introduction to the clinical ultrasound scanner ... 112
5.2 Methods ... 115
5.2.1 Characterisation of Aixplorer® XC6-1 transducer ... 115
5.2.2 RF Data Analysis Software ... 117
5.2.3 Transfer of bench-level optimised SHI techniques to clinical ultrasound system ... 120
5.3 Results ... 121
5.3.1 Characterisation of Aixplorer® XC6-1 transducer ... 121
5.3.2 Transfer of bench-level optimised SHI techniques to clinical scanner ... 124
5.4 Discussion ... 127
5.5 Conclusions ... 131
Chapter 6. Investigation of SHI DCEUS with a clinical ultrasound system using a novel liver mimicking phantoms ... 133
6.1 Introduction ... 133
6.2 Methods ... 143
6.2.1. Flow chart of the phantom development ... 143
6.2.2 Perfusion Phantom vascular mimic designs ... 144
6.2.3 The Mark III perfusion phantom ... 148
6.2.4 Hepatic artery attenuating flow phantom ... 151
6.2.5. Phantom TMM constituents ... 152
6.2.6 Acoustic characterisation of liver mimicking TMMs ... 154
6.2.7 TIC flow measurements ... 155
6.2.8 TIC code ... 156
6.3 Results ... 157
6.3.1 Perfusion phantom results ... 157
6.3.2 Hepatic Artery Attenuating Flow Phantom ... 167
6.4 Discussion ... 169
6.5 Conclusions ... 172
Chapter 7 Conclusions ... 174
3 7.2 Implications of the research and suggestions for future work ... 176
Appendix 1: Derivation of the Rayleigh-Plesset Equation ... 180
4
Table of Figures
Figure 2. 1: The structure of a microbubble UCA (1 – 10 μm), composed of a perfluorocarbon gas
encapsulated in phospholipid shell (10 – 100 nm). ... 28 Figure 2. 2 Schematic of the nonlinear oscillation of a microbubble insonated with a high acoustic power
adapted from (King et al., 2008). ... 30
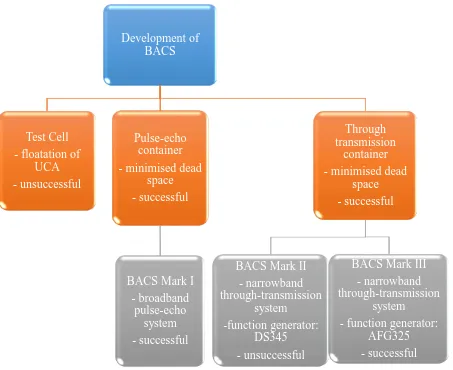
Figure 3. 1: A flow chart of the approach taken to develop a bubble acoustic characterisation system (BACS). ... 52 Figure 3. 2: An example of a transmit spectrum at a transmit centre frequency of 3.4 MHz, measured using a hydrophone, with the full-width at half maximum and the full-width at tenth maximum indicated. .. 54 Figure 3. 3: Example of a test cell constructed for the initial UCA characterisation experiments. The test cells
are constructed from a Perspex ring with two injection ports fixed at the edge for venting and plastic film acoustic windows glued to both sides. ... 56 Figure 3. 4: First attempt at a transmission set-up used to measure the attenuation and backscatter. The
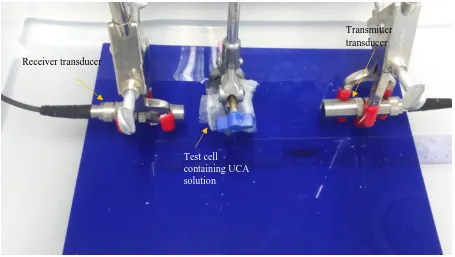
set-up includes a transducer receiving the signal from transmit transducer which has passed through a water path and the microbubble solution in a test cell positioned at the focus of both the transducers. ... 57 Figure 3. 5: A photograph of the through transmission set-up which minimised the volume of UCA required
to perform the experiments. ... 58 Figure 3. 6: A photograph of the reflection-based set-up, used as part of BACS Mark I, which included; a
diecast box, an acoustic matt to prevent stray reflections and glass reflector. The transducer cable was embedded in the box side and the transducer was fixed in position. ... 58 Figure 3. 7: A photograph of BACS Mark I, which included; a pulser receiver device in transmit/receive mode
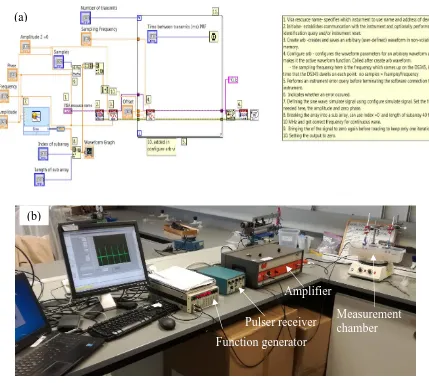
which allowed the transducer to work as a transceiver. A glass block reflected the transmitted signal which had travelled through the solution of interest and the reflected signal was then received by the same equipment and digitised by the acquisition system. ... 59 Figure 3. 8: BACS Mark II: (a) The developed transmit LabVIEW block diagram, and (b) a photograph of the
hardware system set-up for performing the attenuation measurements. The system was a through-transmission system. ... 61 Figure 3. 9: BACS Mark III in which the function generator from BACS Mark II (DS345) was replaced with a
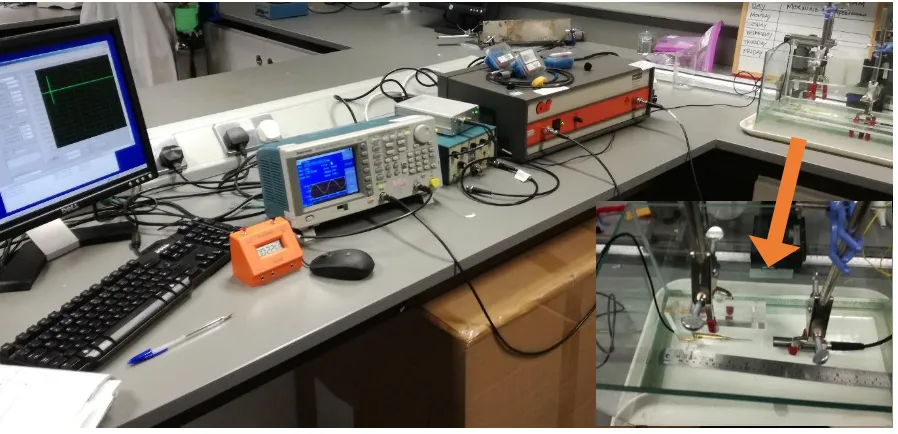
higher specification generator (AFG325) which did not require external control. ... 62 Figure 3. 10: A photograph of BACS Mark III altered for single element transducer characterisation. The
receive side of the system has been changed to include a hydrophone system. The inlay shows a photograph of the needle hydrophone positioned at the focus of a single element transducer for measurement of the transducer’s transmit characteristics. ... 64 Figure 3. 11: The sensitivity profile of the hydrophone from the calibration certificate measured at integer
values between 1 and 20 MHz. ... 66 Figure 3. 12: The measured pressure waveform for a typical ‘pulse’ of ultrasound energy from a single
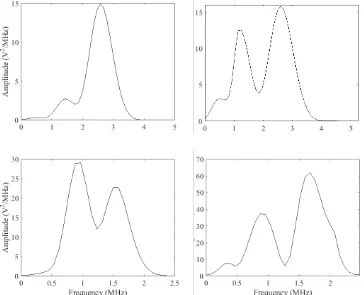
element transducer. The peak positive pressure and peak negative pressure are indicated by the arrows. ... 67 Figure 3. 13: The frequency spectra output from the narrowband BACS, measured using a hydrophone,
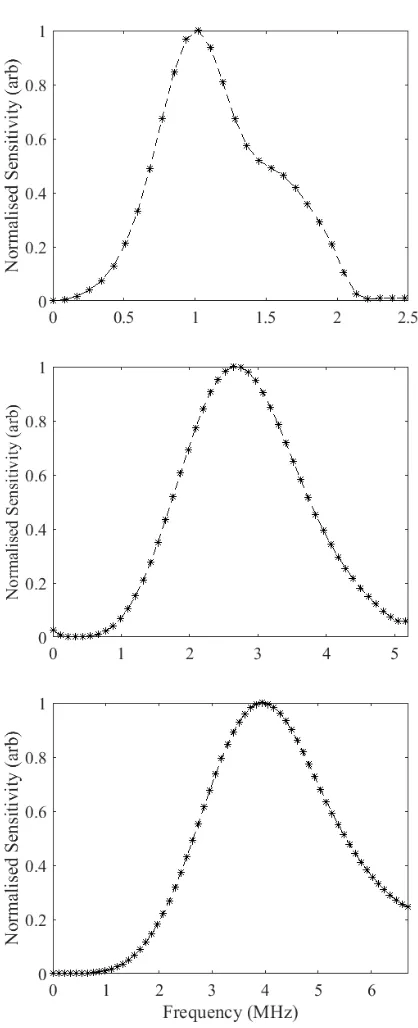
transformed to the frequency domain using the Welch transform. The spectrum from BACS Mark II (left) exhibited large amplitude low frequency noise, however, the spectrum from BACS Mark III (right) displayed no low frequency noise component. The amplitude of the spectrum from BACS Mark III was higher than BACS Mark I as the transducer was responding to a more stable and clean signal. 68 Figure 3. 14 The normalised intra-transducer receive sensitivity profiles of the single element transducers
used for receiving the UCA signals in the narrowband characterisation set-up measured using the hydrophone method. Profiles for the 1 MHz (top), 2.25 MHz (middle) and 3.5 MHz (bottom)
transducers are shown. ... 72 Figure 3. 15 : Two examples of frequency spectra including subharmonic signals which have been corrected
5
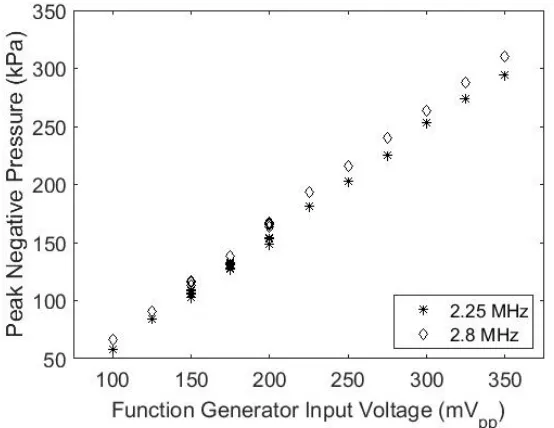
transmit centre frequency 1.9 MHz, transmitted by the 2.25 MHz transducer and received by the 1 MHz transducer. ... 73 Figure 3. 16: The PNP as a function of increasing input voltage for the 2.25 and 2.8 MHz transmit
frequencies using the 2.25 MHz V306 transducer. ... 74
Figure 4. 1: The calculated resonance frequency for bubbles of diameter 1 – 10 µm. ... 87 Figure 4. 2: The graphical user interface of the ‘Bubblesim’ toolbox developed by Hoff et al (Hoff, 2001).The
transmit centre frequency and bubble radius were varied and are indicated by the red circles in the figure. ... 90 Figure 4. 3: (Top row) The size distribution for the ‘Native’ UCA of research (left) and clinical (right)
SonoVue® based on number of microbubbles. (Bottom row) The size distribution of the ‘Native’ UCA of research (left) and clinical (right) SonoVue® based on gas volume. ... 92 Figure 4. 4 (a, b): Attenuation of the ‘Native’ UCA measured as a function of concentration using a
broadband (a) and a narrowband (b) characterisation system. Both systems show a linear increase in attenuation with concentration. The narrowband system shows less variability in the measurements (error bars) and resulted in attenuation values consistent with those published in literature. ... 93 Figure 4. 5: Narrowband characterisation of the ‘Native’ UCA attenuation with frequency across the range
1.8 – 3.7 MHz at a concentration of 6.5 x 10⁵ mb.ml-1. ... 94
Figure 4. 6: Subharmonic signal amplitude as a function of peak negative pressure at SHFWTM. The data represents a mean of 3 solutions, insonated approximately 30 times at each pressure level. ... 95 Figure 4. 7: Subharmonic to fundamental ratio as a function of peak negative pressure, with the bandwidths
defined by the FWTM. The data represents a mean of 3 solutions, insonated approximately 30 times at each pressure level... 95 Figure 4. 8: The subharmonic amplitude at SHFWHM (SHAmp FWHM - top row) and SHFWTM (SHAmp FWTM - bottom
row) for pulse train lengths of 2 – 8 cycles and transmit centre frequencies of (a) 2.25 MHz, (b) 2.8 MHz, (c) 3.4 MHz (d) 3.75 MHz (e) 4.5 MHz (f) 5 MHz. The data represents a mean of 3 solutions, insonated approximately 30 times at each transmit pulse length. Note the difference in the amplitude of the y-axis for each graph. The highest value is indicated in each graph with a red circle and was found to consistently be measured at a pulse length of 3 cycles. The overall maximum was measured at transmit centre frequency 2.25 MHz and a pulse length of 3 cycles in both bandwidths. ... 97 Figure 4. 9: Subharmonic to fundamental ratio at full-width at half maximum (SHFFWHM - top row) and
full-width at tenth maximum (SHFFWTM - bottom row) at centre frequencies (a) 3.4 MHz (b) 3.75 MHz, (c)
4.5 MHz, (d) 5 MHz. The data represents a mean of 3 solutions, insonated approximately 30 times at each transmit pulse length. The highest value is indicated in each graph with a red circle and was found to consistently be measured at a pulse length of 3 cycles. The overall maximum was measured at transmit centre frequency 2.25 MHz and a pulse length of 3 cycles in both bandwidths. ... 98 Figure 4. 10: Subharmonic signal amplitude at SHFWHM (SHAmp FWHM - top row) and SHFWTM (SHAmp FWTM -bottom
row), pulse length 3 cycles(left), 8 cycles (right) for the ‘Native’ UCA at concentration 6.5 x 10⁵ mb.ml-1
and applied pressure 150 kPa. The data represents a mean of 3 solutions, insonated approximately 30 times at each transmit centre frequency. The data has been corrected for intra-transducer sensitivity. ... 99 Figure 4. 11: Subharmonic signal amplitude at SHFWHM (SHAmp FWHM - top row) and SHFWTM (SHAmp FWTM -
bottom row) for pulse length 3 cycles (left), 8 cycles (right) for the ‘Native’ UCA at concentration 6.5 x 10⁵ mb.ml-1 and applied pressure 150 kPa. The data represents a mean of 3 solutions, insonated
approximately 30 times at each transmit centre frequency. The data has been corrected for intra-transducer and inter-intra-transducer sensitivity. ... 100 Figure 4. 12: The measured size (left) and volume (right) distributions of ‘Native’ (dot-dashed) and ‘Altered’
(dashed) UCA, the dotted line indicating the ideal cut-off point of the ‘Altered’ UCA (1 – 4 µm)
according to calculations made using the Stokes equation. ... 102 Figure 4. 13: The attenuation of the ‘Altered’ UCA across the frequency range 1.9 – 3.9 MHz at a
concentration of 1.2 x 10⁵ mb.ml-1. The data represents a mean of 3 solutions, insonated
approximately 30 times at each transmit centre frequency. ... 102 Figure 4. 14 (a, b; c, d): Subharmonic signal amplitude at SHFWHM (SHAmp FWHM - top row) and SHFWTM (SHAmp
6
1.2 x 10⁵ mb.ml-1 and applied pressure 150 kPa. The data represents a mean of 3 solutions, insonated
approximately 30 times at each transmit centre frequency. The data has been corrected for intra-transducer and inter-intra-transducer sensitivity. ... 103 Figure 4. 15: Subharmonic amplitude at SHFWTM (SHAmp FWTM) for the ‘Native’ and ‘Altered’ UCA at the
transmit centre frequencies which gave the highest subharmonic signal, 1.9 – 2.5 MHz and 2.3 – 2.5 MHz, respectively. The insonated solution made up to a concentration of 6.5 x 10 5 mb.ml-1. The data
represents a mean of 3 solutions, insonated approximately 30 times at each transmit centre
frequency. ... 105 Figure 4. 16: The maximum subharmonic amplitude was recorded as a function of transmit centre
frequency for the mean measured UCA sizes from simulations with the ‘Bubblesim’ program. The simulation of the response of the mean sized bubble based on volume for both ‘Altered’ (2.80 μm) and ‘Native’ (4.00 μm) UCA, more closely matched the experimental data than that for the mean size based on microbubble count (1.80 and 1.85 μm, respectively). ... 106
Figure 5. 1: Raw data frames of firing number 1, 10, 20. 30 and 48, representative of the 48 frames overall which span the field of view. The frames are from a reference acquisition in the perfusion phantom developed in Chapter 6, where the perfusion core begins at a depth of ~ 600 RF samples, above this level there was deionised water in the beam path. The frames show the procession of the transmit and receive apertures with time for one Raw RF research acquisition. The receive aperture is marked with a blue bracket in each frame. Note the values of the 64 elements in total on either side of the receive aperture 128 elements are forced to zero in each frame. For example in frame 1, all 64 elements are to the right hand side of the frame, whereas in frame 3 corresponding to firing number 20, where the transmit aperture was centred around piezoelectric element number 78, 14 elements to left and 50 elements to the right of the receive aperture are forced to zero. ... 114 Figure 5. 2: The Aixplorer® XC6 – 1 transducer characterisation set-up. The inlay shows a needle
hydrophone inside the tank lined up with transducer outside pressing against the acoustic window and held in position by a retort stand. The tank was lined with acoustic mat during measurements and filled with deionised water. A trigger from the clinical scanner synchronised the acquistion system.116 Figure 5. 3: A schematic of the shielded box equipped with BNC connectors, which served to embed the
pullup function of the trigger out line. ... 116 Figure 5. 4: A block diagram representing the MATLAB program developed for the subharmonic analysis of
one acquisition of the Raw RF data extracted from the scanner. The Raw RF data 3D matrix was input, the Welch transform was performed on a composite image of the data and a 2D subharmonic image map was output. This method was performed on every acquisition in a sequence. ... 119 Figure 5. 5: The calculated mechanical index (MI) from the research mode pressure measurements at 2.25
MHz and the on-screen scanner-quoted MI for the ‘general’ liver pre-set as a function of acoustic output (dB). ... 124 Figure 5. 6: The relative subharmonic amplitude (top) and subharmonic-to-fundamental ratio (bottom) for
the raw (left) and scan-converted data (right) for the ‘Native’ and ‘Altered’ UCAs as a function of UCA concentration. ... 125
Figure 6. 1: A flow chart illustrating the development of the phantoms used in this work to test the newly-developed technique. ... 144 Figure 6. 2: A photograph of the Mark I perfusion phantom foam cores which were either fully saturated in
the TMM (left), semi-saturated (centre) or injected to produce localised dense regions to mimic harmonic signals (right). ... 146 Figure 6. 3: A photograph of a perfusion core of the Mark I perfusion phantom prepared in the phantom
container. The foam was encased in silicone to contain the fluid and keep the UCA solution perfusing through, as opposed to leaking out of, the foam, and had an inlet and outlet tubing attached to both ends of the foam structure. ... 146 Figure 6. 4: A photograph of the Mark IIa perfusion phantom foam cores with various amounts of PVAc
7
Figure 6. 5: A photograph of the combination of foam network structure used as the perfusion phantom core in the Mark IIb perfusion phantom. The network consisted of an injected foam (top), a semi-soaked foam (centre) and a fully semi-soaked foam (bottom), the three foams making up the network were encased in silicone. ... 148 Figure 6. 6: Photographs of the construction of the foam core of the Mark III perfusion phantom. The
phantom consisted of tissue representative layers (left) with various amounts of PVAc dispersed throughout to provide a harmonic ‘tissue’ component, which were arranged to produce tissue representative TICs at different depths (right), giving areas of high and low flow to mimic the
heterogeneous nature of tumour vasculature. ... 149 Figure 6. 7: A photograph of the final perfusion phantom, the Mark III, with acoustic window and 1 output
(left) and 2 supported inputs underneath the container (right). ... 150 Figure 6. 8: A schematic of the Mark III perfusion phantom set-up and flow and perfusion dynamics. Flow
entered from the base of the phantom and flowed up to the top of the phantom to avoid floatation of UCA. The pump was positioned before the injection site to avoid bursting UCA microbubbles in the pump head. The injection site was in a beaker of deionised water (Deionised H20) to maintain a
pressure balance in the system and avoid the introduction of any air pockets into the system. ... 150 Figure 6. 9: Photographs of the construction of hepatic artery attenuating flow phantom mimicking the
acoustic characteristics of various stages of liver disease. PVAc TMM was strung onto the vessel, then glued into place in phantom container, making three sections of phantom (left). The finished phantom was filled with agar TMM background (right). ... 151 Figure 6. 10: A schematic of the flow and imaging set-up of the hepatic artery attenuating flow phantom
mimicking the acoustic characteristics of diseased liver. The pump pulled UCA through the system to avoid bursting of UCA microbubbles in the pump-head. The phantom was imaged from above at various positions above the PVAc TMM and UCA travelled through a vessel passing through the centre of various TMM mimicking the different stages of liver disease. The vessel was positioned at a depth of 6 cm. ... 152 Figure 6. 11: The acoustic macroscope, the 2.25 MHz transducer was used in the pulse-echo mode to detect
reflections from a glass slide which had passed through the sample when making sample
measurements and through deionised water for reference measurements. ... 154 Figure 6. 12: A photograph of a foam core of a Mark I phantom after use, the flow of deionised water
through the phantom has caused the CM TMM to re-liquefy. ... 158 Figure 6. 13: The harmonic TICs determined from CEUS data for the Mark IIa phantom cores, for: (a) a fully
soaked foam, (b) a semi soaked foam, (c) a PVAc injected foam, (d) a semi-soaked and PVAc injected foam. UCA were injected in the first 10 seconds of imaging for (a) and (d) and immediately in (b) and (c)... 159 Figure 6. 14: The harmonic TICs determined from CEUS data for the Mark IIb phantom core from different
regions in the combined PVAc phantom, presented are, from top to bottom: (a) the least dense PVAc foam, (b) a medium density PVAc foam and (c) the densest PVAc foam. Note the different y-axis scale of graph (c). ... 160 Figure 6. 15: Stills are presented from a CEUS video sequence illustrating the flow of the UCA through the
phantom, with example regions of interest used for TIC analysis marked on the first image and some features of perfusion dynamics of interest marked with arrows in the images within the main panel. The phantom was imaged from the side, and hence the flow in these images is from left (near the input) to right (where the output was positioned). The phantom gradually brightens with bands of high intensity perfusion seen in the later frames (10 – 17). ... 162 Figure 6. 16: TICs for regions of interest placed close to the input vessel, in a ‘healthy’ tissue mimicking foam
region (e.g. ROI 1 Figure 6.15), for the general CEUS pre-set (top row), and the SH maps of the response of the ‘Native’ UCA (middle row) and the ‘Altered’ UCA (bottom row). The blue arrows indicate the time of injection. ... 163 Figure 6. 17: TICs for regions in a ‘healthy’ tissue mimicking foam region (e.g. ROI 2 Figure 6.15), for the
8
Figure 6. 18: TICs for regions in a ‘diseased’ tissue mimicking foam region (e.g. ROI 3 Figure 6.15), for the general CEUS pre-set (top row), the SH maps of the response of the ‘Native’ UCA (middle row) and the ‘Altered’ UCA (bottom row). The blue arrows indicate the time of injection. ... 165 Figure 6. 19: TICs for regions in a ‘necrotic’ tissue mimicking foam region (e.g. ROI 4 Figure 6.15), for the
general CEUS pre-set (top row), the SH maps of the response of the ‘Native’ UCA (middle row) and the ‘Altered’ UCA (bottom row). The blue arrows indicate the time of injection. ... 166 Figure 6. 20: Examples of the calculated TICs for ‘Altered’ UCA passing through a vessel in the ‘healthy’
9
Table of Tables
Table 2. 1: Description of commonly used UCA in the liver and the countries in which they are licensed for use (Claudon et al., 2013). ... 26
Table 3. 1: Details of the single-element transducers used for transmission and receive of signals in the three BACS, with the corresponding transmit frequency ranges for each... 63 Table 3. 2: The variation of the single element transducer’s bandwidth as a function of driving frequency
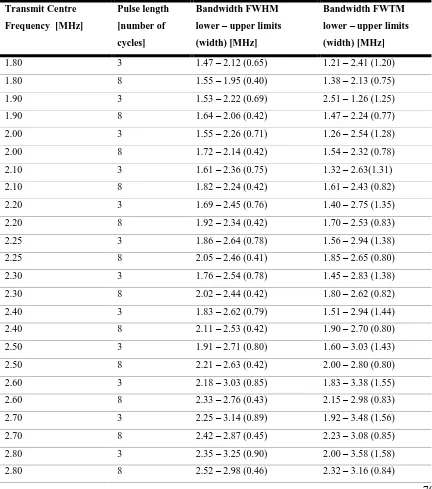
and pulse length for the frequencies available on the XC6-1 clinical research package measured using a needle hydrophone and calculated from frequency spectra determined using the Welch transform. The bandwidth is given in terms of the lower and upper limit of the frequency range with the width of the frequency range in brackets. ... 68 Table 3. 3: The variation of the single element transducer bandwidth as a function of excitation signal of
pulse length (3 cycles and 8 cycles) across the driving frequency range 1.8 – 3.7 MHz in steps of 0.1 MHz. The transmitted signal was measured using a needle hydrophone and the bandwidths calculated from frequency spectra determined using the Welch transform. The bandwidth is given in terms of the lower and upper limit of the frequency range with the width of the frequency range in brackets.70 Table 3. 4: The transmit centre frequency and corresponding input voltage to achieve a PNP output of 150
kPa. ... 75
Table 4. 1: The concentration, mean size and resonance frequencies of the clinical and research SonoVue® formulations, based on the number and volume weighted distributions. ... 91 Table 4. 2: Subharmonic amplitude at SHFWTM for the ‘Native’ and ‘Altered’ UCA at the transmit centre
frequencies which gave the highest subharmonic signal, 1.9 – 2.5 MHz and 2.3-2.5 MHz, respectively. The insonated solution made up to a concentration of 6.5 X 10 5 mb.ml-1. ... 104
Table 5. 1: The Aixplorer® research mode transmit frequency characteristics: transmit centre frequency, FWHM bandwidth and FWTM bandwidth, from hydrophone measurements. Measurements were made for all transmit frequency settings and all integer wavelength settings available on the XC6-1 probe. ... 121 Table 5. 2: The clinical CEUS pre-set transmit frequency characteristics: transmit centre frequency, FWHM
bandwidth and FWTM bandwidth, from hydrophone measurements made at 0 dB acoustic output. ... 123 Table 5. 3: The peak negative pressure measured across the six clinical frequencies at 0 dB acoustic output.
The highest acoustic output, 2.6 MPa at 3.4 MHz, was an indication that the resonance frequency of the transducer of the transducer was in this region. ... 124 Table 5. 4: The statistical measures of goodness-of-fit: R2, SSE and RMSE, for a linear regression model of
the data presented in Figure 5.5 showing the variation in the subharmonic signal measures SHAmp and
SHF as a function of concentration for the ‘Altered’ and ‘Native’ UCA. ... 126
Table 6. 1:List of research phantoms which are relevant to CEUS perfusion/flow imaging. ... 134 Table 6. 2: The weight composition (%) of the background Agar TMM. ... 154 Table 6. 3: The attenuation and speed of sound measured using a substitution technique for the hepatic
artery phantom TMMs. ... 167
Table 3. 1: Details of the single-element transducers used for transmission and receive of signals in the three BACS, with the corresponding transmit frequency ranges for each... 63 Table 3. 2: The variation of the single element transducer’s bandwidth as a function of driving frequency
and pulse length for the frequencies available on the XC6-1 clinical research package measured using a needle hydrophone and calculated from frequency spectra determined using the Welch transform. The bandwidth is given in terms of the lower and upper limit of the frequency range with the width of the frequency range in brackets. ... 68 Table 3. 3: The variation of the single element transducer bandwidth as a function of excitation signal of
10
from frequency spectra determined using the Welch transform. The bandwidth is given in terms of the lower and upper limit of the frequency range with the width of the frequency range in brackets.70 Table 3. 4: The transmit centre frequency and corresponding input voltage to achieve a PNP output of 150
11
Abbreviations
AIUM The American Institute of Ultrasound in Medicine AM Amplitude Modulation
AUC Area under the curve
BACS Bubble Acoustic Characterisation System CEUS Contrast-enhanced ultrasound
CT Computed Tomography
CTR Contrast-to-tissue ratio
CM Condensed milk
DCEUS Dynamic contrast-enhanced ultrasound DH2O Deionised water
FBV Fractional blood volume FEI Flash-echo Imaging FLL Focal liver lesion
FWHM Full-width at half maximum FWTM Full-width at tenth maximum GUI Graphical User Interface HCC Hepatocellular carcinoma
HI Harmonic imaging
IEC International Electrotechnical Commission
MI Mechanical index
12
PI Pulse inversion
PNP Peak Negative Pressure PPP Peak Positive Pressure PRF Pulse Repetition Frequency PVAc Poly-vinyl-alcohol cryogel PVC Poly-vinyl-chloride
QA Quality Assurance
RF Radio Frequency
RMSE Root mean square error ROI Region of Interest RPM Revolutions per minute SAD Sum of absolute difference
SH Subharmonic
SHAPE Subharmonic Aided Pressure estimation SHF Subharmonic-to-Fundamental Ratio
SHFWHM Subharmonic bandwidth defined by the transmit fundamental FWHM SHFWTM Subharmonic bandwidth defined by the transmit fundamental FWTM SHAmp Subharmonic amplitude
SHAmp FWHM Subharmonic amplitude integrated over SHFWHM SHAmp FWTM Subharmonic amplitude integrated over SHFWTM
SHFFWHM Subharmonic-to-Fundamental Ratio integrated over the FWHM bandwidths SHFFWTM Subharmonic-to-Fundamental Ratio integrated over the FWTM bandwidths SHI Subharmonic imaging
13 TIC Time-intensity curve
TMM Tissue Mimicking Material TR Transmit at resonance T2R Transmit at twice resonance UCA Ultrasound Contrast Agent
2D Two-dimensional
14 Symbol
A area of the transducer
a width of the piezoelectric elements
c sound velocity in the medium
cs speed of sound in the sample
cw speed of sound in the deionised water
d distance travelled by the pulse
dthick thickness of the TMM sample
drise distance for a bubble to rise
ℱ Fourier Transform ℱ−1 Inverse Fourier transform
fnumber number of firings of the transducer elements
g the gravitational force
γ gas-liquid surface tension
γ(R) effective surface tension
Iin input current
Isample mean of the power spectrum of the signal through the sample,
Iwater mean of the power spectrum of the signal through deionised water
J the reciprocity parameter
k polytropic exponent
κ heat capacity
𝜅𝑠(𝑅) effective dilatational surface viscosity MH(f) hydrophone frequency response/sensitivity
15
μl liquid viscosity
µi mean of a sample
µT mean of the population ∆𝜇̂𝑇 standard error
N number of population samples
n number of samples
Naperture number of elements in the aperture
nPe number of piezoelectric elements in the transducer nRF number of RF samples per firing
nV number of voxels in a line
ni number of samples/measurements
P pressure recorded
P0 ambient pressure
PA excitation pressure with amplitude A
𝑃𝐺 gas pressure
𝑃𝐺0 initial gas pressure
Pd acoustic pressure at distance d
R bubble radius
𝑅̇ first order time derivative of the bubble radius 𝑅̈ second order time derivative of the bubble radius
Ro initial bubble radius
ρl liquid density
S transmitsensitivity
16
Δt time shift in the RF pulse
t time
to the delay time from t = 0 to the time the function begins
tmax time of the peak enhancement
trise time for bubble to rise drise
τ transmit time
V output voltage of the hydrophone
zf depth of the focus
ω frequency
17
Chapter 1 Introduction
1.1 Context and Motivation
Over the last 20 years (Wei et al., 1998), quantitative perfusion ultrasound imaging with ultrasound contrast agents has demonstrated potential for diagnosing tumour malignancy and assessing angiogenesis; however, poor reproducibility, low signal and poor contrast performance often lead to poor quantification accuracy. Recent advances in ultrasound technology open up new possibilities to address these problems by improving signal quality (and hence image quality) and allowing for more robust modelling of contrast agent uptake curves, measured as time intensity curves. However, optimal strategies for implementing these concepts have not been fully investigated or exploited. One such area of high potential, that of Subharmonic Imaging, was the focus of this project.
Liver cancer is the second most common cause of cancer death worldwide, accounting for 9.1% of all cancer deaths, and is most prevalent in less developed regions, where 83 % of the new liver cancer cases occurred in 2012 (Ferlay et al., 2015). The ratio of mortality rate to incidence rate of liver cancer is 0.95 and therefore, the geographical patterns of incidence and mortality are quite similar. Furthermore, the incidence and mortality rate of Hepatocellular Carcinoma also tripled in the United States between 1972 and 2005 (Altekruse et al., 2009). Southern Europe and Northern America have intermediate rates, while the lowest rates are in the North of Europe and South-Central Asia (Ferlay et al., 2015). The poor prognosis of liver cancer means that early detection and tracking of treatments are of particular interest and importance.
18 ultrasound energy and monitoring the subsequent replenishment of the microbubbles from the body (Tang et al., 2011).
Subharmonic imaging, has been suggested as a means of producing more accurate assessment of vascularisation due to its potential for tissue suppression (Forsberg et al., 2000). However, the technique, which has been used in research settings (Forsberg et al., 2007), has not been implemented clinically, and therefore, current commercially available ultrasound contrast agents have not been optimised for subharmonic imaging nor have clinical ultrasound systems been optimised for the detection of low frequency subharmonic signals, specific to abdominal imaging.
1.2Aim and Objectives
The aim of this work was to develop an optimised subharmonic ultrasound imaging technique for use in dynamic contrast enhanced ultrasound quantification techniques to assess blood perfusion in liver tumours. The technique needed to be developed for use on a clinical ultrasound system for liver imaging and, therefore, the frequency range 1 – 6 MHz was investigated. To develop such a technique, it was first necessary to investigate and optimise the generation of subharmonic signals in a bench-level system, and then transfer this optimised technique to a clinical ultrasound system.
The main objectives and goals of this thesis are summarised below:
1. Development of bench-level bubble acoustic characterisation system, which required:
A system to be capable of measuring the attenuation and subharmonic signal level from ultrasound contrast agents.
Development of an optimised technique required control of the transmit beam, specifically, the transmit centre frequency and pulse length; additionally the pressure of the system, due to an initial threshold for generation of subharmonic signals and related to the amplitude of the signal thereafter, also needed to be controlled.
A code was also required to analyse the frequency content of the recorded signals and to extract the relevant subharmonic signals.
19
The technique developed to be at a controlled applied acoustic pressure which was sufficiently high to elicit a subharmonic response but also did not disrupt UCA.
The technique to be optimised in terms of transmit parameters, to achieve the maximum subharmonic generation corresponding to the strongest signal and therefore, greatest contrast in imaging.
The UCA size distribution to be investigated for maximising subharmonic generation and to assess quantification accuracy and reproducibility of the technique.
An appropriate subharmonic signal bandwidth to be established which did not include contamination from other signals, specifically the fundamental signal component.
3. Transfer of the optimised technique to the clinical ultrasound system, which required:
Access to raw radiofrequency data (Raw RF data).
Transfer of the optimised transmit parameters to the clinical ultrasound system.
A robust method of extracting the subharmonic frequency content from the Raw RF data.
The development of a novel phantom device which mimicked various attributes of liver perfusion, including but not limited to: areas mimicking various stages of disease, heterogeneous microvasculature, isotropic flow, a clinically relevant input/output system, and some qualities which allowed for the comparison of current clinical techniques to the newly developed technique.
The development of a technique for dynamic contrast enhanced ultrasound, including the development of a robust code to analyse the dynamic data and produce time-intensity curves from processed clinical data and Raw RF data, which allowed testing/comparison of techniques and UCAs.
1.3Thesis Overview
20 Supersonic Imagine, France). The chapters, which are outlined as follows, track the
development of this technique from a bench level system to implementation using the clinical ultrasound system.
Chapter 2: Background & Literature
The background knowledge required for all subsequent chapters is provided in Chapter 2 along with a review of the current uses of subharmonic imaging techniques. The chapter begins with a brief introduction to microcirculation and angiogenesis. The reader is then introduced to ultrasound imaging and specifically contrast enhanced ultrasound imaging for the diagnosis of liver cancer. A description of UCA and microbubble encapsulation models follows. The nonlinear response of UCA to insonation is then discussed, including the production of harmonic and subharmonic signals. Next, the theory of subharmonic generation is described, detailing the subharmonic regimes and the transmit parameters required for the production of subharmonic signals. A brief review of the use of subharmonic imaging in vivo in the research environment is then presented. The techniques of administering UCA are then discussed, including bolus injection and burst replenishment techniques alongside models used for quantification of UCA dynamics when using both techniques. Finally, a summary of the literature in the context of the current work is presented.
Chapter 3: Development of a system for acoustic characterisation of ultrasound contrast agents
21
Chapter 4: Subharmonic Characterisation of Ultrasound Contrast Agents
The subharmonic response of two UCA was investigated; the commercial UCA SonoVue® (Bracco, Italy), made up as per the manufacturer’s instructions, called the ‘Native’ UCA and an ‘Altered’ UCA, made up by altering the size distribution of the ‘Native’ UCA using the method of decantation. The size distribution and attenuation of both UCAs were measured to establish the resonance frequency of each. The subharmonic response of both UCAs as a function of transmit centre frequency and pulse length was investigated to establish the transmit parameters which yielded the highest subharmonic signal. Furthermore, the method of defining the frequency bandwidth of the subharmonic signal was considered. The maximum subharmonic responses of the two UCA were compared to each other and computational predictions of subharmonic response from a simulation of UCA at various sizes with the physical characteristics of SonoVue®. In this way the optimum technique for subharmonic generation was established for translation to the clinical ultrasound scanner.
Chapter 5: Initial transfer of the optimised subharmonic imaging technique to a clinical ultrasound system
22
Chapter 6Investigation of SHI DCEUS on the clinical ultrasound system using novel liver mimicking phantoms
Chapter 6 details the design and development of novel liver mimicking phantoms, which were then used to test the subharmonic imaging dynamic contrast-enhanced ultrasound technique. The first phantom developed was designed to mimic the complex perfusion dynamics of various stages of liver disease and test the ability of the system to detect changes in the time-intensity curves (TICs) associated with the different vascularisation of the ‘tissue types’. Furthermore, the phantom was designed to include a harmonic signal component to mimic the tissue harmonic components which can contaminate current CEUS techniques, thereby allowing the phantom to be used to compare the newly developed optimised subharmonic imaging technique with the clinically practiced CEUS technique. Therefore, the developed perfusion phantom was unique in its ability to both mimic diseased tissue vasculature, in its heterogeneous and isotropic nature, and provide a harmonic ‘tissue’ component for comparison of subharmonic and harmonic imaging techniques. In addition to comparing these techniques, measured time-intensity curves were used to compare the two UCAs and assess their potential for use in quantification techniques. A second phantom, a flow phantom mimicking the acoustic characteristics of diseased liver tissue, was used to further assess the optimised technique’s application on the clinical scanner with the ‘Altered’ UCA. This investigation exposed the limitations of the scanner in implementing the optimised technique for clinically relevant attenuations and depths of the liver.
Chapter 7: Conclusions
23
Chapter 2 Background
Tumour progression is a multistage process depending on a number of alterations in cell physiology which combine to dictate cancerous growth (Averkiou et al., 2010). Angiogenesis is a complex process involving the formation of new blood vessels from pre-existing vessels, while it is a normal process which occurs in healthy tissue, it is also a fundamental step in the formation of malignant tumours.
Angiogenesis has been a topic of interest in cancer research since 1971 after Folkman (Folkman, 1971) developed the hypothesis that tumor growth was an angiogenesis-dependent process. Today it is widely recognized that a key part of the growth and development of malignant tumours is the development of a network of micro-capillaries which satisfy the tumours nutrient requirements. The generation of malignant tumour masses relies on both tumour cell proliferation and angiogenesis (Folkman, 2006). As a result, there has been a great interest in the development of anti-cancer treatments and drugs which are designed to both stop the development of these new capillaries and/or attempt to destroy those already created, cutting off nutrient supply and, therefore, killing tumour cells. Techniques which are capable of measuring the perfusion of blood through the capillary network could, therefore, shed light on tumour malignancy and the response of tumours to anti-angiogenic therapy. Patients may continue to take angiogenesis inhibiting drugs for extended periods of time, sometimes 3 – 5 years, without evidence of drug resistance (Folkman, 2006). As they may be used for such prolonged periods, early evidence of the drugs ability to inhibit angiogenesis for a particular patient is important. If the drug is found to be working early on, continued treatment could go on as planned; however, if the treatment is not seen to be successful, alternative drugs or doses may be used to tackle the tumour before it becomes more aggressive.
2.1 Microcirculation and Angiogenesis
Angiogenesis is a prerequisite for tumour growth greater than 2 𝑚𝑚2 and is a key factor of metastasis by allowing the in-growth of vessels into a tumour providing a pathway for systemic dissemination via the blood or lymph system.
24 evidence that angiogenesis can be switched on at different stages of tumour progression, depending on the nature of the tumour and the microenvironment; however, neovascularization is a prerequisite for tumour progression (Bergers and Benjamin, 2003). Measuring tumour flow and vascular volume at different stages in the progression of the tumour may provide valuable information regarding the response of tumours to anti-angiogenic therapies.
2.2 Liver Cancer and Contrast Enhanced Ultrasound (CEUS)
Ultrasound imaging is based on the principle of echolocation and is used in many clinical applications, due particularly to the use of non-ionising radiation and relative low cost per examination. Other advantages of ultrasound imaging include the achievement of relatively high spatial, contrast and temporal resolution and, therefore, it is regarded as a good option for many clinical applications and examinations. However, conventional imaging can have limitations with the imaging depth and the contrast-to-tissue ratio. Ultrasound contrast agents (UCA), used in contrast-enhanced ultrasound (CEUS) may be used to increase the amplitude of echoes from deeper lying structures, allowing for improved detectability and hence applicability of ultrasound imaging in general. With the development of advanced ultrasound imaging techniques, such as the use of microbubble contrast agents, harmonic and subharmonic imaging, volumetric imaging and plane wave imaging, there has been a great increase in the research and use of ultrasound imaging for abdominal, cardiac and breast imaging applications in particular. For example, in cardiac imaging CEUS has been used to assess cardiac output by measurements of blood flow based on UCA dilution (Mischi et al., 2003), in breast imaging applications SHI CEUS has been shown in improve diagnosis and lesion characterisation (Forsberg et al., 2007), and in abdominal imaging, harmonic imaging CEUS in the liver has become established as a method of lesion characterisation (Claudon et al., 2013). CEUS using harmonic imaging and subharmonic imaging are further discussed in Sections 2.4, 2.5, 2.6 and 2.7.
Cancer is a leading cause of death worldwide, accounting for 8.2 million deaths in 2012 (Stewart BW., 2014). The most common causes of cancer death are cancers of (Stewart BW., 2014):
lung (1.59 million deaths/year)
liver (745,000 deaths/year)
stomach (723,000 deaths/year)
25
breast (521,000 deaths/year)
oesophageal cancer (400,000 deaths/year)
Hepatocellular carcinoma (HCC) is the most common type of liver cancer, which begins in the main type of liver cell, hepatocyte cells. Cancer can also develop in other types of cells in the liver; however, these are far less common. There is a need for the development of tools that provide sufficient resolution to assist in the early diagnosis of HCC, patient stratification for prognosis and therapy (Wang XW, 2011). HCC is most frequently developed in patients with diseased liver, so that both HCC and cirrhosis deeply influence survival and both simultaneously contribute to the applicability and efficacy of therapy. Due to the dual blood supply of the liver tissue by the hepatic artery (25 – 30 %) and the portal vein (70 – 75 %), three overlapping vascular phases can be defined and visualised using CEUS. These are the arterial, portal and late phases. The length of each phase depends on the circulatory status. The arterial phase starts from 10 – 20 seconds post injection and generally lasts approximately 10 – 15 seconds. The portal phase generally continues for about 2 minutes, while the late phase continues until the contrast agent is cleared out of the hepatic parenchyma. The late phase is dependent on the UCA used, which is thought to result in different uptake of the Kupffer cells and has been shown last up to 4 – 6 minutes using the UCA SonoVue® (Claudon et al., 2008). Focal liver diseases have also developed into one of the most important applications of CEUS due to the improvement in detection and characterisation of lesions over conventional ultrasound (Claudon et al., 2008).
As with all imaging modalities there are limitations to the use of CEUS in liver, including (Claudon et al., 2013):
The resolution achievable and the particular scanning conditions mean that the smallest detectable lesions range between 3 – 5 mm in diameter, and hence very small Focal Liver Lesions (FLL) may be overlooked.
Lesions which are sub-diaphragmatic may not be accessible.
The falciform ligament and surrounding fat can result in an enhancement defect in images which may be misinterpreted as a FLL.
26 as hyper-enhanced with complete non-enhancing areas due to necrosis and may also feature chaotic vessels, in the portal venous phase, will appear iso-enhanced, hypo-enhanced and non-enhanced (necrosis) in different areas, while in the late phase the lesion will be hypo-enhanced potentially with non-hypo-enhanced necrotic regions (Claudon et al., 2013). Furthermore a focal nodular hyperplasia (FNH) will appear as a hypo-enhanced lesion throughout a CEUS examination (Dietrich, 2004). There has recently been a move towards perfusion quantification and assessment of antiangiogenic treatment using CEUS in the liver (Claudon et al., 2013).
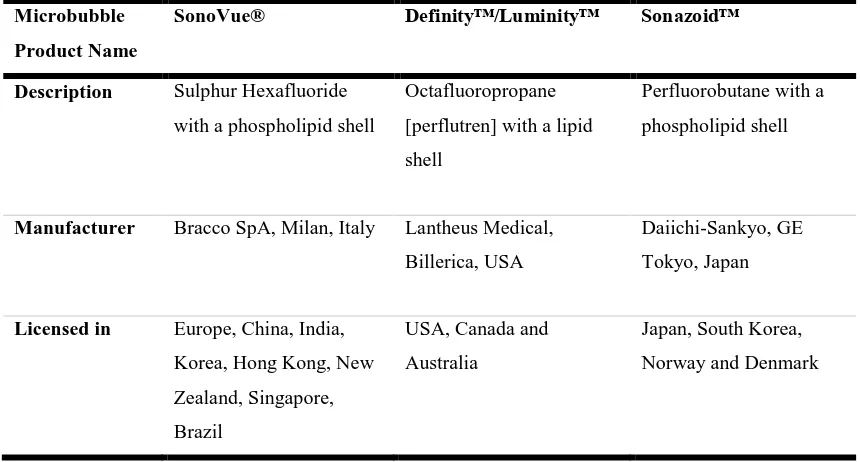
[image:32.595.55.485.394.625.2]The use of more advanced techniques, such as subharmonic imaging, which results in increased tissue suppression, may improve the detectability of smaller and deeper lesions. There are three commonly used UCA in the liver at the present time, SonoVue®, Definity™, and Sonazoid™ (Table 2.1). SonoVue® is marketed as Lumason® in the USA but is not currently licensed for use in the liver (Nolsøe and Lorentzen, 2016).
Table 2. 1: Description of commonly used UCA in the liver and the countries in which they are licensed for use (Claudon et al., 2013).
Microbubble
Product Name
SonoVue® Definity™/Luminity™ Sonazoid™
Description Sulphur Hexafluoride
with a phospholipid shell
Octafluoropropane
[perflutren] with a lipid
shell
Perfluorobutane with a
phospholipid shell
Manufacturer Bracco SpA, Milan, Italy Lantheus Medical,
Billerica, USA
Daiichi-Sankyo, GE
Tokyo, Japan
Licensed in Europe, China, India,
Korea, Hong Kong, New
Zealand, Singapore,
Brazil
USA, Canada and
Australia
Japan, South Korea,
Norway and Denmark
2.3 Microbubble Ultrasound Contrast Agents
The three main requirements for ultrasound contrast agents are (Stride, 2005):
27
Longevity - microbubble survival times should be sufficient to enable imaging of the required region.
Safety- microbubbles should pose no risk to the patient.
In addition to the above requirements an ideal microbubble should (Stride, 2005):
Respond predictably and reproducibly
Have a well-defined destruction threshold
Locate preferentially in the region of interest
Be economical to produce
Be convenient to administer
Eventually disintegrate or be eliminated from the body.
In diagnostic ultrasound imaging, the majority of contrast agents used for imaging microvasculature are comprised of microbubbles, typically between 1 – 10 μm in diameter, with some nanobubbles (400-800 nm) recently developed for targeted drug delivery techniques (Paefgen et al., 2015). Nanobubbles were not used in this work and therefore, all further references to UCA refer to microbubble UCA. UCA are gas filled with a stabilising shell (Figure 2.1). The gas contained in microbubbles, usually air or Perfluorocarbon gas, and the stabilising shell (denatured albumin, surfactants or phospholipids) are crucial to the effectiveness of microbubbles as UCA and must allow them to be sufficiently stable so that they persist in the circulatory system for several minutes after injection to allow sufficient time for imaging of the region of interest to take place. Encapsulated UCA microbubbles can be injected into the circulatory system to act as red blood cell tracers as their size is close to that of red blood cells, which are approximately 6 – 8 μm in diameter. Microbubbles are, therefore, sufficiently small that they may cross the capillary bed of the pulmonary circulation, but also large enough that they do not cross the vascular endothelium, allowing them to be true intravascular contrast agents. Unlike in other modalities such as MRI, microbubble contrast agents in ultrasound do not leak from capillaries, they remain entirely in the microvasculature.
28
Figure 2. 1: The structure of a microbubble UCA (1 – 10 μm), composed of a perfluorocarbon gas encapsulated in phospholipid shell (10 – 100 nm).
UCA result in a large difference in acoustic impedance, which in turn increases the amplitude of the reflected signal. Through this increase in reflectivity, UCA are used to produce enhanced signals from blood vessels, resulting in an improved sensitivity to both deeper tissues and very small vessels which might otherwise be invisible using conventional ultrasound techniques. Reflectivity is proportional to the fourth power of the particle diameter and also directly proportional to the concentration of the particles themselves, for a UCA of certain size increasing the number of particles in a region leads to a direct increase in signal, this relationship can be exploited for use in quantification techniques. In addition to providing increased reflectivity, the UCA generate harmonic and subharmonic signals as a result of nonlinear behaviours.
Due to their small diameter, a, in comparison with the wavelength of ultrasound (λ 1 – 0.1 mm >> a), UCA are Rayleigh scatters (Hedrick WR, 1995). As fluid pushes on the surface of the microbubble, its inertia and the stiffness of the entrapped gas of the microbubble lead to the mechanical response which results in enhanced echo signals. The balance between these competing factors results in a resonant frequency given by:
𝑓𝑟 =
1
2𝜋𝑎√
3𝛾𝑐𝑃0
𝜌𝑐 (2.1)
where a is the microbubble radius, 𝜌𝑐 the density of the surrounding medium (i.e. the surrounding blood), 𝛾𝑐 =𝑐𝑝
𝑐𝑣, the ratio of the heat capacities at constant pressure and volume
and 𝑃0 the static pressure at the bubble surface. For microbubbles < 7 μm in diameter this
resonance frequency corresponds to the frequencies used in diagnostic ultrasound (2 – 10 MHz) (Cosgrove, 2006).
Perfluorocarbon gas Phospholipid Shell
29 The usefulness of UCA for deep abdominal imaging was suggested in the literature shortly after their introduction (Forsberg et al., 1998) and predicted the use of contrast kinetics in differentiating benign from malignant tumours. Using UCA for the assessment of blood flow and tissue perfusion means that the microbubbles must meet a number of conditions:
The UCA must be representative for blood, therefore, intravascular distribution and flow of the agent must be equal to that of red blood cells.
The UCA should not influence the blood in anyway.
The UCA should not separate from the blood stream (Greis, 2011).
First generation microbubbles were air-filled and coated with galactose microcrystals (Levovisit) or denatured albumin (Albunex); however, these are no longer in common use (Kim et al., 2008). Second generation microbubbles contain perfluorocarbon gases such as perfluoropropane (Definity™, Lantheus Medical Imaging, USA) or sulphur hexafluoride (SonoVue®, Bracco, Italy), and are encapsulated with phospholipid shells (Kim et al., 2008). These low solubility and low diffusibility gases have been found to dramatically improve UCA persistence. Ideally a filling gas should have a low solubility in blood, be inert and present a high vapour pressure. Second generation UCA also remain more uniform in size when in the blood, allowing for a more consistent backscatter, which is related to bubble radius, and therefore providing potential improvements for quantification accuracy.
The UCA SonoVue® was used in this work. It is a sulphur hexafluoride-filled microbubble contrast agent encapsulated by a flexible phospholipid shell. In the body, SonoVue® has an elimination half-life of six minutes and more than 80% of the compound is exhaled through the lungs. The advantage of sulphur hexafluoride-filled compared to air-filled microbubbles is the high stability and prolonged persistence in peripheral blood. As the gas displays a low solubility and the phospholipid shell is stable, along with the uniformity of the microbubble diameter there is improved backscattering and harmonic behaviour at low acoustic power insonation.
2.4 Nonlinearity and Harmonics
30 Tissue is almost incompressible, and therefore, is mainly a linear resonator. However, UCA have a fragile flexible boundary and are compressible, they can expand and contract with the compressional and rarefractional half cycles of sound waves when insonified, which allows for nonlinear oscillation to take place above a threshold pressure. UCA therefore act as nonlinear resonators that under certain conditions may change size, cavitate, and fragment or be moved. This nonlinear resonance behaviour leads to the generation of both harmonic and subharmonic signals from the UCA.
The oscillatory response of UCA depends on the acoustic power of the transducer, as well as the shell material. At low acoustic powers symmetrical oscillations occur, similar to those in tissue but with enhanced echo signal, and the frequency of the scattered signal is the same as the transmitted pulse. At this stage the expansion and contraction of the bubble is symmetric about its equilibrium position. However, as the acoustic power is increased the microbubble begins to oscillate nonlinearly. This is because, for larger amplitude sound fields, a bubble can expand with the sound field, but it cannot contract without limit as the volume of the encapsulated gas can only be compressed so far (Figure 2.2). This finite compression limit leads the pressure response of the microbubble to be asymmetric as a function of time. This unequal response is said to be nonlinear and causes the returning signals to contain multiples of the insonation frequency, which are known as harmonics.
Microbubble ultrasound contrast agents, therefore, at high incident pressure produce an asymmetric response with a peak amplitude that is not in proportion to the peak amplitude
The incident pressure wave is symmetric
UCA can only contract so far under positive pressure, but can expand much further under negative pressure
Resulting asymmetrical vibrations produce nonlinear signals
31 of the incident pulse. This nonlinearity can be used to enhance the contrast-to-tissue ratio in ultrasound imaging. The contrast-to-tissue ratio (CTR) is defined as the ratio of the mean intensity within the region of interest with microbubbles to the mean intensity within the ROI in the tissue (Hwang and Woo, 2012). The nonlinear characteristics of the contrast agent results in harmonic generation, allowing for the contrast agents to be optimally imaged using harmonic imaging techniques.
In harmonic imaging (HI) the transducer transmits at a frequency 𝑓0 but is set to detect at the
first harmonic frequency, 2𝑓0, by using high pass filters to block the detected component at the fundamental frequency. HI leads to restrictions on the bandwidth available for imaging: in order to ensure that there is no contamination of the harmonic signal by the fundamental signal there should be minimum overlap between the two harmonic and fundamental bandwidths (Averkiou et al., 2003). If the transmitted signal overlaps with the received bandwidth, a type of acoustic harmonic noise is created that can interfere with the pure harmonic echoes. Therefore, longer pulses are transmitted to narrow the transmit spectrum, which results in a loss of axial resolution (Szabo, 2004).
Harmonic imaging does not result in total cancelation of tissue signal and as a result blood-to-tissue contrast can suffer due to harmonic generation and accumulation in tissue. As the ultrasound pulse propagates through tissue, a nonlinear response causes the waveform within the pulse to become distorted so that the returning echoes contain not only the fundamental frequency but also harmonics of that frequency. The peaks of the pressure wave travel marginally faster than the troughs due to the different velocity of the ultrasound propagation in compressed tissue compared with relaxed tissue, this gives rise to a distorted saw-tooth pulse, which will eventually form a shock wave resulting in the generation of harmonics. The amplitude of the harmonics is related to the nonlinear parameter B/A of the tissue through which the pulse is travelling. There is, therefore, also a small amount of harmonic produced in tissue as well as by the contrast agent. This is one of the main issues with harmonic imaging, as the generation of harmonics in tissue can decrease the CTR, this is especially true for deeper lying structures.
32 two or more pulses with each new pulse being the inverse of the previous one, i.e. applying a phase difference of π, and adding the echoes to remove the fundamental component without the use of any filtering operation. This method removes the requirement of narrowband transmit for harmonic signal extraction and even in the case of broadband transmit, where fundamental and harmonic components overlap, the second harmonic component can be isolated. Since the original pulses differ in phase by an amount equal to π, their respective odd harmonic components (n = 1, 3, 5, . . .) differ in phase by nπ and are inverses of one another and thus cancel by addition, whereas the even harmonic components (n = 2, 4, 6, . . .) double since they differ by 2nπ (Averkiou, 2000). If the scattering is nonlinear, as in the case of microbubbles, the two sequences will not cancel on addition, thus providing a way of cancelling the fundamental and odd harmonic components, but preserving or amplifying the 2nd harmonic and other even components.
Bernatik (Bernatik et al., 2001) compared a wideband HI technique using PI with conventional US for detecting liver lesions. The study involved 28 patients and 63 lesions, and CEUS HI was found to detect 97% of lesions previously detected with X-ray CT, compared to a corresponding detection rate of 59% for conventional US. However, the study did not include a comparison to conventional non-HI CEUS.
Amplitude Modulation (AM) is similar to pulse inversion in that two pulses are emitted; however, both pulses are of the same phase with one being amplitude scaled relative to the other. Typically, the second pulse is transmitted along the same line with twice the amplitude of the first, and upon detection it is rescaled before summing, which results in the cancelation of the linear signal component. The echoes from stationary tissue are cancelled since, for linear scatterers, the second echo sequence will be identical to the first, apart from having twice the amplitude. This is not the case for a nonlinear scatterer, such as the microbubbles, for which there will be a residual nonlinear signal after subtraction (Whittingham, 2005). The advantage of amplitude modulation over pulse inversion is that the odd order harmonics are preserved as non-linear signals and will not scale to the same echo as is present in the first pulse. The movement of tissue interfaces between transmissions will limit the performance of amplitude modulation since the echoes from a given interface will not be in the same positions as their respective echo sequences when they are subtracted, and furthermore it is technically difficult to generate two pulses where one is precisely half the amplitude of the other (Whittingham, 2005).
33 as harmonics are also produced in tissue, total cancellation of tissue signal is not achieved. Even with the use of techniques developed to improve CTR, residual tissue signal still remains in harmonic imaging. This limitation has led to the development of subharmonic imaging techniques which are discussed in the next section.
2.5 Dynamic Contrast Enhanced Ultrasound
Dynamic Contrast Enhanced Ultrasound (DCEUS) is a type of CEUS which involves rapidly and sequentially imaging a region of interest immediately before and then after a bolus injection of an ultrasound contrast agent or during a constant infusion combined with a burst-replenishment technique. By imaging a region of interest continuously from wash-in of the UCA, through peak enhancement and to wash-out, DCEUS can be used to characterise different lesions and to quantify perfusion through various parameters derived from the resulting measured signal as a function of time, i.e. the time intensity curve (TIC). Typically DCEUS includes the use of harmonic imaging.
34 study. Furthermore, the commercial UCA available are not optimised for quantification techniques and have wide size distributions which may also limit the quantification accuracy as the response, in terms of harmonic and also subharmonic imaging, of the UCA to transmitted signals is dependent on their resonance frequency which in turn is dependent on the microbubble size.
Kogan (Kogan et al., 2011) compared 2 methods using low-intensity non-destructive ultrasound, to observe UCA enter the rodent kidney microvasculature and assess flow ‘‘rate’’ by either fitting a wash-in rate model or a parametric method, and estimate the time for the contrast signal to return to a set percentage of maximum signal enhancement. The wash-in method was found to be less sensitive than the parametric method in detecting changes in renal blood flow, but also relatively insensitive to UCA infusion rate. Renal blood flow was modulated through different doses of Angiotensin II. DCEUS was reported to be suitable for use in a calibrated quantitative measurement of perfusion in vivo with enough sensitivity to evaluate differences in regional responses to vasoactive drugs. Similar to the previously discussed quantification study, this study might benefit from the use of subharmonic imaging and UCA altered to achieve better quantification accuracy.