Direct observation by time-resolved infrared
spectroscopy of the bright and the dark excited
states of the [Ru(phen)
2
(dppz)]
2+
light-switch
compound in solution and when bound to DNA
†
Fergus E. Poynton,abJames P. Hall,cdP´araic M. Keane,acChristine Schwarz,c Igor V. Sazanovich,eMichael Towrie,eThorfinnur Gunnlaugsson,ab
Christine J. Cardin,cDavid J. Cardin,cSusan J. Quinn,fConor Long*g and John M. Kelly*a
The [Ru(phen)2(dppz)]2+complex (1) is non-emissive in water but is highly luminescent in organic solvents or when bound to DNA, making it a useful probe for DNA binding. To date, a complete mechanistic explanation for this“light-switch”effect is still lacking. With this in mind we have undertaken an ultrafast time resolved infrared (TRIR) study of1and directly observe marker bands between 1280–1450 cm1, which characterise both the emissive“bright”and the non-emissive“dark”excited states of the complex, in CD3CN and D2O respectively. These characteristic spectral features are present in the [Ru(dppz)3]
2+
solvent light-switch complex but absent in [Ru(phen)3] 2+
, which is luminescent in both solvents. DFT calculations show that the vibrational modes responsible for these characteristic bands are predominantly localised on the dppz ligand. Moreover, they reveal that certain vibrational modes of the
“dark”excited state couple with vibrational modes of two coordinating water molecules, and through these to the bulk solvent, thus providing a new insight into the mechanism of the light-switch effect. We also demonstrate that the marker bands for the “bright” state are observed for both L- and D -enantiomers of1when bound to DNA and that photo-excitation of the complex induces perturbation of the guanine and cytosine carbonyl bands. This perturbation is shown to be stronger for the L -enantiomer, demonstrating the different binding site properties of the two enantiomers and the ability of this technique to determine the identity and nature of the binding site of such intercalators.
Introduction
Molecular probes, whose luminescence is“switched on”in the presence of an analyte are attractive to researchers as both
diagnostic and imaging agents due to the extremely low limit of detection achievable with such systems. However, in order to design and optimise new probes, a detailed understanding of the photophysical processes responsible for this“switch on”in luminescence is essential. One particular class of ruthenium polypyridyl complexes, based on the dppz ligand (dppz ¼ dipyrido[3,2-a:20,30-c]phenazine), has been the focus of signi -cant investigation since the rst reports of their remarkable luminescence behaviour.1,2 [Ru(phen)2(dppz)]2+ (phen ¼ 1,10-phenanthroline) (1) (Fig. 1), for example, is only very weakly emitting in water but is strongly luminescent in non-protic organic solvents or when bound to double-stranded DNA.3–6
This makes1valuable as a“light-switch”for the detection of double-stranded DNA,2 and consequently an excellent
candi-date for luminescence imaging and biological proling within cancer cells.7–14Furthermore, metal complexes of this type may
also have potential as photo-therapeutic agents.15–18
In an effort to understand the origin of this light-switch effect, the photophysical and excited-state properties of Ru-dppz complexes have been the focus of numerous
a
School of Chemistry, Trinity College Dublin, The University of Dublin, Dublin 2, Ireland. E-mail: jmkelly@tcd.ie
bTrinity Biomedical Sciences Institute (TBSI), Trinity College Dublin, The University of
Dublin, Dublin 2, Ireland
cDepartment of Chemistry, University of Reading, Reading RG6 6AD, UK
dDiamond Light Source, Harwell Science and Innovation Campus, Didcot, Oxfordshire,
OX11 0QX, UK
eCentral Laser Facility, Research Complex at Harwell, STFC Rutherford Appleton
Laboratory, Oxfordshire, OX11 0QX, UK f
School of Chemistry, University College Dublin, Dublin 4, Ireland
gThe School of Chemical Sciences, Dublin City University, Dublin 9, Ireland. E-mail:
conor.long@dcu.ie
†Electronic supplementary information (ESI) available: Experimental details, XRD spectra, spectra (UV-Vis, emission, IR and TRIR), tables of vibration, animations of vibrational modes of the complex and DFT calculation data. CCDC 1038710. For ESI and crystallographic data in CIF or other electronic format see DOI: 10.1039/c5sc04514b
Cite this:Chem. Sci., 2016,7, 3075
Received 24th November 2015 Accepted 26th January 2016
DOI: 10.1039/c5sc04514b
www.rsc.org/chemicalscience
Science
EDGE ARTICLE
Open Access Article. Published on 27 January 2016. Downloaded on 05/01/2017 08:42:34.
This article is licensed under a
Creative Commons Attribution 3.0 Unported Licence.
View Article Online
studies.3–6,19–42 Earlier photophysical studies were consistent
with the luminescence originating from a triplet metal-to-ligand charge-transfer (3MLCT) excited state with increased electron density localised on rings A–C of the dppz ligand (Fig. 1). By contrast it was proposed that in the non-luminescent“dark” state (i.e.in water), the increased electron density is concen-trated on the phenazine portion of the ligand (i.e.rings B, D, E).19–30Binding of water molecules onto the nitrogens of ring D
was considered to be a key factor in the non-radiative deacti-vation of the “dark” excited state, although the nature of interaction with the water molecules has not been fully established.
Many investigations into the nature of the light-switch behaviour of1and related compounds have relied on standard luminescence techniques.23–30 However, such methods only
provide information on the luminescent“bright”excited state species. Hence the use of other spectroscopic techniques that can yield information on both the“bright”and the non-emis-sive“dark”states needs to be considered. Previous studies have used transient visible absorption (TA)31,32 or time-resolved
resonance Raman (TR3) spectroscopy for this purpose.33–42
Time-resolved techniques reveal the excited state lifetime of1in aerated CH3CN to be 180 ns but only 250 ps in H2O.5,31While these studies clearly point to the presence of two distinct excited states, there has been some disagreement about the nature of these states in the literature, especially from computational studies.19–22
Time-resolved infrared (TRIR) spectroscopy can provide detailed structural information about excited states as well as providing excellent kinetic data.43–50 This technique has the
advantage of probing the specic vibrations of the polypyridyl ligands, being sensitive to changes in electronic structure and has spectral resolution superior to that of the TR3technique.51
However, to the best of our knowledge there has been no study of the excited states of1using TRIR. Such a study is reported below, which includes the homoleptic complexes [Ru(dppz)3]2+
(2) and [Ru(phen)3]2+ (3) in both CD3CN and D2O, where we show for the rst time that the “bright” and “dark” excited states of 1 have strikingly different TRIR spectra. This has allowed marker bands to be identied for1, which enables the excited state species produced in a particular medium to be readily identied. Comparative studies with2and3reveal that these marker bands correspond to vibrations associated with the dppz ligand. The nature of these vibrational modes was further characterised using DFT calculations, and in D2O numerous modes of vibration show strong coupling to the hydrogen bonded water molecules. Finally we demonstrate that these spectral signatures can be used to identify the“bright” excited state species of1when bound to DNA.
Results and discussion
Characterisation of complexes 1, 2 and 3
Complexes1,2and3were synthesised as their Cl and PF6salts by modied literature procedures (see ESI†for details).6,16,52Red
needle-shaped crystals of [1] 2PF6were grown by vapour diffu-sion of diethyl ether into a racemic solution of the complex in CH3CN. The molecular X-ray structures ofL- andD-1are shown in Fig. 2. The asymmetric unit contains two complexes (oneL and one D-enantiomer) and four PF6 counterions. The complexes exhibit distorted octahedral geometries around the metal atom, with Ru–N bond distances between 2.058(3)– 2.078(2)˚A and the dppz ligand exhibits a slight distortion from planarity. These observations are similar to those found in the crystal structure of [Ru(bpy)2(dppz)]2+ (bpy ¼ 2,20-bipyridine) (see Fig. S1–S4 and Tables S1 and S2 in the ESI†for further details).53,54
While complexes1,2, and3are emissive in CH3CN solution, no luminescence is detectable for the dppz-containing complexes 1 and 2 in water under comparable experimental conditions (Fig. 3 and S5 in the ESI†).6,55In contrast3was found
to be emissive in water (Fig. S6 in the ESI†). The ground state infrared spectrum of each complex was also recorded in both CD3CN and D2O solution (Fig. 4 (GS-IR)). These IR spectra clearly show distinct vibrations for the dppz (1325–1375 cm1) and phen (1400–1450 cm1) ligands. Moreover these measure-ments do not reveal any signicant solvent effects on the posi-tion or intensity of the vibraposi-tional bands.
Fig. 1 The chemical structure of1,2and 3showing ring lettering codes used to describe the dppz ligand.
Fig. 2 The molecular structure of L- andD-1 obtained by single crystal X-ray diffraction (ESI†) (PF6counterions and solvent mole-cules are omitted for clarity–see the ESI†for full structure; ellipsoids are shown at 50% probability).
Open Access Article. Published on 27 January 2016. Downloaded on 05/01/2017 08:42:34.
This article is licensed under a
[image:2.595.51.284.48.246.2] [image:2.595.306.551.587.679.2]Time-resolved infrared studies
TRIR difference spectra of complexes1–3, which were recorded in the mid infrared (1260–1650 cm1) on the picosecond
timescale aer excitation with a 50 fs 400 nm pulse, are shown in Fig. 4. These present the IR spectrum of the excited state minus that of the ground state and this spectral region probes the aromatic ring breathing modes of the complexes.56 The
spectra shown in Fig. 4 were recorded aer 35 ps as at earlier times (less than 20 ps) they are expected to be inuenced by vibrational relaxation and other inter-state processes.31–42
The bands of the ground state appear as negative‘bleach’ peaks (for1in CD3CN these are found at 1361, 1430 and 1492 cm1). New transient (positive) absorption bands, arising from vibrations of the excited state, are also observed. For1in CD3CN a strong and broad band at 1396 cm1is evident (shown within the yellow box in Fig. 4a). By contrast the TRIR spectrum of1 recorded in D2O shows three prominent sharp transient bands at 1290, 1321 and 1345 cm1(blue box in Fig. 4a), while the strong broad transient at 1396 cm1found in CD3CN is absent. In both solvents a strong sharp transient band at 1518 cm1is present.
To aid in the assignment of the key features observed in the TRIR spectra of 1, analogous spectra of the homoleptic complexes 2 and 3 were also recorded (Fig. 4b and c). As mentioned above, the tris(dppz) complex 2 exhibits similar solvent dependent luminescence behaviour to1,55whereas the
tris(phen) complex 3 is luminescent in both organic and aqueous solution. The TRIR spectra of2contain a distinctive broad transient band at 1396 cm1in CD3CN and three sharp transient bands at 1290, 1321 and 1345 cm1in D2O, behaviour Fig. 3 UV/Vis absorption and emission spectra (lex¼410 nm) of1(3.0
mM) in (a) CH3CN and (b) H2O, showing the solvent dependent lumi-nescence of1. The excitation wavelength for the TRIR experiments is also highlighted.
Fig. 4 Time-resolved infrared (TRIR) spectra recorded 35 ps after 400 nm excitation of1$2PF6(500mM),2$2PF6(500mM) and3$2Cl(500mM) in CD3CN (left column) and of1$2Cl (500mM),2$2Cl (300mM) and3$2Cl (500mM) in D2O (right column) and their corresponding ground state FTIR (GS-IR) spectra. The blue and yellow coloured regions highlight the characteristic transient bands for the“bright”and“dark”excited states. (a–c) refer to the TRIR spectra of complex1,2and3in both solvents.
Open Access Article. Published on 27 January 2016. Downloaded on 05/01/2017 08:42:34.
This article is licensed under a
[image:3.595.49.285.51.272.2] [image:3.595.48.546.396.680.2]similar to that observed in the TRIR of1. For3the TRIR spectra are closely similar in both solvents. This is expected as3does not show a light-switch effect. The sharp bands found in D2O for 1and2are notably absent for3, and while3in CD3CN does show a broad band at about 1390 cm1, it is markedly lower in intensity than is found for 1 or 2. These ndings strongly suggest that the bands in1are associated with the dppz ligand and may be used as distinct marker bands for the“bright”and “dark”excited states of1. A strong transient band at 1500 cm1 is observed for 2 in both CD3CN and D2O, but in the TRIR spectra of 1 the intensity of the equivalent band is greatly reduced and it is only observed as a shoulder in CD3CN and as a very weak band in D2O. The sharp transient band at 1518 cm1 seen in the TRIR spectra of1in both solvents is also present in the spectrum of the tris(phen) complex3, but is absent from that of2. This suggests that this vibration originates from the ancillary phen ligands. This band, as well as the other weak transient bands seen in the TRIR spectrum of3are consistent with those previously reported by step-scan time-resolved IR measurement, although their relative intensities are different.57‡
Kinetic analysis of theve major transient bands in the TRIR spectrum of1in D2O, as well as the bleach at 1361 cm1, yielded an excited-state lifetime of 630 (30) ps (see Fig. 5). This conrms that all bands in the TRIR spectrum originate from a single species in solution, which has a similar lifetime to that previously determined by transient absorption measurements, where it was also shown that the lifetime in D2O is more than twice that in H2O.31 The lifetime of the excited state of1 in
CD3CN was too long to be measured using the current ps-TRIR experimental set-up. The lifetime of2in D2O was determined to be 1400 ps.
Computational analysis
The differences in the TRIR spectra of1indicate that there must be signicant and distinct changes to the electron distribution in the dppz ligand of the excited states in the two solvents. To explore the origin of these changes in the TRIR spectrum the spectra were simulated using computational methods. Previous researchers have proposed that the “dark” state in aqueous
solution is one in which water molecules bind to the N-atoms of the phenazine (ring D), producing an excited state which rapidly undergoes non-radiative deactivation.3,23–42 To determine
whether such species would have the characteristic spectra observed in the above TRIR experiments, the lowest energy triplet states of1and1$2(D2O) were modelled using a hybrid density functional method (B3LYP for singlet species and UB3LYP for triplet)58–61 and a double zeta quality basis set§
(LanL2DZ)62–66 as implemented in the Gaussian 09 (Revision
D.01) program suite. Corrections for solvents were applied using the Polarisable Continuum Model (PCM).67To simulate
the IR spectra measured in D2O, calculations were performed using the PCM model for bulk water but with the complex 1$2(D2O), where two D2O molecules are hydrogen-bonded to the phenazine N atoms (ring D) of the dppz ligand (full details of these calculations are presented in the ESI†).
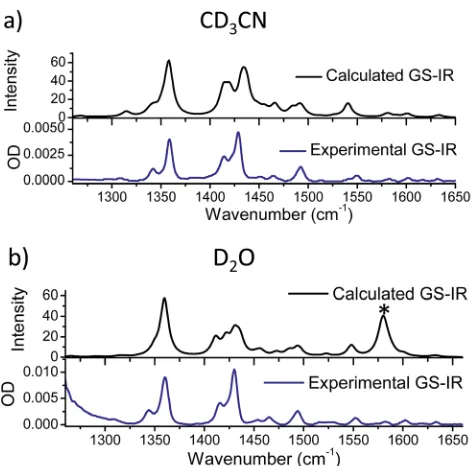
Using these methods the optimised geometry of the ground state of1was found to be in good agreement with the experi-mentally obtained values from X-ray diffraction studies (Table S6 in the ESI†). The infrared spectra of both the ground state in acetonitrile and water were simulated and found to reproduce well the principal features of the FTIR spectra, shown in Fig. 6, indicating that the calculations effectively modelled the ground electronic state of1. The calculated change in electron density distribution between the ground state and the lowest triplet state was found to be quite different between the species in acetonitrile and in water. In acetonitrile an increase in electron density was observed on the phenanthroline portion of the dppz (rings A–C), while in water, it increased more on the phenazine portion of the dppz ligand (rings C–E) (Fig. 7A), which is consistent with previous researchers.29,34
Fig. 5 ps-TRIR (lex¼400 nm) decay kinetics of the transient bands at 1290, 1321, 1344, 1437 and 1518 cm1and bleach at 1361 cm1of1$2Cl (500mM) in D2O.
Fig. 6 Comparison of the calculated ground state IR spectrum of 1 in (a) acetonitrile and (b) water with the FTIR spectrum of the complex in CD3CN and D2O at 1 mM, respectively (*see footnote{).
Open Access Article. Published on 27 January 2016. Downloaded on 05/01/2017 08:42:34.
This article is licensed under a
[image:4.595.310.546.46.279.2] [image:4.595.45.288.556.691.2]A decrease in electron density on the Ru metal centre was also observed in both cases, which indicated that the triplet lowest excited states in both solvents have substantial metal-to-ligand charge-transfer character, with additional small contri-butions from a purely dppz ligand-centred transition.19–22
Next a calculated IR difference spectrum in each solvent was generated by subtracting the calculated (singlet) ground state IR spectrum from the lowest energy triplet state. These difference spectra were found to be solvent dependent and contained the characteristic features of the experimental TRIR spectra (Fig. 7a and S11 in the ESI†). In particular, the broad band observed at 1396 cm1 in CD3CN is observed in the simulated spectrum, while a structured spectrum at lower wavenumber is predicted in D2O. The intensity of the strong ancillary phen-based 1518 cm1transient band observed in the TRIR spectra of1in both solvents was found to be underestimated in the calculated IR difference spectra. However weak bands observed in the calcu-lated IR spectra in both CD3CN and D2O were indeed found to correspond to vibrations localised on the ancillary phen ligands.
The nature of the major vibrational modes (at 1396 cm1in CD3CN and 1321 cm1in D2O) which represent characteristic “bright” and “dark” state marker bands are illustrated in Fig. 7b. Both of these modes were found to correspond to vibrations predominantly localised on the dppz ligand. Inter-estingly, in aqueous media the dppz-based mode of vibration at 1321 cm1 was found to be coupled with the two hydrogen bonding D2O molecules (see Animation 2 in the ESI†). It could be envisaged that this strong coupling between vibrational modes of1and the D2O molecules could allow direct access to the vibrational states of the bulk solvent, thus providing the
possible mechanism of the light-switch effect. By efficient transfer of excess energy to the bulk solvent,1rapidly returns back to the ground state (630 ps in D2O and 250 ps in H2O). This hypothesis was further investigated by modelling the complex viacalculations with added H2O or D2O molecules, fourteen in total, two clusters of seven water molecules, one on each side of the dppz ligand. These clusters were constructed to model the behaviour of bulk water through hydrogen bonds with the phenazine nitrogen atoms. The clusters were limited to seven water molecules because as the cluster size increased the potential energy wells in which the water molecules sit on the hypersurface become more shallow, causing difficulty in opti-mising the geometry of the complex-cluster system. The remote water molecules in the clusters tend to exhibit small imaginary vibrations (negative eigenvalues of the Hessian matrix) re ect-ing the difficulty in locatect-ing the minimum energy structure. Notwithstanding these difficulties the eigenvalues of the Hessian matrix (constructed by the second derivative of the energy along all the vibrational degrees of freedom) which involve in-plane displacements of atoms in the dppz ligand also involve displacements of the atoms in the water clusters. This indicates that vibrations of the dppz ligand can couple with vibrations of remote water (either H2O or D2O) molecules in the clusters (see Animation 3-D2O cluster and Animation 4-H2O cluster in the ESI†).
TRIR investigation with DNA
To ascertain whether these solvent results are pertinent to the behaviour in DNA the TRIR spectra of theDandLenantiomers of 1 bound to a DNA decamer duplex of sequence (TCGGCGCCGA)2 were also measured.68Of particular interest
Fig. 7 (a) Simulated difference spectra compared with the experimental TRIR spectra of1in acetonitrile (left column); and1$2(D2O) in water (right column). In the experimental spectra, wavenumbers below 1250 cm1were inaccessible due to strong absorbance of both solvents in this region. Structural inserts show electron density difference map (iso level 0.0008) between the lowest energy triplet state of 1 minus the electron density of the equivalent singlet ground-state at the same geometry in acetonitrile (left hand side) and for1$2(D2O) in water (right hand side) (the red and blue volumes indicate the regions where the electron density is respectively higher and lower in the triplet state compared to the ground state); (b) graphical illustration of the in-plane vibrational modes of the marker bands of the“bright”and“dark”: states of1at 1396 cm1in CD
3CN and 1321 cm1in D
2O (marked with asterisks in the spectra). Red ellipsoids indicate the regions of largest atomic displacement. Animations of these vibrations can be found online in the ESI†(Animation 1-CD3CN and Animation 2-D2O).
Open Access Article. Published on 27 January 2016. Downloaded on 05/01/2017 08:42:34.
This article is licensed under a
[image:5.595.52.544.450.640.2]were (i) if the marker bands of the“bright”state in CD3CN are also apparent in the“bright”state when bound to DNA and (ii) if there are differences between the TRIR spectra of the two enantiomers when bound to DNA. These TRIR spectra of 1 (Fig. 8c) show features similar to those found in CD3CN solution –particularly the broad transient band at 1396 cm1and the notable absence of the three sharp bands found at lower wavenumbers when recorded in D2O. This is consistent with protection of the dppz ligand of both enantiomers from the aqueous solvent upon intercalation of the complex in the DNA decamer duplex. Interestingly the transient band attributed to the ancillary phen ligand (at 1518 cm1) is signicantly more intense than the dppz-based broad transient absorption at 1396 cm1. This relative weakening of the intensity of the dppz bands upon intercalation is consistent with suppression of the ring vibrations of the dppz ligand uponp-stacking with the aromatic DNA bases, which is in accordance with previous IR studies.69
On the other hand the ancillary phen ligands of1are located in the DNA groove and therefore would not be expected to be dampened.68,70,71 No signicant differences were observed
between the TRIR spectra of the two enantiomers of1 when bound to DNA. This suggests that the different orientation of the two enantiomers when intercalated into DNA, as indicated by solution studies and our recent crystal structure, do not strongly affect the TRIR spectrum of1.4–6,70,72It is interesting to
note that, based on the calculations above, in order for the dark state to form, the complex must be H-bonded to water mole-cules and be in an aqueous medium. However, while interca-lated between the DNA base pairs the complex experiences an
organic environment and therefore the dark state should not form, even if one binding mode leaves the nitrogens of the dppz exposed to water coordination. At higher wavenumbers (1600– 1700 cm1, shown within the green box in Fig. 8c), strong bleaching is noted in the TRIR spectra. In this region the DNA nucleobases absorb strongly but the complex does not (Fig. 8a and b).51,73Two particularly strong bleach bands are observed at
1680 and 1648 cm1, which correspond to the frequencies of the guanine and cytosine carbonyl stretches.73 Similar behaviour
has also been seen in the [Ru(TAP)2(dppz)]2+analogue (TAP¼ 1,4,5,8-tetraazaphenanthrene),43,74,75 and for a number of
substituted dppz complexes of rhenium when intercalated into DNA.50,76 As DNA is not excited at 400 nm and 1 does not
undergo efficient electron transfer with DNA in the picosecond time range,77 the presence of these bands is attributed to
perturbation of the base pairs' vibrations at the site of interca-lation of 1. This perturbation possibly arises from an electro-static (Stark) effect caused by the change in electron density of the metal complex upon photo-excitation.78,79 Of particular
interest here is the strong difference of the signals in the DNA region of the TRIR spectrum induced by the enantiomers of1 (racemic-1shows intermediate behaviour–see Fig. S13 in the ESI†). In particular the bleach of the guanine-localised band at 1680 cm1 is much stronger for theL-complex than the D, which indicates that the guanine nucleotide is more perturbed by this optical enantiomer. It is expected that the enantiomers will show different preferences for binding to the various sites in the duplex DNA and that even if they do intercalate at the same site there may be a different orientation of the dppz group.
Fig. 8 TRIR spectra recorded 35 ps after 400 nm excitation of (a)1$2Cl(500mM) in D2O, (b)1$2PF6(500mM) in CD3CN and (c)D- andL-[1] 2Cl (400 mM) and a duplex DNA oligonucleotide d(TCGGCGCCGA)2 (500 mM duplex) and (d) FTIR spectrum of oligonucleotide d(TCGGCGCCGA)2(500mM duplex) in deuterated potassium phosphate buffer (50 mM) pH 7. The blue and yellow coloured regions highlight the characteristic transient bands for the excited state of1, while the green coloured region highlights the bands associated with the DNA base pairs.
Open Access Article. Published on 27 January 2016. Downloaded on 05/01/2017 08:42:34.
This article is licensed under a
[image:6.595.69.521.413.681.2]Other studies suggest, for example, that theL-complexes have a preference for pyr$pur/pyr$pur or pur$pur/pyr$pyr steps.71,74
For these latter steps crystal structures and molecular model-ling show that L-1 is more strongly angled (canted) in the intercalation pocket,71,80which affords greater overlap with the
purine base (Fig. 9). Therefore binding of a signicant fraction of theL-enantiomer at the G3G4/C7C8step would be consistent with these results. However further studies with a range of sequences will be required to determine denitively the exact origin of this effect.
Conclusions
The ps-TRIR spectra of1in CD3CN and D2O show strikingly different features, presenting characteristic vibrational marker bands allowing direct identication of both the emissive “bright”and non-emissive“dark”excited states in solution. The vibrations responsible for these bands were found to originate on the dppz ligand of the complex. DFT calculations suggest that these spectral features can only be accounted for by an explicit treatment which takes account of both solvent polarity and the inclusion of two D2O molecules H-bonded to the nitrogens of the phenazine moiety. Our results strongly suggest that the coupling of the modes of vibration of these H-bonded D2O molecules facilitate deactivation of the excited state by more efficient transfer of energy to the bulk water resulting in the extremely short lifetime of the excited state in aqueous media. The spectral features of the“bright”excited state were observed for bothD- andL-enantiomers of1when bound to duplex DNA. Moreover, a very signicant difference in the interaction of the complexes was observed by TRIR in the spectral region where the nucleobases absorb. This demon-strates that TRIR may prove to be a very valuable technique for determining the identity and nature of the binding site for molecules binding to mixed sequence duplex DNA. The TRIR method may also be useful for probing non-canonical
structures of nucleic acids53,81,82 and for other biomolecules
such as those found in Alzheimer plaques.83
Experimental
Materials and methods
Complexes1,2, and3were synthesised as their Cl and PF6salts by modied literature procedures (see ESI†for details).6,16,52 All
chemicals were obtained from Sigma-Aldrich, Alfa Aesar or TCI and unless specied, were used without further purication. Prior to use the Amberlite IRA-400 (chloride form) resin was soaked in methanol (HPLC) and washed thoroughly with fresh methanol and water. The resin was then subjected to one regeneration cycle where the beads were washed with NaOH (0.1 M) and then with water until the washings ran neutral. The beads were then washed with HCl (0.1 M) and water until the washings were neutral. Deuterated solvents for NMR use were purchased from Apollo Ltd. Analytical TLC was performed using Merck Kieselgel 60 F254 silica gel plates. Chromatographic columns were run using silica gel 60 (230–400 mesh ASTM). NMR spectra were recorded using an AV-700, AV-600 or DPX400 spectrometer, operating at 700, 600.1 or 400 MHz respectively for1H NMR and 176 or 150.6 MHz respectively for13C NMR. Shis are referenced relative to the internal solvent signals. Mass spectra were recor-ded on a MALDI QToF Premier, running Mass Lynx NT V 3.4 on a Waters 600 controller connected to a 996 photodiode array detector with HPLC-grade methanol or acetonitrile. High reso-lution mass spectra were determined by a peak matching method, using glu-b, as the standard reference (m/z ¼ 1570.677). All accurate masses were reported within5 ppm. Infrared spectra were recorded on a Perkin Elmer Spectrum One FT-IR spectrometertted with a Universal ATR Sampling Acces-sory for solid samples or N2ushed Transmission Accessory for liquid samples between CaF2plates with an optical path length of 100 or 150mm and at a resolution of 4 cm1and 256 scans.
Diffraction data for1was collected on a Bruker APEX 2 DUO CCD diffractometer using graphite-monochromatised Incoatec ImS MoKa(l¼0.71073A) radiation. Crystals were mounted in a cryoloop/MiTeGen micromount and collected at 100(2) K using an Oxford Cryosystems Cobra low temperature device. Data were collected using omega and phi scans and were cor-rected for Lorentz and polarisation effects,84and a multiscan
absorption correction was carried out.85 The structure was
solved using direct methods and rened by full-matrix least-squares procedures onF2using SHELXL 2013 (ref. 86) within the OLEX2 soware package.87 Hydrogen atoms were added
geometrically in calculated positions and rened using a riding model. Slight crystallographic disorder was detected on the lattice acetonitrile molecule C502–C501–N501, which was modelled across two half-occupancy orientations with a PART-1 command to prevent incorrect connectivity, and an isotropic approximation restraint was used on the terminal methyl carbon atom C502 to maintain sensible anisotropic displace-ment parameters (see ESI†).
The oligonucleotide d(TCGGCGCCGA) was synthesised by ATDBio Ltd (Southampton, UK). The sequence was desalted and puried by gel ltration. An extinction coefficient of Fig. 9 (a) Angled intercalation byL-1into the terminal CC/GG step in
d(CCGGATCCGG).71Note that the dppz is located under the purine (guanine) bases. Bases are coloured according to atom type with nitrogen in blue, oxygen in red, hydrogen in white and phosphorus in orange. Carbon atoms are cyan for guanine, yellow for cytosine and green forL-1; (b) a hypothetical model of an angled CC/GG interca-lation site forD-1, constructed by direct manipulation of the crystal structure, to illustrate the difference in binding if the dppz group were directed further towards the pyrimidine bases (cyan). Purine bases are drawn in cyan; (c) schematic diagram of the binding ofL-1at the G3G4/C7C8step.
Open Access Article. Published on 27 January 2016. Downloaded on 05/01/2017 08:42:34.
This article is licensed under a
[image:7.595.47.288.500.611.2]163 000 M1cm1(duplex) at 260 nm was used for concentration determination.
Transient spectroscopy methods
ps-TRIR measurements were performed on the ULTRA apparatus at the Central Laser Facility (STFC Rutherford Appleton Labora-tories, Harwell, UK). The time-resolved IR (TRIR) spectrometer comprises of a 10 kHz repetition rate titanium sapphire dual output amplier (Thales), producing 0.8 mJ output with 40 fs pulse duration, at 800 nm. Optical parametric ampliers (Light Conversion, TOPAS) and second harmonic generation of the 800 nm beam created the mid-infrared radiation and 400 nm femto-second pump pulses, respectively, used in these experiments. The polarisation of the pump pulses at the sample were at the magic angle relative to the probe, with an energy of 1mJ. The IR probe beam was split to form reference and probe beams which were passed through spectrographs onto MCT array detectors (IR Associates). The 400 nm pump beam was mechanically chopped down to 5 kHz, focused (100mm spot sizes) and overlapped with the probe beam (50mm spot size) in the sample cell. High speed data acquisition systems (Quantum Detectors) allowed 10 kHz acquisition and processing of the probe and reference pulses to generate a pump-on pump-off infrared absorption difference signal. The temporal resolution in the ps-TRIR experiments is estimated to be about 150 fs. The TRIR spectra were calibrated using the characteristic polystyrene absorption lines.
Samples for ps-TRIR and FTIR were loaded into a demountable solution IR cell (Harrick Scientic Products Inc., New York)tted with 25 mm diameter CaF2windows (Crystran Ltd, UK), separated by Teon spacers of 50 or 100 mm path length, as follows: (i) solutions of [1]$2Cl (500mM), [2]$2Cl (300mM) or [3]$2Cl (500mM) in D2O (35mL) were dropped between the CaF2windows ([2]$2Cl was found to have limited solubility in D2O, saturation atca.440 mM, therefore its concentration was kept at 300mM for experi-ments). (ii) Solutions of [1]$2PF6(500mM), [2]$2PF6(500mM) and [3]$2Cl (500mM) in CD3CN (500mL) were injected between two windows; (iii) solutions ofD–1$2Cl or L-1$2Cl. (400mM) in the presence of d(TCGGCGCCGA) (1 mM single stranded) in potas-sium phosphate buffer (50 mM, pH 7) in D2O were dropped between two CaF2 windows. Samples for ps-TRIR experiments were raster scanned in thexandydirections to minimise photo-damage and re-excitation effects. All experiments were carried out at room temperature (ca.19C). Samples were checked before and aer the experiment by UV/vis spectroscopy to ensure no sample decomposition was occurring. To obtain the kinetics of a transient band or depletion, a subtraction of theDOD value at a nearby wavenumber showing no transient bands or depletions was per-formed from the wavenumber of interest. This was done in order to account for any baselineuctuations during the experiment.
Acknowledgements
The authors wish to acknowledgenancial support by a Royal Irish Academy/Royal Society International Exchange Scheme award (to CJC, JMK and TG); the STFC for programme access to the CLF (APP13230047); the Irish Research Council (Ph.D
studentship to FEP, grant RS/2011/580); Science Foundation Ireland SFI PI 2010 (10/IN.1/B2999)/PI 2013 (13/IA/1865) (TG); the BBSRC–grants BB/K019279/1 and BB/M004635/1 (to CJC, MT and JPH); the College of Science, UCD (SJQ); and the DJEI/ DES/SFI/HEA Irish Centre for High-End Computing (CL) for the provision of computational facilities and support; and Dr Sal-vador Blasco for discussions regarding crystallography and Dr Manuel Ruether for help with FTIR measurements.
Notes and references
‡In the current study, the TRIR spectral features of the tris(phen) complex3were the same irrespective of excitation wavelength (lex¼400 or 355 nm) or time (between 35 ps and 1000 ns) (Fig. S7 and S8 in the ESI†). This indicates that the differences observed are not due to different electronic excited states of3in the two studies. It may be noted that the concentration of3is signicantly lower in the current study. This might be a reason for the discrepancy. However, this variation could also arise due to the different experimental techniques used in the two studies.
§Similar results were obtained with the triple zeta potential; however, due to computational cost IR spectra had to be calculated using the double zeta potential model.
{The calculated band at 1580 cm1in D2O is composed of a number of O–D–O bending modes. In these calculations the bulk water was not modelled and therefore differences between the calculated and experimental O–D vibrations are to be expected.
1 J.-C. Chambron, J.-P. Sauvage, E. Amouyal and P. Koffi,Nouv. J. Chim., 1985,9, 527–529.
2 A. E. Friedman, J. C. Chambron, J. P. Sauvage, N. J. Turro and J. K. Barton,J. Am. Chem. Soc., 1990,112, 4960–4962. 3 A. W. McKinley, P. Lincoln and E. M. Tuite,Dalton Trans.,
2013,42, 4081–4090.
4 R. M. Hartshorn and J. K. Barton,J. Am. Chem. Soc., 1992, 114, 5919–5925.
5 Y. Jenkins, A. E. Friedman, N. J. Turro and J. K. Barton, Biochemistry, 1992,31, 10809–10816.
6 C. Hiort, P. Lincoln and B. Nord´en,J. Am. Chem. Soc., 1993, 115, 3448–3454.
7 M. R. Gill and J. A. Thomas,Chem. Soc. Rev., 2012,41, 3179– 3192.
8 M. R. Gill, J. Garcia-Lara, S. J. Foster, C. Smythe, G. Battaglia and J. A. Thomas,Nat. Chem., 2009,1, 662–667.
9 E. Baggaley, M. R. Gill, N. H. Green, D. Turton, I. V. Sazanovich, S. W. Botchway, C. Smythe, J. W. Haycock, J. A. Weinstein and J. A. Thomas, Angew. Chem., Int. Ed., 2014,53, 3367–3371.
10 G.-B. Jiang, Y.-Y. Xie, G.-J. Lin, H.-L. Huang, Z.-H. Liang and Y.-J. Liu,J. Photochem. Photobiol., B, 2013,129, 48–56. 11 N. Deepika, Y. P. Kumar, C. Shobha Devi, P. V. Reddy,
A. Srishailam and S. Satyanarayana, JBIC, J. Biol. Inorg. Chem., 2013,18, 751–766.
12 F. R. Svensson, M. Abrahamsson, N. Str¨omberg, A. G. Ewing and P. Lincoln,J. Phys. Chem. Lett., 2011,2, 397–401. 13 F. R. Svensson, M. Matson, M. Li and P. Lincoln, Biophys.
Chem., 2010,149, 102–106.
14 B.-J. Han, G.-B. Jiang, J.-H. Yao, W. Li, J. Wang, H.-L. Huang and Y.-J. Liu,Spectrochim. Acta, Part A, 2015,135, 840–849.
Open Access Article. Published on 27 January 2016. Downloaded on 05/01/2017 08:42:34.
This article is licensed under a
15 T. Joshi, V. Pierroz, C. Mari, L. Gemperle, S. Ferrari and G. Gasser,Angew. Chem., Int. Ed., 2014,53, 2960–2963. 16 S. M. Cloonan, R. B. P. Elmes, M. Erby, S. A. Bright,
F. E. Poynton, D. E. Nolan, S. J. Quinn, T. Gunnlaugsson and D. C. Williams,J. Med. Chem., 2015,58, 4494–4505. 17 G. J. Ryan, F. E. Poynton, R. B. P. Elmes, M. Erby,
D. C. Williams, S. J. Quinn and T. Gunnlaugsson, Dalton Trans., 2015,44, 16332–16344.
18 C. Mari, V. Pierroz, R. Rubbiani, M. Patra, J. Hess, B. Spingler, L. Oehninger, J. Schur, I. Ott, L. Salassa, S. Ferrari and G. Gasser, Chem.–Eur. J., 2014, 20, 14421– 14436.
19 G. Pourtois, D. Beljonne, C. Moucheron, S. Schumm, A. Kirsch-De Mesmaeker, R. Lazzaroni and J.-L. Br´edas,J. Am. Chem. Soc., 2004,126, 683–692.
20 C. Daniel,Coord. Chem. Rev., 2015,282–283, 19–32. 21 T. V´ery, D. Ambrosek, M. Otsuka, C. Gourlaouen, X. Assfeld,
A. Monari and C. Daniel, Chem.–Eur. J., 2014, 20, 12901– 12909.
22 X. Gao, S. Shi, J.-L. Yao, J. Zhao and T.-M. Yao,Dalton Trans., 2015,44, 19264–19274.
23 C. Turro, S. H. Bossmann, Y. Jenkins, J. K. Barton and N. J. Turro,J. Am. Chem. Soc., 1995,117, 9026–9032. 24 R. B. Nair, B. M. Cullum and C. J. Murphy,Inorg. Chem.,
1997,36, 962–965.
25 B. ¨Onfelt, J. Olofsson, P. Lincoln and B. Nord´en, J. Phys. Chem. A, 2003,107, 1000–1009.
26 M. K. Brennaman, T. J. Meyer and J. M. Papanikolas,J. Phys. Chem. A, 2004,108, 9938–9944.
27 E. Sabatani, H. D. Nikol, H. B. Gray and F. C. Anson,J. Am. Chem. Soc., 1996,118, 1158–1163.
28 M. K. Brennaman, J. H. Alstrum-Acevedo, C. N. Fleming, P. Jang, T. J. Meyer and J. M. Papanikolas, J. Am. Chem. Soc., 2002,124, 15094–15098.
29 J. Olofsson, B. ¨Onfelt and P. Lincoln,J. Phys. Chem. A, 2004, 108, 4391–4398.
30 J.-C. Chambron and J.-P. Sauvage,Chem. Phys. Lett., 1991, 182, 603–607.
31 E. J. C. Olson, D. Hu, A. H¨ormann, A. M. Jonkman, M. R. Arkin, E. D. A. Stemp, J. K. Barton and P. F. Barbara, J. Am. Chem. Soc., 1997,119, 11458–11467.
32 B. ¨Onfelt, P. Lincoln, B. Nord´en, J. S. Baskin and A. H. Zewail, Proc. Natl. Acad. Sci. U. S. A., 2000,97, 5708–5713.
33 L. Ujj, C. G. Coates, J. M. Kelly, P. E. Kruger, J. J. McGarvey and G. H. Atkinson,J. Phys. Chem. B, 2002,106, 4854–4862. 34 A. W. McKinley, P. Lincoln and E. M. Tuite,Coord. Chem.
Rev., 2011,255, 2676–2692.
35 C. G. Coates, L. Jacquet, J. J. McGarvey, S. E. J. Bell, A. H. R. Al-Obaidi and J. M. Kelly,J. Am. Chem. Soc., 1997, 119, 7130–7136.
36 W. Chen, C. Turro, L. A. Friedman, J. K. Barton and N. J. Turro,J. Phys. Chem. B, 1997,101, 6995–7000.
37 C. G. Coates, J. Olofsson, M. Coletti, J. J. McGarvey, B. ¨Onfelt, P. Lincoln, B. Norden, E. Tuite, P. Matousek and A. W. Parker,J. Phys. Chem. B, 2001,105, 12653–12664.
38 J. Olofsson, B. ¨Onfelt, P. Lincoln, B. Nord´en, P. Matousek, A. W. Parker and E. Tuite,J. Inorg. Biochem., 2002,91, 286– 297.
39 W. R. Browne and J. J. McGarvey,Coord. Chem. Rev., 2006, 250, 1696–1709.
40 J. R. Schoonover, W. D. Bates and T. J. Meyer,Inorg. Chem., 1995,34, 6421–6422.
41 A. C. Benniston, P. Matousek and A. W. Parker, J. Raman Spectrosc., 2000,31, 503–507.
42 C. G. Coates, P. L. Callaghan, J. J. McGarvey, J. M. Kelly, P. E. Kruger and M. E. Higgins,J. Raman Spectrosc., 2000, 31, 283–288.
43 J. P. Hall, F. E. Poynton, P. M. Keane, S. P. Gurung, J. A. Brazier, D. J. Cardin, G. Winter, T. Gunnlaugsson, I. V. Sazanovich, M. Towrie, C. J. Cardin, J. M. Kelly and S. J. Quinn,Nat. Chem., 2015,7, 961–967.
44 D. B. Bucher, B. M. Pilles, T. Carell and W. Zinth,Proc. Natl. Acad. Sci. U. S. A., 2014,111, 4369–4374.
45 W. J. Schreier, T. E. Schrader, F. O. Koller, P. Gilch, C. E. Crespo-Hern´andez, V. N. Swaminathan, T. Carell, W. Zinth and B. Kohler,Science, 2007,315, 625–629. 46 A. W. Parker, C. Y. Lin, M. W. George, M. Towrie and
M. K. Kuimova,J. Phys. Chem. B, 2010,114, 3660–3667. 47 P. M. Keane, F. E. Poynton, J. P. Hall, I. V. Sazanovich,
M. Towrie, T. Gunnlaugsson, S. J. Quinn, C. J. Cardin and J. M. Kelly,Angew. Chem., Int. Ed., 2015,54, 8364–8368. 48 M. Delor, T. Keane, P. A. Scattergood, I. V. Sazanovich,
G. M. Greetham, M. Towrie, A. J. H. M. Meijer and J. A. Weinstein,Nat. Chem., 2015,7, 689–695.
49 M. Delor, P. A. Scattergood, I. V. Sazanovich, A. W. Parker, G. M. Greetham, A. J. H. M. Meijer, M. Towrie and J. A. Weinstein,Science, 2014,346, 1492–1495.
50 E. D. Olmon, P. A. Sontz, A. M. Blanco-Rodr´ıguez, M. Towrie, I. P. Clark, A. Vlˇcek and J. K. Barton,J. Am. Chem. Soc., 2011, 133, 13718–13730.
51 M. Towrie, G. W. Doorley, M. W. George, A. W. Parker, S. J. Quinn and J. M. Kelly,Analyst, 2009,134, 1265–1273. 52 S. Rau, B. Sch¨afer, A. Gr¨ußing, S. Schebesta, K. Lamm,
J. Vieth, H. G¨orls, D. Walther, M. Rudolph, U. W. Grummt and E. Birkner,Inorg. Chim. Acta, 2004,357, 4496–4503. 53 E. Wachter, B. S. Howerton, E. C. Hall, S. Parkin and
E. C. Glazer,Chem. Commun., 2014,50, 311–313.
54 S. Finck, J.-T. Issenhuth, S. Despax, C. Sirlin, M. Pfeffer, C. Poidevin, C. Gourlaouen, A. Boeglin and C. Daniel, J. Organomet. Chem., 2014,760, 248–259.
55 X. He, L. Jin and L. Tan,Spectrochim. Acta, Part A, 2015,135, 101–109.
56 B. C. Smith, Infrared Spectral Interpretation: A Systematic Approach, Taylor & Francis, 1998.
57 K. M. Omberg, J. R. Schoonover, S. Bernhard, J. A. Moss, J. A. Treadway, E. M. Kober, R. B. Dyer and T. J. Meyer, Inorg. Chem., 1998,37, 3505–3508.
58 W. Yang, R. G. Parr and C. Lee,Phys. Rev. A: At., Mol., Opt. Phys., 1986,34, 4586–4590.
59 A. D. Becke,Phys. Rev. A: At., Mol., Opt. Phys., 1988,38, 3098– 3100.
Open Access Article. Published on 27 January 2016. Downloaded on 05/01/2017 08:42:34.
This article is licensed under a
60 R. C. Morrison, W. Yang, R. G. Parr and C. Lee, Int. J. Quantum Chem., 1990,38, 819–830.
61 A. D. Becke,J. Chem. Phys., 1993,98, 5648–5652.
62 T. Dunning, P. Hay and H. Schaefer III,Modern Theoretical Chemistry: Applications of Electronic Structure Theory, Plenum, New York, 1977, vol. 4.
63 W. R. Wadt and P. J. Hay,J. Chem. Phys., 1985,82, 284–298. 64 P. J. Hay and W. R. Wadt,J. Chem. Phys., 1985,82, 299–310. 65 P. J. Hay and W. R. Wadt,J. Chem. Phys., 1985,82, 270–283. 66 M. J. Frisch, G. W. Trucks, H. B. Schlegel, G. E. Scuseria, M. A. Robb, J. R. Cheeseman, G. Scalmani, V. Barone, B. Mennucci and G. A. Petersson, et al., Gaussian, Inc., Wallingford, CT, USA, 2009.
67 J. Tomasi, B. Mennucci and R. Cammi, Chem. Rev., 2005, 105, 2999–3093.
68 J. P. Hall, K. O'Sullivan, A. Naseer, J. A. Smith, J. M. Kelly and C. J. Cardin,Proc. Natl. Acad. Sci. U. S. A., 2011,108, 17610– 17614.
69 A. A. Maevsky and B. I. Sukhorukov,Nucleic Acids Res., 1980, 8, 3029–3042.
70 J. P. Hall, D. Cook, S. R. Morte, P. McIntyre, K. Buchner, H. Beer, D. J. Cardin, J. A. Brazier, G. Winter, J. M. Kelly and C. J. Cardin,J. Am. Chem. Soc., 2013,135, 12652–12659. 71 H. Niyazi, J. P. Hall, K. O'Sullivan, G. Winter, T. Sorensen, J. M. Kelly and C. J. Cardin,Nat. Chem., 2012,4, 621–628. 72 J. Andersson, L. H. Fornander, M. Abrahamsson, E. Tuite,
P. Nordell and P. Lincoln,Inorg. Chem., 2013,52, 1151–1159. 73 M. Banyay, M. Sarkar and A. Gr¨aslund,Biophys. Chem., 2003,
104, 477–488.
74 P. M. Keane, F. E. Poynton, J. P. Hall, I. P. Clark, I. V. Sazanovich, M. Towrie, T. Gunnlaugsson, S. J. Quinn, C. J. Cardin and J. M. Kelly, Faraday Discuss., 2015, 185, 455–469.
75 B. Elias, C. Creely, G. W. Doorley, M. M. Feeney, C. Moucheron, A. Kirsch-De Mesmaeker, J. Dyer, D. C. Grills, M. W. George, P. Matousek, A. W. Parker, M. Towrie and J. M. Kelly,Chem.–Eur. J., 2008,14, 369–375. 76 Q. Cao, C. M. Creely, E. S. Davies, J. Dyer, T. L. Easun, D. C. Grills, D. A. McGovern, J. McMaster, J. Pitchford, J. A. Smith, X.-Z. Sun, J. M. Kelly and M. W. George, Photochem. Photobiol. Sci., 2011,10, 1355–1364.
77 A. W. McKinley, J. Andersson, P. Lincoln and E. M. Tuite, Chem.–Eur. J., 2012,18, 15142–15150.
78 E. S. Park and S. G. Boxer,J. Phys. Chem. B, 2002,106, 5800– 5806.
79 S. D. Fried and S. G. Boxer,Acc. Chem. Res., 2015,48, 998– 1006.
80 P. M. Keane, F. E. Poynton, J. P. Hall, I. P. Clark, I. V. Sazanovich, M. Towrie, T. Gunnlaugsson, S. J. Quinn, C. J. Cardin and J. M. Kelly, J. Phys. Chem. Lett., 2015, 6, 734–738.
81 S. Shi, X. Geng, J. Zhao, T. Yao, C. Wang, D. Yang, L. Zheng and L. Ji,Biochimie, 2010,92, 370–377.
82 E. Wachter, D. Moy´a, S. Parkin and E. C. Glazer,Chem.–Eur. J., 2016,22, 550–559.
83 N. P. Cook, K. Kilpatrick, L. Segatori and A. A. Mart´ı,J. Am. Chem. Soc., 2012,134, 20776–20782.
84 Bruker, APEX v2012.12–0, Bruker AXS Inc., Madison, Wisconsin, USA, 2012.
85 Bruker,SADABS, Bruker AXS Inc., Madison, Wisconsin, USA, 2012.
86 G. Sheldrick, SHELXL-2013, University of G¨ottingen, Germany, 2013.
87 O. V. Dolomanov, L. J. Bourhis, R. J. Gildea, J. A. K. Howard and H. Puschmann,J. Appl. Crystallogr., 2009,42, 339–341.
Open Access Article. Published on 27 January 2016. Downloaded on 05/01/2017 08:42:34.
This article is licensed under a


![Fig. 8TRIR spectra recorded 35 ps after 400 nm excitation of (a)2Cld(TCGGCGCCGA)characteristic transient bands for the excited state of 1$2Cl� (500 mM) in D2O, (b) 1$2PF6� (500 mM) in CD3CN and (c) D- and L-[1]� (400 mM) and a duplex DNA oligonucleotide d(](https://thumb-us.123doks.com/thumbv2/123dok_us/1001432.614698/6.595.69.521.413.681/spectra-recorded-excitation-tcggcgccga-characteristic-transient-excited-oligonucleotide.webp)

