Protein structure and ionic selectivity in calcium channels: Selectivity
fi
lter size,
not shape, matters
Attila Malasics
a, Dirk Gillespie
b, Wolfgang Nonner
c, Douglas Henderson
d, Bob Eisenberg
b, Dezs
ő
Boda
a,d,⁎
aDepartment of Physical Chemistry, University of Pannonia, P. O. Box 158, H-8201 Veszprém, HungarybDepartment of Molecular Biophysics and Physiology, Rush University Medical Center, Chicago, IL 60612, USA c
Department of Physiology and Biophysics, Miller School of Medicine, University of Miami, Miami, FL 33101, USA d
Department of Chemistry and Biochemistry, Brigham Young University, Provo, UT 84602, USA
a b s t r a c t
a r t i c l e i n f o
Article history: Received 5 March 2009
Received in revised form 28 September 2009 Accepted 30 September 2009
Available online 7 October 2009
Keywords: Calcium channel Selectivity Permeation Grand canonical Monte Carlo simulation
Calcium channels have highly charged selectivityfilters (4 COO−groups) that attract cations in to balance this charge and minimize free energy, forcing the cations (Na+and Ca2+) to compete for space in thefilter. A
reduced model was developed to better understand the mechanism of ion selectivity in calcium channels. The charge/space competition (CSC) mechanism implies that Ca2+is more efficient in balancing the charge
of the filter because it provides twice the charge as Na+ while occupying the same space. The CSC
mechanism further implies that the main determinant of Ca2+versus Na+selectivity is the density of
charged particles in the selectivityfilter, i.e., the volume of thefilter (afterfixing the number of charged groups in thefilter). In this paper we test this hypothesis by changingfilter length and/or radius (shape) of the cylindrical selectivityfilter of our reduced model. We show that varying volume and shape together has substantially stronger effects than varying shape alone with volume fixed. Our simulations show the importance of depletion zones of ions in determining channel conductance calculated with the integrated Nernst–Planck equation. We show that confining the protein side chains with soft or hard walls does not influence selectivity.
© 2009 Elsevier B.V. All rights reserved.
1. Introduction
Ion channels control many biological functions from signalling in the nervous system to initiating muscle contraction. These channel proteins form pores that conduct ions down their electrochemical potential gradient across otherwise impermeable membranes of both the cell and the organelles within it. Ion channels can select which ionic species they conduct, with different channel proteins conducting different ionic species. For example, potassium channels conduct K+
and (statistically speaking) exclude Na+. The quite different sodium
channel protein conducts Na+and excludes K+[1].
Another important class of ion channels preferentially conducts Ca2+
compared to monovalent cations like Na+ and K+. A biologically
important subclass of calcium channels are highly Ca2+selective. For example, the L-type calcium channel has a Ca2+affinity of 1μM; in
30 mM Na+as little as 1μM Ca2+reduces the Na+current measured in 0
Ca2+by 50%[2,3]. While the main physiological function of the L-type
calcium channel is to conduct Ca2+in the background of a much higher
concentration of monovalent cations, it also discriminates between ions of the same charge (e.g., Ca2+vs. Ba2+or Na+vs. K+[4]).
The physical mechanism of the selectivity of the L-type calcium channel has often been discussed because of the profound medical importance of the channel. In thefirst theories of permeation, ions were said to“hop” over energy barriers (reviewed by Sather and McCleskey[5], criticized by Eisenberg et al.[6–9]). This kind of helpful but phenomenological description has been replaced by modern theories and computer simulations. Corry et al.[10–12]have studied Ca2+selectivity, but their simulations, using canonical ensembles,
necessarily used Ca2+bath concentrationsN18 mM—10,000 times
larger than the micromolar affinity of the pore. When grand canonical Monte Carlo (MC) simulations were performed using the model of Corry et al.[13]for the L-type calcium channel, they showed only 200μM Ca2+affinity, much less than the natural channel. Just as
significantly, their model cannot distinguish between ions of the same valence, but different size[11,12]even though natural channels can do this.
So far, the theory that best describes experimental properties of calcium channels is the charge/space competition (CSC) mechanism. This theory not only produces micromolar Ca2+affinity for the L-type
calcium channel[14–16] but also describes how different calcium channel subclasses can have the wide range of Ca2+affinities seen in experiments [14]. The CSC model correctly distinguishes between monovalent cations of different size[16–21]. The model uses only a few adjustable parameters to account for the main selectivity ⁎ Corresponding author. Department of Physical Chemistry, University of Pannonia,
P. O. Box 158, H-8201 Veszprém, Hungary. E-mail address:[email protected](D. Boda).
0005-2736/$–see front matter © 2009 Elsevier B.V. All rights reserved.
doi:10.1016/j.bbamem.2009.09.022
Contents lists available atScienceDirect
Biochimica et Biophysica Acta
properties of the calcium channel and its cousin, the sodium channel [22,23].
The CSC mechanism describes ion selectivity in calcium and sodium channels as a balance of the ions' electrostatic attraction into the channel's highly charged selectivityfilter and the ions' excluded volume in the small selectivityfilter that is crowded with ions and protein side chains[14–31]. In this mechanism, selectivity of Ca2+
over monovalent cations increases when the number of cations in the pore increases (with the shape and size of the pore unchanged). It also increases when the radius of the pore decreases. Thus, pore volume is a critical parameter for Ca2+ versus monovalent cation selectivity
[24]. Another important parameter is the dielectric coefficient of the protein that surrounds the permeation pathway; a low protein dielectric coefficient (relative to the pore) attracts more cations into the pore and thereby increases Ca2+affinity[14,19].
The role of the pore volume in selectivity wasfirst suggested by Nonner et al. [24]. In fact, they suggested that pore volume is the fundamental determinant of Ca2+versus monovalent cation
[image:2.595.314.535.438.710.2]selectiv-ity. Both theoretical [14,17]and experimental [30,31]studies have shown that reducing the poreradiushas large effects on this kind of selectivity. To test the CSC mechanism experimentally, Miedema et al. [30,31]chemically modified the pore of the otherwise non-selective OmpF channel. They showed that adding negative charge turned the non-selective porin into a calcium channel and reducing the pore volume improved Ca2+selectivity.
In this paper, we test the “volume-is-fundamental hypothesis”
directly by changing the shape of our model calcium channel. By
“shape” we mean the pair of H and Rparameters of our reduced model, namely, the length and radius of the cylindrical selectivity filter. We change these two parameters in two ways: (1) by simultaneously changing the volume varyingRatfixedH(making the pore wider/narrower) or varyingHatfixedR(making the pore longer/shorter) and (2) by keeping the volumefixed (changing the pore from a long and narrow to a short and wide cylinder).
Reducing the pore length (while increasing the pore radius) changes packing effects of the hard-sphere ions both axially and radially. In complex systems like ion binding proteins, details of structure are believed to be of the greatest importance in determining binding selectivity (i.e., how many ions accumulate in the pore) and so one would expect channels of different length to have different selectivity, even if they have the same volume. Wefind, however, that changes in pore length have relatively little effect on Ca2+-binding
affinity if volume is held constant. If the volume is changed simultaneously with the H and R parameters, however, selectivity can change substantially in a wide range.
Stronger packing in the axial dimension does have effects on ion currents. It produces deeper depletion zones (zones where the density of certain type of ions is significantly small). It was clear earlier[32]and it was shown explicitly recently [15,21]that these depletion zones determine the amount of current each ionic species conducts, similar to the role of depletion zones in transistors[7,33]. In this paper we analyze the effect of these depletion zones in terms of the integrated Nernst–Planck equation for various shapes of the channel. The effect of the nature of confinement of protein side chains is also examined and found to have small effects.
2. Model and methods
2.1. Simple model of a calcium channel
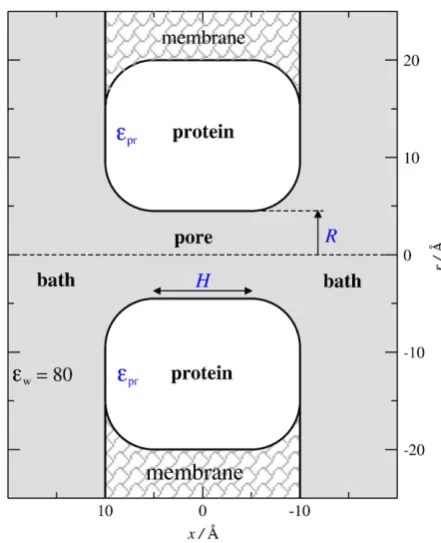
The selectivityfilter of the L-type calcium channel contains four glutamates (E) that determine the channel's selectivity properties [34,35](the EEEE locus). Each glutamate has a terminal COO−group so the pore has a charge of−4e. Channel proteins have an atomic structure that in favorable cases can be determined from X-ray diffraction experiments, usually at 100 K[36], although the structures
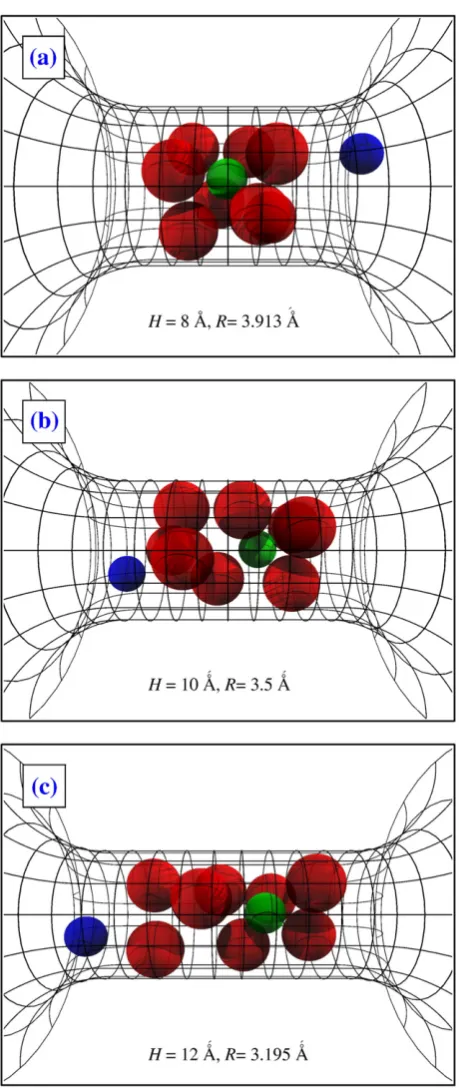
of calcium channels have not yet been reported. This large-scale structure of alpha helices and the backbones provides a pore with a relatively rigid wall as implied by the stable currentsflowing through these channels[37,38]. At the same time, channel proteins have a certain amount offlexibility because they are in a constant thermal motion at room temperature. The mostflexible parts of the protein are the side chains. To take into account both aspects in our reduced model, we use a rigid confinement modeled by a pore with hard walls as shown in Fig. 1 and we place mobile protein side chains (the carboxyl groups) inside this confinement. The region−H/2bxbH/2 defines the selectivity filter. The two important geometrical para-meters of this model are the radiusRand the lengthHof thefilter.Fig. 2shows snapshots of three different channel shapes determined by three different sets of theRandHvalues.
The CSC model states that the packing fraction (the volume occupied by the bodies of the side chains relative to thefilter volume) and the charge of these side chains are the main determinants of selectivity. Therefore, we chose the simplest model that includes both the charge of the side chains and the volume that they occupy: each carboxyl group is represented as two half-charged, independent oxygen ions (two O1/2−) that are free to move within the selectivity filter but are prevented from leaving it (illustrated by red spheres in Fig. 2). The diameter of the oxygen ions isdO= 2.8 Å.
The oxygen ions are confined within thefilter by a soft confining potential that is defined by the following Boltzmann factor
expð−Uconfð Þx =kTÞ= 0:5 + 0:5 tanh½Fa xð FHcÞ; ð1Þ
whereHc=H/2−dO/2,xis the longitudinal coordinate along the axis
of the channel, and the signs are positive forxb0 and negative for xN0.Fig. 3shows this function for three values of theaparameter that defines the“softness”of the wall. In the limita→∞the usual hard wall confinement is recovered. The Boltzmann factor describes the
probability that an oxygen ion can be found somewhere along the x-axis. Its integralVeff=A∫exp(−Uconf(x) /kT)dxcan be identified as
the effective volume that is available for the oxygen ion and is the same for different values ofa:Veff= 2AHc.
The dielectric coefficient of the electrolyte solution is ɛw= 80,
while the dielectric coefficient of the protein is ɛpr= 10. The low
dielectric environment of the pore (1) creates a dielectric barrier for the passing ion (through the interaction with its own induced
charge) and (2) enhances electrostatic attraction between oppo-sitely charged ions (through the interaction with the induced charge of the counter-ions). These effects are thought to be present in real channels. The second term dominates in the highly charged selectivity filter of calcium channels and makes the filter more selective for Ca2+over Na+asɛ
pris decreased[29]. The case when
the pore has a dielectric coefficient that is lower thanɛw(due to,
for example, dielectric saturation [39]) is computationally prob-lematic because of ions crossing sharp dielectric boundaries.
The Na+, Ca2+and Cl−ions are free to move everywhere in the solution (in the channel and in the baths). They are modeled as charged hard spheres with diameters 1.9, 1.98 and 3.62 Å, respec-tively. The simulation cell is a largefinite cylinder that includes the baths, the membrane and the channel protein. The simulation cell is chosen to be large enough so that (1) bathing solutions have bulk properties independent of special effects at the walls of the simulation cell and (2) results of simulations do not change as the simulation cell is increased in size.
This same model of the EEEE locus has been used to replicate experimental data of the L-type channel and other calcium channels with success [14,15,17–21,24–29]. A nearly identical model accounts for a wide range of data from the DEKA sodium channel and its DEEA mutant (which behaves like a calcium channel[40]) with the same two parameter values, despite the very different properties of the two channel types [23]. A closely related model accounts for a wide range of data for the RyR calcium channel and in fact provided detailed predictions of experimental results before they were measured[18–21].
2.2. Monte Carlo simulations
Details of our Metropolis MC simulations are given elsewhere [13,29,41,42]. The ionic concentrations in the bath have to be established accurately because the main output of calculations is the ionic content of the channel as a function of bath electrolyte composition. In order to efficiently simulate micromolar concentra-tions for Ca2+in the bath, we used the grand canonical ensemble[43],
where the simulation cell is connected to an external bath offixed chemical potentials through insertion/deletion of neutral ionic groups (1 Na++ 1 Cl−or 1 Ca2++ 2 Cl−). The chemical potentials that correspond to prescribed concentrations of these salts were calculated with an iterative grand canonical MC method of Malasics et al.[44]. To accelerate convergence, special insertion/deletion steps were applied, where Na+or Ca2+were inserted (or deleted) into (or from) the
[image:3.595.54.284.73.619.2]channel itself instead of being inserted (or deleted) into (or from) the entire simulation cylinder[13].
Fig. 2.Panels A–C show snapshots of the packing of the 8 O1/2−ions (red spheres) in the pore axially. The three panels show snapshots of three different geometries used to study the effect of pore shape inSection 2. Green and blue spheres represent Ca2+and Na+, respectively.
[image:3.595.323.550.572.734.2]The heart of the MC simulation is the energy calculation. In the case of this model, the system contains dielectric boundaries where a polarization surface charge is induced by the ions. This induced charge is determined in every simulation step by the induced charge computation (ICC) method [45], a numerical method to calculate the discretized surface charge on the dielectric interfaces. The method was thoroughly tested and has been shown to be efficient and accurate[24,29,45,46].
The main results of the simulations are the axial density profiles ci(x) of ionic speciesi. They are calculated as the average number of a
given ionic species in predefined slabs along thex-axis divided by the volume of the slab that is accessible to the centers of the ions.
2.3. The integrated Nernst–Planck equation
The MC method provides equilibrium density profiles of the various ionic species. In recent papers [15,16], we have used an integrated form of the Nernst–Planck equation to relate equilibrium MC profiles to current. The Nernst–Planck equation (also known as the drift-diffusion or electrodiffusion equation) is
−Jið Þr = 1
kTDið Þrcið Þjμir ð Þ;r ð2Þ
whereJi(r) is the particleflux density of speciesi,kis the Boltzmann's
constant, T is the temperature, Di(r) is the possibly
position-dependent diffusion coefficient, andμi(r) is the chemical potential.
This chemical potential includes the ideal term (kTlogci(r)) and an
excess term due to correlation between hard sphere ions and the external voltage across the membraneV. We assume that (1) the resistance of the selectivity filter limits the flux, (2) the chemical potential is uniform in the radial dimension, (3) the diffusion coefficients are constant in the selectivityfilter, (4) the two baths are identical, but at different constant electric potentials, and that (5) the applied voltageVis small so that the current/voltage relation is linear. With these approximations, the conductance of the channel for ionic speciesiis
gi= z 2 ie 2 Di kT 1 1 A
Z H=2
−H=2 dx cið Þx
: ð3Þ
and the total conductance is g=Σi gi. Stevens [47] presents this
equation, but it seems not to have been used in subsequent literature. Eisenberg[48]shows that the conductance is a rate constant equal exactly to the conditional probability of a well-defined stochastic process.
This equation shows why depletion (low concentration) zones can be so important. The conductance depends on the reciprocal of the integral of the reciprocal of the density profile. Neighboring slabs of the channel along the ionic pathway can be represented as resistors connected in series[15,16]. If the number of charge carriers (ions) in any of these slabs is depleted (ci(x) is close to zero), then the integral
[image:4.595.308.548.520.710.2]for this slab (the resistance of the slab) becomes large making the whole resistance large. Its reciprocal (conductance) then becomes small. Thus, deep depletion zones for a given ionic species make the conductance of the channel for this ionic species small as discussed at length by Nonner et al. [32]. They were certainly not the first to understand the importance of depletion zones. Depletion zones determine most properties of semiconductor devices like transistors [33,49,50].
In current/voltage measurements for ion channels, currents (conductances) are commonly given as normalized quantities. In particular, for the classic Ca2+-block experiment[2,3], where CaCl
2is
added to afixed NaCl background (30 mM, in this work), the current (conductance) at a given [CaCl2] is normalized by the Na+current
(conductance) in the absence of Ca2+. Thus, the total normalized
conductance of the channel is
g4=
Z dx
c0 Nað Þx
Z dx
cNað Þx + z 2 Ca z2 Na DCa DNa Z dx c0 Nað Þx
Z dx
cCað Þx
; ð4Þ
where the superscript 0 refers to the density profile at zero [CaCl2],
whilecNa(x),cCa(x) andg⁎are taken at a given [CaCl2]. Thefirst term
of the sum is the normalized Na+conductance, while the second term
is the normalized Ca2+conductance. The density profiles are obtained
from simulations and the only adjustable parameter of this model is the ratio of the diffusion coefficients of Ca2+and Na+in the
filter. For this, the valueDCa/DNa= 0.1 was used (the mobility of Ca2+is much
smaller in the channel, we suppose, because of the large electrostatic attraction imposed by the oxygen ions). The CaCl2concentration at
which Ca2+block occurs is insensitive to this parameter[15].
3. Results and discussion
Our basic setup is that of the classical Almers et al.[2,3]experiment which added CaCl2to a background concentration of 30 mM NaCl
using channel parameters in our model ofR= 3.5 Å,H= 10 Å and ɛpr= 10. These reproduce the micromolar Ca2+block. We change the filter radiusRandfilter lengthHin various ways to study the effect of these parameters on selectivity.
In the experimental literature, selectivity is commonly character-ized by [CaCl2]1/2, the [CaCl2] at which the current through the channel
is half of that found when [Ca2+] = 0, i.e.,g⁎= 0.5 (from Eq.4). The
smaller [CaCl2]1/2, the more selective the pore is for Ca2+. To
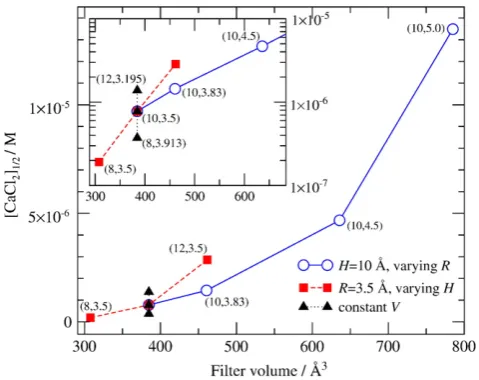
summarize the dependence of selectivity on various combinations of the parametersHandR, inFig. 4we plot [CaCl2]1/2as a function of the filter volume (πR2H). How steeply [CaCl2]1/2changes with volume
indicates how sensitive the Ca2+affinity is tofilter volume. On the
other hand, for afixed volume, thefigure shows how sensitive the Ca2+affinity is tofilter shape (i.e., different combinations ofHandR that keep the volumefixed). Visually, the horizontal change indicates volume sensitivity, while the vertical change indicates shape sensi-tivity. The inset shows the same data in a logarithmic scale. A detailed discussion of the results in thefigure is given in the text below.
3.1. Changing pore shape and volume simultaneously has strong effect on selectivity
The effect of pore radius was studied in our previous work [14]by examining the occupancy of the pore by various ions for [NaCl] = 100 mM atfixed channel lengthH. The concentration of CaCl2at which the average number of Na+drops to half its value
in the absence of Ca2+ depends sensitively on pore radius. (As
Ca2+is added to the bath, Na+in thefilter is gradually replaced
by Ca2+.) Smaller pore volume makes the selectivityfilter even
more crowded, which makes it even harder for cations to find space in the high-density filter. This competition favors Ca2+ because Ca2+ provides twice the charge to balance the negative
charge of the oxygen in the filter than Na+ while occupying
about the same space. This competition can be described in terms of a balance of energy and entropy. By absorbing Ca2+
instead of Na+, the filter reduces free energy. It decreases
electrostatic energy without decreasing entropy too much. (Note that entropy can also be changed by tethering oxygen ions together as in real COO−groups. Such details will be built into the model in future studies.)
Because wefirst used the integrated Nernst–Planck equation[15] after the publication of the above results [14], we repeated the simulations for [NaCl]=30 mM and analyze the results in terms of conductance. KeepingH= 10 Å fixed, we change pore radius and compute the normalized conductance of the channel using Eq.4with Dca/DNa= 0.1. The channel shape is changed in a way that the pore is
made wider keeping its lengthfixed (open circles with solid line in Fig. 4). The conclusions that we can draw are the same that were drawn in Ref.[14]: Ca2+versus Na+selectivity improves considerably
with decreasing filter volume. Density profiles (not shown) have more structure in narrowerfilters, those with smaller R.
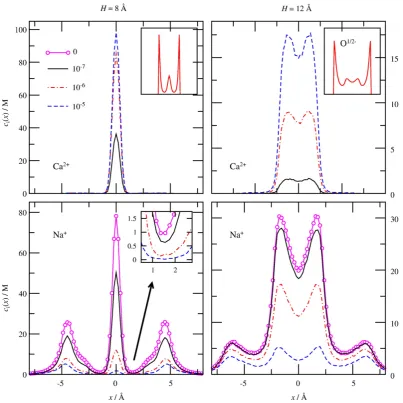
Then, we changed pore length keeping the radiusR= 3.5 Åfixed. Fig. 5shows the density profiles for lengthH= 8 Å (left panels) and H= 12 Å (right panels) for different Ca2+concentrations. Profiles in
the short channel have more structure; the depletion zones are more pronounced, and Ca2+is more efficient in squeezing Na+out from the filter compared to the long channel. In the short channel, the Na+
profiles decrease almost to half of the zero-Ca2+profiles (magenta
open circles) at [CaCl2] = 10−7 M, while this happens only at
[CaCl2] = 10−6 M in the case of the long channel. Furthermore, as
[image:5.595.102.506.325.728.2]Ca2+gradually replaces Na+in the selectivityfilter, the depletion
Fig. 5.Axial distribution profiles for Ca2+
zones of Na+become more pronounced in the shorter channel (see
inset ofFig. 5, bottom-left).
Fig. 6a shows that as Ca2+is added to the bath, the current drops at
lower Ca2+ concentration in the short channel than in the long
channel. The shift of the curves along the abscissa shows the change in Ca2+selectivity asH(and so the volume) is varied.Fig. 4shows this
shift in term of [CaCl2]1/2(filled red squares with dashed line). We can
change thefilter volume in a narrower regime by changingHatfixed R(as opposed to changingRatfixedH). The variation of [CaCl2]1/2as a
function offilter volume is still large as seen in the inset where the results for small volumes are shown on a logarithmic scale. This inset shows that log10[CaCl2]1/2changes linearly with pore volume. The
inset also shows that Ca2+affinity is more sensitive to changes in pore
length than in pore radius.
Eq.4makes it possible to separate the currents carried by Ca2+
and Na+.Fig. 6b shows these currents withD
Ca/DNa= 0.1. When
Ca2+concentration of the bath is less than 10−4 M, only a very
small current is carried by Ca2+(Fig. 6b). Na+then carries almost
all of the total current (Fig. 6a,b). This Na+ current, however, is reduced by low micromolar concentrations of Ca2+, to the extent
that Na+in the pore is displaced by Ca2+(Fig. 6c). It is a rare event
that a Ca2+ ion enters the selectivityfilter through the depletion
zones, but once it is there, it stays there for a long time. Therefore, thisfirst Ca2+ion tends to dwell in the pore but does not contribute
significant current. Na+ions, on the contrary, can enter and leave
thefilter and carry current but only in the time when the Ca2+ion is not there. A substantial Ca2+current starts toflow at millimolar
Ca2+concentrations, at which a second Ca2+tends to occupy the
pore (Fig. 6c). Our simulations measure the long-time average of this process, showing a reduced Na+occupancy and current.
Therefore, for small bath Ca2+ concentrations (where Ca2+
current is vanishingly small), the total conductance curves (Fig. 6a) reflect only the Na+conductances (Fig. 6b), which, in turn, re
flect the Na+occupancies (Fig. 6c). This implies that, in this regime, the
selective binding of Ca2+to the pore is thefirst-order determinant
of the variation of conductance with [CaCl2]. This selective binding
is sensitive to the volume of the pore. Depletion zones of Na+have
little role in this because the Na+ concentration changes in the
depletion zones just as quickly (as a function of [CaCl2]) as it
changes in the binding site (compare the bottom-left panel ofFig. 5 and its inset).
The qualitativefindings of Fig. 6a agree with experiments. In a highly selective calcium channel with a small selectivityfilter Ca2+
block of current happens at smaller bath [CaCl2] and current has a
deeper minimum as in the case of the L-type calcium channel[2,3]. In a less Ca2+-selective calcium channel with a larger selectivityfilter, Ca2+ block of current occurs at larger bath [CaCl
2] with a less
pronounced minimum as in the case of the RyR calcium channel[21].
3.2. Changing pore shape under conserved volume has small effect on selectivity
Fig. 4shows that the shape of the pore keeping the volumefixed has a real, but small effect on selectivity. Consider the results for volume 460.6 Å for which there are two points: one withH= 10 Å and R= 3.83 Å (open circle) and another withH= 12 Å andR= 3.5 Å (filled square). The difference in [CaCl2]1/2between these two points
implies that shorter pore with larger radius has better Ca2+
-selectivity properties than a longer pore with smaller radius at the same volume.
To explore this effect, we performed additional simulations on channels with different shapes, but the same volume as the previously studied geometryH= 10 Å andR= 3.5 Å.Fig. 2shows these channels with dimensionsH= 8 Å andR= 3.913 Å,H= 10 Å andR= 3.5 Å and H= 12 Å andR= 3.195 Å. All have the same volume 384.65 Å3.
Fig. 7shows the density profiles of different species for different Ca2+concentrations and channel lengths. Each panel shows results
for a different bath Ca2+concentration: inFig. 7a, [Ca2+] = 0 M; in
Fig. 7b, [Ca2+] = 10−7 M; inFig. 7c, [Ca2+] = 10−6 M; inFig. 7d,
[Ca2+] = 10−5 M. Each curve in a given panel is computed for a
different pore length. The densities are multiplied by R2, so the
height of curves are proportional to the average number of ions in the cross-section of the pore instead of the local density (compare to Eq.3for the conductance). Ca2+profiles are absent in the case of
[Ca2+] = 0 M, so we show the curves for the oxygen ions in the top
panel of Fig. 7a. They are quite independent of bath Ca2+
concentration. In the longer pores, additional peaks in O1/2− concentration are found because there is space for additional layers of oxygen ions in the axial dimension. The distributions for Na+and
Ca2+are quite different for various pore lengths due to different
Fig. 6.The classical anomalous mole fraction experiment: (a) normalized conductances as functions of log10[CaCl2] in M added to a 30-mM NaCl background for channels with varyingfilter lengths atfixed radius (R= 3.5 Å andɛpr= 10). The × symbols show the experimental results of Almers et al.[2,3]. Their results are different from ours at high [CaCl2] because in the experiments Ca2+was added only to one side of the pore (increasing Ca2+
driving force at high [CaCl2] [15]), while in our equilibrium simulations Ca2+
was added symmetrically. (b) Normalized ionic conductances of the pore for Na+
and Ca2+
as given by Eq. 4. (c) The average number of Na2+ and Ca2+ ions in the selectivityfilter. In panels b and c, increasing curves refer to Ca2+
Fig. 7.Axial distribution profiles for (a) [CaCl2] = 0 M, (b) [CaCl2] = 10−7M, (c) [CaCl2] = 10−6M and (d) [CaCl2] = 10−5M for channels of various shapes. Solid, dotted and dashed lines refer to selectivityfilters of lengthsH= 12, 10 and 8 Å, respectively. The top and bottom panels show Ca2+
and Na+profiles, respectively. The top panel of panel a shows oxygen profiles (they are practically the same for every Ca2+concentration). The profiles are multiplied by
R2
packing, but they change together as Ca2+concentration changes,
which implies that selectivity should be similar in the three cases. Stronger packing results in considerable depletion zones for Na+
in the short pore at the locations of the peaks in O1/2−profiles. These depletion zones decrease the absolute value of the conductance of the channel. The normalized conductance, however, is less influenced because we normalize by the conductance at [CaCl2] = 0 M, where
these depletion zones are also present. As pore length is increased, these depletion zones become less pronounced.
Fig. 8is analogous toFig. 6. It shows the same quantities in panels a–c thatFig. 6does as functions of log10[CaCl2], but here the pore
radius is not constant. The curves inFig. 8a, computed for selectivity filters with the same volume, are closer together than those inFig. 6a, which were computed for selectivityfilters with different volumes, showing that changing pore shape has a larger effect on selectivity if we also change the pore volume.Fig. 4shows this result in terms of [CaCl2]1/2(filled triangles with dotted line).
Similar conclusions can be drawn fromFig. 8as fromFig. 6: The occupancy curves for Na+ (Fig. 8c) behave similarly to Na+
-conductance curves (Fig. 8b) in the regime of Ca2+block ([CaCl] 2
b10−5M), which implies that the block is a result of selective binding
of Ca2+over Na+in the selectivityfilter; that is, as the number of Na+
ions decreases in thefilter, the current carried by them decreases simultaneously.
The main difference betweenFig. 8 and Fig. 6is that the curves for different combinations of H and R are farther apart when filter volume is changed (Fig. 6) than in the case when it is unchanged (Fig. 8). We conclude that changing the pore shape has less effect if the pore volume is conserved. Thus, pore shape (at constant volume) provides an additional engineering variable with which we canfi ne-tune the selectivity properties of the model. Pore radius can be especially important in the competition between ions of different size, in particular for the sodium channel, where Na+versus K+selectivity
seems to arise from a deeper depletion zone for K+than for Na+[23].
3.3. Softness of oxygen confinement does not influence selectivity
[image:8.595.314.542.76.439.2]Our results so far imply that particle density in the filter and packing effects resulting in depletion zones are important determi-nants of selectivity. Packing of oxygen ions is strongly influenced by the way we confine them. In our earlier studies (and in the simulations shown so far in this work), the oxygen was confined by hard walls at ±H/2 (corresponding toa→∞in Eq.1). This hard wall confinement results in an artificially high peak of oxygen at these
Fig. 8.(a) Normalized conductances as a function of log10[CaCl2] in M added to a 30-mM NaCl background for channels with varyingfilter lengths and radii while keepingfilter volume constant (ɛpr= 10). Thetimessymbols show the experimental results of Almers et al.[2,3]. (b) Normalized ionic conductances of the pore for Na+
and Ca2+
as given by Eq. 4. (c) The average number of Na2+
and Ca2+
ions in the selectivityfilter. In panels b and c, increasing curves refer to Ca2+, while decreasing curves refer to Na+.
Fig. 9.Axial distribution profiles for O1/2−, Ca2+ and Na+
[image:8.595.48.272.274.708.2]walls which is a well-known hard sphere packing effect (see, for example, insets ofFig. 5). In real selectivityfilters, made by proteins, confinement is unlikely to be so hard. Therefore, we examine the role of the hard wall. Does the hard wall produce artifactual depletion zones of Ca2+or Na+? Does it have any artificial effect that would
seriously influence our conclusions drawn from this channel model? We performed simulations with different values of theaparameter of the soft confining potential given in Eq.1for the geometryH= 10 Å and R= 3.5 Å. As expected, the distribution of O1/2− ions is significantly influenced by the way they are confined as shown in the top panel ofFig. 9for [CaCl2] = 10−6M. The oxygen ions distribute
over thefilter more evenly when a softer confinement allows them moreflexibility at thefilter entrances; the high peaks are suppressed. Remarkably, the profiles of Na+and Ca2+are much less influenced.
The conductance of the channel is the same whether the channel is constructed with hard or soft walls (Fig. 10) even though the resulting distribution of the side chains is quite different.
This is a satisfying result because it supports our hypothesis: it is the confinement provided by the protein and the density of the charges in the selectivityfilter that really matter, and as long as those coarse features are maintained, then smaller details of protein structure have minor effects on selectivity.
4. Summary
Our reduced model of the selectivityfilter is not intended to be a realistic structural representation of the calcium channel. Instead, it is used to study the role of fundamental classical physical interactions (electrostatics and hard sphere exclusion) and how these terms create selectivity to first order. The success of the model and the CSC mechanism implies that these terms should be present in more detailed models of the calcium channel. Molecular dynamics simula-tions of atomistic models of channels have been chiefly concentrated on potassium channels whose structure is known[51–55]. Simula-tions of assumed atomic structures of calcium channels using that of the potassium channel as a template have also been published[56– 58]. Neither of these simulations, nevertheless, relate their results to experimental conductivities as functions of varying bath compositions as we do. Atomic structure, nevertheless, has a close relation to the parameters of our reduced model. The polarization properties of the protein surrounding the pore (ɛprin our model), as well as the length
Hand radiusRof the selectivityfilter are all structural parameters that are essentially determined by protein structure. In place of
high-resolution structure (which is not available for Ca2+channels), we
model the bulk of the protein in an abstract, low-resolution structure. This structure is fully specified by a small number of parameters whose physical meaning is self-evident.
Our simulations showed that ionic density is an important determinant of Ca2+versus Na+selectivity in calcium channels. If
the number of structural ions in thefilter (8 O1/2−ions in this study) and polarization properties (dielectric coefficient of the protein) are fixed, it is the volume that determines the density. Simulations with different pore shapes with and without conserved volume showed that variation in selectivity is larger if the volume is changed. Channel shape atfixed volume is also important, but its influence is smaller.
Strong variations of particle packing have surprisingly small significance for selective (relative) conduction, but they do have interesting consequences regarding the absolute value of conductance (for example, the size of the Na+leak at physiological [Ca2+]). Finally,
we have shown that confining the oxygen ions by soft walls instead of hard walls has little effect on selectivity.
Acknowledgment
The authors thank the Ira and Marylou Fulton Supercomputing Center at BYU, the Hungarian National Research Fund (OTKA K75132, to BD) and NIH (GM076013 to BE).
References
[1] B. Hille, Ion Channels of Excitable Membranes, Sinauer Associates Inc., Sunder-land, 2001.
[2] W. Almers, E.W. McCleskey, P.T. Palade, Non-selective cation conductance in frog muscle membrane blocked by micromolar external calcium ions, J. Physiol. 353 (1984) 565–583.
[3] W. Almers, E. McCleskey, Non-selective conductance in calcium channels of frog muscle: calcium selectivity in a single-file pore, J. Physiol. 353 (1984) 585–608. [4] P. Hess, J.B. Lansman, R.W. Tsien, Calcium channel selectivity for divalent and
monovalent cations. Voltage and concentration dependence of single channel current in ventricular heart cells, J. Gen. Physiol. 88 (1986) 293–319.
[5] W.A. Sather, E.W. McCleskey, Permeation and selectivity in calcium channels, Annu. Rev. Physiol. 65 (2003) 133–159.
[6] K.E. Cooper, P.Y. Gates, R.S. Eisenberg, Diffusion theory and discrete rate constants in ion permeation, J. Membr. Biol. 109 (1988) 95–105.
[7] R.S. Eisenberg. New developments and theoretical studies of proteins, chap. Atomic biology, electrostatics, and ionic channels. World Scientific, Philadelphia (1996), 269-357. URLhttp://arxiv.org/abs/0807.0715v1.
[8] D. Chen, L. Xu, A. Tripathy, G. Meissner, B. Eisenberg, Permeation through the calcium release channel of cardiac muscle, Biophys. J. 73 (1997) 1337–1354. [9] R.S. Eisenberg, From structure to function in open ionic channels, J. Membr. Biol.
171 (1999) 1–24.
[10] B. Corry, T. Allen, S. Kuyucak, S.-H. Chung, Biophys. J. 80 (2001) 195–214. [11] B. Corry, T. Vora, S.-H. Chung, Electrostatic basis of valence selectivity in cationic
channels, Biochim. Biophys. Acta 1711 (2005) 72–86.
[12] S.H. Chung, B. Corry, Three computational methods for studying permeation, selectivity and dynamics in biological ion channels, Soft Matter 1 (2005) 417–427. [13] D. Boda, W. Nonner, D. Henderson, B. Eisenberg, D. Gillespie, Volume exclusion in
calcium selective channels, Biophys. J. 94 (2008) 3486–3496.
[14] D. Boda, M. Valiskó, B. Eisenberg, W. Nonner, D. Henderson, D. Gillespie, Combined effect of pore radius and protein dielectric coefficient on the selectivity of a calcium channel, Phys. Rev. Lett. 98 (2007) 168102.
[15] D. Gillespie, D. Boda, The anomalous mole fraction effect in calcium channels: a measure of preferential selectivity, Biophys. J. 95 (2008) 2658–2672.
[16] D. Boda, M. Valiskó, D. Henderson, B. Eisenberg, D. Gillespie, W. Nonner, Ion selectivity in L-type calcium channels by electrostatics and hard-core repulsion, J. Gen. Physiol. 133 (2009) 497–509.
[17] D. Boda, D. Henderson, D.D. Busath, Monte Carlo study of the effect of ion and channel size on the selectivity of a model calcium channel, J. Phys. Chem. B 105 (2001) 11574–11577.
[18] D. Gillespie, L. Xu, Y. Wang, G. Meissner, (De)constructing the ryanodine receptor: modeling ion permeation and selectivity of the calcium release channel, J. Phys. Chem. B 109 (2005) 15598–15610.
[19] D. Gillespie, Energetics of divalent selectivity in a calcium channel: the Ryanodine Receptor Case Study, Biophys. J. 94 (2008) 1169–1184.
[20] D. Gillespie, M. Fill, Intracellular calcium release channels mediate their own countercurrent: the ryanodine receptor case study, Biophys. J. 95 (2008) 3706–3714.
[image:9.595.55.283.76.264.2][21] D. Gillespie, J. Giri, M. Fill, Reinterpreting the anomalous mole fraction effect: the Ryanodine Receptor Case Study, Biophys. J. 97 (2009) 2212–2221.
[22] D. Boda, D.D. Busath, B. Eisenberg, D. Henderson, W. Nonner, Monte Carlo simulations of ion selectivity in a biological Na channel: charge-space competi-tion, Phys. Chem. Chem. Phys. 4 (2002) 5154–5160.
[23] D. Boda, W. Nonner, M. Valiskó, D. Henderson, B. Eisenberg, D. Gillespie, Steric selectivity in Na channels arising from protein polarization and mobile side chains, Biophys. J. 93 (2007) 1960–1980.
[24] W. Nonner, L. Catacuzzeno, B. Eisenberg, Binding and selectivity in L-type calcium channels: a mean spherical approximation, Biophys. J. 79 (2000) 1976–1992. [25] W. Nonner, D. Gillespie, D. Henderson, B. Eisenberg, Ion accumulation in a
biological calcium channel: effects of solvent and confining pressure, J. Phys. Chem. B 105 (2001) 6427–6436.
[26] D. Boda, D.D. Busath, D. Henderson, S. Soko lowski, Monte Carlo simulations of the mechanism for channel selectivity: the competition between volume exclusion and charge neutrality, J. Phys. Chem. B 104 (2000) 8903–8910.
[27] D. Boda, D. Henderson, D.D. Busath, Monte Carlo study of the selectivity of calcium channels: improved geometrical model, Mol. Phys. 100 (2002) 2361–2368. [28] D. Boda, D. Henderson, Computer simulation of the selectivity of a model calcium
channel, J. Phys.: Cond. Matt. 14 (2002) 9485–9488.
[29] D. Boda, M. Valiskó, B. Eisenberg, W. Nonner, D. Henderson, D. Gillespie, The effect of protein dielectric coefficient on the ionic selectivity of a calcium channel, J. Chem. Phys. 125 (2006) 034901.
[30] M. Vrouenraets, J. Wierenga, W. Meijberg, H. Miedema, Chemical modification of the bacterial Porin OmpF: gain of selectivity by volume reduction, Biophys. J. 90 (2006) 1202–1211.
[31] H. Miedema, M. Vrouenraets, J. Wierenga, D. Gillespie, B. Eisenberg, W. Meijberg, W. Nonner, Ca2+
selectivity of a chemically modified OmpF with reduced pore volume, Biophys. J. 91 (2006) 4392–4400.
[32] W. Nonner, D.P. Chen, B. Eisenberg, Anomalous mole fraction effect, electrostatics, and binding in ionic channels, Biophys. J. 74 (1998) 2327–2334.
[33] R.S. Eisenberg. Living transistors: a physicist's view of ion channels. URLhttp:// arxiv.org/abs/q-bio/0506016v2. Version 2.
[34] J. Yang, P.T. Ellinor, W.A. Sather, J.F. Zhang, R.W. Tsien, Molecular determinants of Ca2+ selectivity and ion permeation in L-type Ca2+
channels, Nature 366 (1993) 158–161. [35] P.T. Ellinor, J. Yang, W.A. Sather, J.F. Zhang, R.W. Tsien, Ca2+
interactions, Neuron 15 (1995) 1121–1132.
[36] D.A. Doyle, J.M. Cabral, R.A. Pfuetzner, A.L. Kuo, J.M. Gulbis, S.L. Cohen, B.T. Chait, R. MacKinnon, The structure of the potassium channel: molecular basis of K+ conduction and selectivity, Science 280 (1998) 69–77.
[37] F.J. Sigworth, Covariance of nonstationary sodium currentfluctuations at the node of Ranvier, Biophys. J. 34 (1981) 111–133.
[38] F.J. Sigworth, Voltage gating of ion channels, Q. Rev. Biophys. 27 (1994) 1–40. [39] M. Aguilella-Arzo, A. Andrio, V.M. Aguilella, A. Alcaraz, Dielectric saturation of water
in a membrane protein channel, Phys. Chem. Chem. Phys. 11 (2009) 358–365.
[40] S.H. Heinemann, H. Teriau, W. Stuhmer, K. Imoto, S. Numa, Calcium-channel characteristics conferred on the sodium-channel by single mutations, Nature 356 (1992) 441–443.
[41] M.P. Allen, D.J. Tildesley, Computer Simulation of Liquids, Oxford, New York, 1987. [42] D. Frenkel, B. Smit, Understanding Molecular Simulations, Academic Press, San
Diego, 1996.
[43] J.P. Valleau, L.K. Cohen, Primitive model electrolytes. 1. grand canonical Monte-Carlo computations, J. Chem. Phys. 72 (1980) 5935–5941.
[44] A. Malasics, D. Gillespie, D. Boda, Simulating prescribed particle densities in the grand canonical ensemble using iterative algorithms, J. Chem. Phys. 128 (2008) 124102.
[45] D. Boda, D. Gillespie, W. Nonner, D. Henderson, B. Eisenberg, Computing induced charges in inhomogeneous dielectric media: application in a Monte Carlo simulation of complex ionic systems, Phys. Rev. E 69 (2004) 046702.
[46] D. Boda, D. Gillespie, B. Eisenberg, W. Nonner, D. Henderson, Ionic soft matter: Novel trends in theory and applications, vol. 206 of NATO Science Series: II: Mathematics, Physics and Chemistry, chap. The Induced Charge Computation method and its application in Monte Carlo simulations of inhomogeneous dielectric systems, Springer, 2005.
[47] C.F. Stevens, Neurophysiology: A Primer, John Wiley, New York, 1966. [48] B. Eisenberg. Biophysics textbook on line“Channels, receptors, and transporters”,
chap. Permeation as a diffusion process. URLhttp://arxiv.org/abs/0807.0721. [49] S.W., Electrons and Holes in Semiconductors to Applications in Transistor
Electronics, Van Nostrand, New York, 1950.
[50] S.M., Physics of Semiconductor Devices, Prentice Hall, New York, 1990. [51] N.S. Y, B. Roux, Importance of hydration and dynamics on the selectivity of the
KcsA and NaK channels, J. Gen. Physiol. 129 (2007) 135–143.
[52] S. Varma, S.B. Rempe, Tuning ion coordination architectures to enable selective partitioning, Biophys. J. 93 (2007) 1093–1099.
[53] G.V. Miloshevsky, P.C. Jordan, Conformational changes in the selectivityfilter of the open state KcsA channel: an energy minimization study, Biophys. J. 95 (2008) 3239–3251.
[54] F.P.W., K. Tai, S.M.S., The selectivity of K+
ion channels: testing the hypotheses, Biophys. J. 95 (2008) 5062–5072.
[55] D.L. Bostick, A.K., B.C.L., K+ /Na+
selectivity in toy cation binding site models is determined by the‘host’, Biophys. J. 96 (2009) 3887–3896.
[56] G.M. Lipkind, H.A. Fozzard, Modeling of the outer vestibule and selectivityfilter of the L-type Ca2+
channel, Biochemistry 40 (2001) 6786–6794.
57] G. Barreiro, C.R.W. Guimaraes, R.B. de Alencastro, A molecular dynamics study of an L-type calcium channel model, Protein Eng. 15 (2002) 109–122.
![Fig. 7. Axial distribution proprolines refer to selectivitythefiles for (a) [CaCl2]=0 M, (b) [CaCl2]=10− 7 M, (c) [CaCl2]=10−6 M and (d) [CaCl2]=10−5 M for channels of various shapes](https://thumb-us.123doks.com/thumbv2/123dok_us/8110749.236269/7.595.93.515.92.728/axial-distribution-proprolines-selectivitytheles-cacl-channels-various-shapes.webp)
![Fig. 8. (a) Normalized conductances as a function of logvolume constant (Eq. 4. (c) The average number of Naand c, increasing curves refer to CaNaCl background for channels with varyinget al10[CaCl2] in M added to a 30-mM filter lengths and radii while keep](https://thumb-us.123doks.com/thumbv2/123dok_us/8110749.236269/8.595.48.272.274.708/normalized-conductances-function-logvolume-constant-increasing-background-varyinget.webp)
![Fig. 10. Normalized conductances as a function of logNaCl background for values of theRAlmers et al.10[CaCl2] in M added to a 30-mM “softness” parameter a (channel parameters are=3.5 Å, H=10 Å and ɛpr=10)](https://thumb-us.123doks.com/thumbv2/123dok_us/8110749.236269/9.595.55.283.76.264/normalized-conductances-function-background-theralmers-softness-parameter-parameters.webp)
