Correlating transcriptional networks to breast cancer survival: a large-scale
coexpression analysis
Colin Clarke
1,*
,†, Stephen F.Madden
1,2,†, Padraig Doolan
1,
Sinead T.Aherne
1,2, Helena Joyce
1,2, Lorraine O’Driscoll
3,
William M.Gallagher
4, Bryan T.Hennessy
5,
Michael Moriarty
1, John Crown
1,2, Susan Kennedy
6,†and
Martin Clynes
1,2,†1National Institute for Cellular Biotechnology and 2Molecular Therapeutics for Cancer Ireland, Dublin City University, Dublin 9, Ireland, 3School of Pharmacy & Pharmaceutical Sciences and Trinity Biomedical Sciences Institute, Trinity College Dublin, Dublin 2, Ireland, 4School of Biomolecular and Biomedical Science, UCD Conway Institute, University College Dublin, Dublin 4, Ireland, 5Beaumont Hospital and Royal College of Surgeons in Ireland, Dublin 9, Ireland and 6Research Foundation, Royal Victoria Eye and Ear Hospital, Adelaide Road, Dublin 2, Ireland
*To whom correspondence should be addressed. Tel: +353 1 700 7740; Fax: +353 1 700 5484;
Email: colin.clarke@dcu.ie
Correspondence may also be addressed to Martin Clynes. Tel: +353 1 700 5700; Fax: +353 1 700 5484;
Email: martin.clynes@dcu.ie
Weighted gene coexpression network analysis (WGCNA) is a pow-erful ‘guilt-by-association’-based method to extract coexpressed groups of genes from large heterogeneous messenger RNA expres-sion data sets. We have utilized WGCNA to identify 11 coregulated gene clusters across 2342 breast cancer samples from 13 microar-ray-based gene expression studies. A number of these transcrip-tional modules were found to be correlated to clinicopathological variables (e.g. tumor grade), survival endpoints for breast cancer as a whole (disease-free survival, distant disease-free survival and overall survival) and also its molecular subtypes (luminal A, lumi-nal B, HER2+ and basal-like). Examples of findings arising from this work include the identification of a cluster of proliferation-related genes that when upregulated corproliferation-related to increased tumor grade and were associated with poor survival in general. The prog-nostic potential of novel genes, for example, ubiquitin-conjugat-ing enzyme E2S (UBE2S) within this group was confirmed in an independent data set. In addition, gene clusters were also associ-ated with survival for breast cancer molecular subtypes includ-ing a cluster of genes that was found to correlate with prognosis exclusively for basal-like breast cancer. The upregulation of sev-eral single genes within this coexpression cluster, for example, the potassium channel, subfamily K, member 5 (KCNK5) was associ-ated with poor outcome for the basal-like molecular subtype. We have developed an online database to allow user-friendly access to the coexpression patterns and the survival analysis outputs uncov-ered in this study (available at http://glados.ucd.ie/Coexpression/).
Introduction
Breast cancer is characterized not as single disease but as a het-erogeneous group of neoplasms defined by discrete underlying biology, pathological features and consequent clinical outcomes. Classification of breast cancers has traditionally been accomplished
using clinicopathological criteria (e.g. histological grade and lymph node status) in combination with the expression of several receptor proteins including estrogen receptor (ER), progesterone receptor (PR) and human epidermal growth factor 2 (HER2). The status of these variables are considered against clinical guidelines (e.g. St Gallen) (1) or online tools [e.g. Adjuvant Online! (http://www.adjuvantonline. com)] to aid clinical decision making in terms of selecting suitable treatment (e.g. hormone-based therapy for ER+ patients) and deter-mining patient prognosis.
Our current understanding of the breadth of breast cancer complex-ity has been greatly enhanced through the study of global gene and protein expression. Early analysis of messenger RNA levels using microarrays led to the division of breast cancer into at least five dis-tinct molecular subtypes (luminal A, luminal B, normal-like, HER2+ and basal-like) (2). Further evidence from gene expression and copy number variation profiling has suggested that breast cancer can be further subclassified into as many as 10 distinct subtypes (3). A recent paper has identified two further subgroups from protein expression (4). In that study, following integration of several different data types (e.g. mutation analysis, copy number variation and proteomics) with transcriptomic data, the similarity between basal-like breast cancer and serous ovarian cancer was demonstrated.
In addition to improving our understanding of molecular mecha-nisms, the derivation of transcriptomics-based prognostic signatures has received considerable attention. Efforts are underway to com-mercialize and validate a number of these tests, perhaps the two most well-known being the Mammaprint (5) and Oncotype DX (6) assays. The accumulation of a large volume of breast cancer microarray data within repositories such as GEO (http://www.ncbi.nlm.nih.gov/ geo/) and ArrayExpress (www.ebi.ac.uk/arrayexpress/) presents an opportunity to reanalyze gene expression data from multiple studies (sometimes termed a meta-analysis) and move away from defining subjective classifications of sample type (7). Integrating informa-tion from multiple studies provides an increase in statistical power and allows a greater proportion of the heterogeneity associated with breast cancer and technical variability associated with micro-arrays to be captured. To date, various statistical approaches have been developed for single-gene microarray meta-analyses to identify biomarkers in cancer as a whole (8,9) and individual cancer types (e.g. non-small cell lung cancer) (10). Examples of applications of single-gene meta-analyses in breast cancer research include the dif-ferentiation of ER+/− patients (11) and identifying the correlation of decreased GATA binding protein 3 (GATA3) gene expression with invasion and poor disease-free survival (DFS) (12). In recent years, a number of web-based tools have also been developed to allow researchers to assess the association of putative prognostic markers in large breast cancer data sets with survival (e.g. BreastMark (13) and KMplot (14)).
Coexpression analysis has emerged as a powerful technique for multigene analysis of large-scale data sets. The underlying concept of gene coexpression analysis is ‘guilt-by-association’, in that groups of genes (known as coexpression modules) found to maintain a consistent expression relationship independent of phenotype are coregulated and may share a common biological role. The evolutionary conservation of coexpression patterns lends further evidence to support the biological importance of this phenomenon (15). Coexpression analyses have been utilized to study a wide range biological systems from the investigation of the evolution (16) and function (17) of the human brain, to uncovering the biological processes underlying the production of biopharmaceuticals using mammalian cells (18). In cancer research, coexpression analyses have exposed the messenger RNA and microRNA expression network in prostate cancer (19) and identified the ASPM gene as a novel molecular target in glioblastoma
Abbreviations: DDFS, distant disease-free survival; DFS, disease-free sur-vival; ER, estrogen receptor; FRY, furry homolog; GO, gene ontology; HER2, human epidermal growth factor 2; HR, hazard ratio; ME, module eigengene; OS, overall survival; PCC, Pearson correlation coefficient; PR, progesterone receptor; UBE2S, ubiquitin-conjugating enzyme E2S; WGCNA, weighted gene coexpression network analysis.
†These authors contributed equally to this work.
at Trinity College Dublin on August 25, 2014
http://carcin.oxfordjournals.org/
(20). A study by Wirapati et al. (21) utilized coexpression analysis to analyze a breast cancer data set containing 2833 samples. Here, a type of supervised coexpression analysis was conducted against three ‘prototype’ genes, ESR1, ERBB2 and AURKA, to represent ER status, HER2 status and proliferation, respectively. The coexpression of genes within nine separate prognostic signatures with the prototype genes was utilized to test individual signatures and highlight the role of proliferation in breast cancer.
In this study, we utilize weighted gene coexpression network analy-sis (WGCNA) (22) to analyze a data set comprising 2342 samples taken from 13 publically available data sets. This study expands on the coexpression analysis conducted in the Wirapati study in three ways. First, the initial phase of the WGCNA method allows the iden-tification of coexpression modules in an unsupervised manner without the selection of genes related to any biological process. Second, we conduct survival analysis for three survival endpoints, overall survival (OS), distant disease-free survival (DDFS) and DFS. The final distinc-tion between both studies is the identificadistinc-tion of coexpression mod-ules associated with outcome for breast cancer molecular subtypes.
From 5500 of the most highly coexpressed and variable probesets across the breast cancer sample set, we identified 11 distinct coexpres-sion modules (ranging in size from 30 to 1020 probesets). Following survival analysis, all 11 coexpression modules were found to be significantly associated with at least one of the survival endpoints. The utility of the approach to discover novel prognostic genes within coexpressed clusters is demonstrated by utilizing an in-house inde-pendent microarray data set. For instance, we identified high ubiqui-tin-conjugating enzyme E2S (UBE2S) gene expression as indicative of poor OS in both the public and independent data sets. This gene was coexpressed in a 723-probeset module related to cell proliferation and coexpressed with the well-known breast cancer markers MKI67 and AURKA. Furthermore, we were able to identify novel makers for the molecular subtypes, including the association of increased CD53 gene expression with good outcome for both the HER2+ and basal-like breast cancers.
Materials and methods Publically available data sets
The raw gene expression data from 13 breast cancer data sets (23–35) were downloaded from the GEO data repository (http://www.ncbi.nlm.nih.gov/ geo/). The combined data set contained a total of 2342 samples hybridized to probesets present on both the Affymetrix HG-U133A and the HG-U133A Plus2 platform. In total, these platforms have 22 277 probe sets in common. Clinicopathological variables (age, tumor size, lymph node involvement and tumor grade), receptor protein expression (ER, HER2 and PR) and survival information (DFS, DDFS and OS) were compiled for each gene expression data set (Supplementary Table 1, available at Carcinogenesis Online). All microarray data were called using the GC robust multichip average method (36) and quantile normalized using the ‘affy’ Bioconductor package. The ComBat algorithm was utilized to adjust the data for potential batch effects (37). Prior to WGCNA analysis, we filtered probesets on a study-by-study basis for expression [signal > log2 (100) in at least 5% of samples within at least one study] and/or invariance (interquartile range < 1.25; Supplementary Figure 1, available at Carcinogenesis Online). In total, 6737 probesets passed these filtering criteria.
Classification of breast cancer subtypes in public microarray data set Breast cancers were divided into luminal A, luminal B, HER2+ and basal-like subtypes using the ssp2003 (38), ssp2006 (39) and pam50 (40) classifiers, via the ‘genefu’ R package (http://www.bioconductor.org/packages/release/bioc/ html/genefu.html). For subsequent survival analyses, samples were included within subtypes on the basis of classification by at least one the above classi-fiers. Genefu classified 1521 samples as luminal A, 1120 samples as luminal B, 457 samples as HER2+ and 412 samples as basal-like. A degree of over-lap exists between the subtypes as the subtype classifiers are not completely concordant.
In-house breast cancer gene expression profiling
Patient selection. Tissue specimens from 104 cases of primary breast can-cer (prior to any treatment with tamoxifen or chemotherapeutic agents), for which clinical follow-up and pathologic material, including snap-frozen
tissue, were available for analysis from the 1993–97 files of Department of Pathology, St Vincent’s University Hospital, Dublin, Ireland, were included in this study. A summary of the patient characteristics within the in-house data set is provided in Supplementary Table 2, available at Carcinogenesis Online. The patients involved underwent potentially curative resection at the hospital. Unfixed fresh breast resection specimens were received in the pathology labo-ratory within a maximum of 30 min of resection. The tissue was examined macroscopically and tumor samples were snap frozen in liquid nitrogen and subsequently stored at −70°C prior to RNA isolation. A number of clinical and pathological parameters were extracted from patients’ charts including details on age, post-operative treatment and follow-up, tumor stage and hor-monal analysis.
RNA preparation and microarray analysis. Using procedures described previously (41), RNA was isolated from clinical specimens, quantity and quality were evaluated using Nanodrop (ND-1000; Labtech. International) and Agilent bioanalyzer (Agilent 2100; Agilent Technologies), respectively, and RNA was labeled and hybridized to Affymetrix HG-U133A Plus 2.0 microarrays. The data processing procedure was the same as for the pub-lic data sets (Supplementary Figure 1, available at Carcinogenesis Online). These data have been submitted to the GEO microarray data repository (GSE42568).
Weighted gene network coexpression analysis
WGCNA (22) was carried out on the 6737 filtered probesets using the R ‘wgcna’ package (42). The first stage in WGCNA utilizes a similarity meas-ure to summarize the relationship between all pairs of probesets across the data set to create a correlation matrix. In this case, we use the signed WGCNA coexpression measure (42,43), and correlation matrix similarity values range from 0 (strongly negatively correlated) to 1 (strongly positively correlated). To identify coexpression modules, WGCNA uses a ‘soft-thresh-olding procedure’ to avoid the selection of an arbitrary cut-off. To achieve this weighted separation of coexpression, the correlation matrix is trans-formed to what is known as an adjacency matrix in a process that aims to mimic a network structure commonly found in nature. For information on how this transformation is achieved, see ref. 22. Coexpression similarity for each pair of genes from the adjacency matrix is determined via a network distance measure known as the topological overlap measure (22,44). The application of the topological overlap measure improves the sensitivity of coexpression identification by assessing gene pairs in terms of their direct correlation and also the degree of agreement in terms of associations to the other genes in the data set. Clusters of coexpressed genes are identified by hierarchical cluster analysis following subtraction of the topological over-lap measure similarity from 1. A more detailed treatment of the WGCNA method can be found in refs 22 and 45.
To assess the potential associations between coexpressed gene clusters and survival/clinicopathological variables, a single-column vector called the module eigengene (ME) is utilized (Supplementary Figure 1, available at Carcinogenesis Online). The MEs are produced by retaining the first principal component following principal components analysis of the log2 normalized expression data for each group of coexpressed probesets across the 2342 sam-ples. As each ME contains the majority of variance within the raw data, it rep-resents a summary measure for the overall coexpression network. The degree to which a particular gene’s expression agrees to ME expression is known as the module membership. This measure of coexpression network centrality is determined via calculation of Pearson’s correlation coefficient (PCC) between each individual gene and ME. For example, if gene A is a member of the yel-low module, we would expect a PCC value approaching +1. The calculation of module membership allows probesets to be ranked according to their similarity to individual coexpression modules.
Survival analysis
Each data set has its own follow-up data specific to the requirements of that study, including one or more of DFS, DDFS and OS. Survival analysis was carried out via the ‘survival’ R package ( http://cran.r-project.org/web/pack-ages/survival/index.html). The hazard ratio (HR) was determined via a Cox regression model and survival curves were plotted from Kaplan–Meier esti-mates. For single-gene survival analysis, the data were dichotomized around the median expression of that gene within each individual study (to allow for interstudy variation) and all studies were subsequently combined to perform a meta-survival analysis (Supplementary Figure 1, available at Carcinogenesis Online). For multigene associations, each ME was dichotomized to high and low expression around its median value. DFS, DDFS and OS were used for survival endpoints when looking at breast cancer as a whole. To determine survival associations within the breast cancer subtypes (luminal A, luminal B, HER2+ and basal-like), DFS was used as the survival endpoint, where this was not available DDFS was used, and where neither was available OS was used.
at Trinity College Dublin on August 25, 2014
http://carcin.oxfordjournals.org/
Functional annotation
Gene ontology (GO) biological process enrichment analysis was carried out for coexpression modules via the DAVID bioinformatics tool (http://david. abcc.ncifcrf.gov/).
Database development
To accompany the findings from this study, an online database (http://glados. ucd.ie/Coexpression/) was developed to allow researchers in the breast can-cer community to access the underlying information in a user-friendly man-ner. The gene-centric database can be searched or browsed by gene of interest to locate coexpressed gene partners using the PCC or Spearman correlation coefficient. The HR and accompanying P-value from survival analysis for the DFS, DDFS or OS endpoints are returned. In addition to endpoints for breast cancer as whole, survival information for the four molecular subtypes can also be returned. An interactive network diagram is also constructed using the flash network viewer (46) and moving the mouse over the coexpressed genes presents the corresponding Kaplan–Meier survival curves. An example of the network diagram output provided by the database is shown in Supplementary Figure 2, available at Carcinogenesis Online.
Results
Identification of coexpressed gene clusters from the publicly available breast cancer microarray data set using WGCNA
Prior to WGCNA, probesets that had low expression and/or did not vary sufficiently across each of the 13 data sets were eliminated on a study-by-study basis. From the remaining probesets, we retained only those that were present on both the Affymetrix HG-U133A and HG-U133 Plus 2.0 microarray (these platforms have 22 277 probesets in common). A total of 6737 probesets met these criteria across the publically available data (n = 2342). At this stage, the data were fur-ther reduced by retaining only the 5500 probesets with the strongest
degree of coexpression across the data set (calculated by summing the coexpression similarity in each row of the adjacency matrix). From the remaining data (2342 samples × 5500 probesets), WGCNA elucidated 11 coexpressed modules ranging in size from 30 to 1020 probesets (Figure 1A, Supplementary Table 3 and Supplementary File 1, available at Carcinogenesis Online). A single group of 79 non-coexpressed probesets was also outputted. In this paper, we adopted the WGCNA developer’s rationale of assigning each coexpression module an arbitrary color for reference (with the non-coexpressed group designated as ‘gray’). To determine if there was any associa-tion with clinicopathological variables or survival using the PCC or Cox regression, respectively, principal components analysis was car-ried out to generate the MEs (Supplementary Table 3, available at
Carcinogenesis Online, shows the amount of variance captured for each ME). The MEs provide single-column summary measures of the overall information contained within each coexpression cluster to allow associations to be drawn. We also calculated the module mem-bership between each of the 5500 probesets and the coexpression modules (Supplementary File 1, available at Carcinogenesis Online).
Several coexpression modules are correlated to breast cancer clinicopathological variables
[image:3.612.52.538.373.683.2]To determine if any of the identified coexpression modules were associated with clinicopathological information, we calculated the PCC between the (undichotomized) MEs and age, tumor size, tumor grade, lymph node status and receptor expression (ER, HER2 and PR;
Figure 1B). The green (984 probesets) and yellow (723 probesets) mod-ules yielded significant although opposite PCCs with ER status (yel-low = −0.37; green = +0.57), PR status (yellow = −0.32; green = +0.5) and tumor grade (yellow = +0.56; green = −0.43). We also observed negative
Fig. 1. WGCNA identifies multiple coexpression modules several of which correlate with clinicopathological breast cancer variables. (A) Hierarchical cluster analysis dendrogram used to detect coexpression clusters along with corresponding color assignments. In total, 11 modules ranging from 30 to 1020 probesets in size were identified. The 79 probesets that were not coexpressed in the data set were assigned to the gray group. (B) PCC matrix between MEs and clinicopathological variables (tumor size and grade, LN status, age) and receptor expression (ER, HER2 and PR). The PCC values range from −1 to +1 depending on the strength of the relationship. A positive value indicates that the probesets within a particular coexpression module increase as the variable increases, whereas the opposite is true if the sign of the PCC is negative. Each PCC value is accompanied by the corresponding P-value in brackets.
at Trinity College Dublin on August 25, 2014
http://carcin.oxfordjournals.org/
correlations between the blue (PCC = −0.25) and black (PCC = −0.33) MEs and tumor grade. The magenta coexpression module was found to be associated solely with HER2 status (PCC = +0.3; Figure 1B).
WGCNA identifies gene modules with significant associations to DFS, DDFS and OS within the breast cancer data set
To identify associations between the coexpression modules and OS endpoints [DDFS (n = 977), DFS (n = 1454) and OS (n = 1054)] Cox regression was used to calculate the HR and accompanying P-value for each dichotomized ME (Table I). The yellow module was found to have significant associations with the three survival endpoints for breast cancer as a whole. Increased expression of those genes con-tained within the yellow module indicate poor prognosis with respect to OS (HR = 2.39, P = 1.57 × 10⁻¹⁰; Figure 2A), DDFS (HR = 1.89,
P = 1.13 × 10⁻⁶; Figure 2B) and DFS (HR = 1.97, P = 1.11 × 10⁻¹⁵;
Figure 2C). These results are consistent with this module correlating with higher tumor grade (PCC = +0.56; Figure 1B), low ER expres-sion (PCC = −0.37; Figure 1B) and low PR expression (PCC = −0.32;
Figure 1B). Following GO enrichment analysis, categories associ-ated with proliferation such as cell cycle and DNA replication were found to be over-represented within the yellow coexpression mod-ule (Figure 2D, Supplementary File 2, available at Carcinogenesis Online). We also assessed the association with survival between the yellow ME within each of the 13 publically available data sets for the OS endpoints and the results observed were consistent (Supplementary Table 4, available at Carcinogenesis Online). The cyan module (53 probesets) was also found to be associated with poor outcome for the OS (HR = 1.58, P = 4.75 × 10⁻⁴), DFS (HR = 1.31, P = 1.04 × 10⁻³)
and DDFS (HR = 1.37, P = 1.39 × 10⁻²) endpoints, however relatively
weak correlations with clinicopathological variables were observed (Figure 1B).
In contrast with the yellow module, the green module was correlated with lower tumor grade (PCC = −0.43) and high ER (PCC = +0.57) and PR (PCC = +0.5) expression (Figure 1B). As we might expect, increased expression of the green coexpression cluster (984 probesets) was associated with good prognosis for OS (HR = 0.68, P = 3.45 × 10⁻³)
and DDFS (HR = 0.76, P = 3.13 × 10⁻²; Table I). Upregulation of
the black module (206 probesets) also correlated with lower tumor grade (PCC = −0.33) and associated with good outcome for OS (HR = 0.54, P = 3.49 × 10⁻⁶), DFS (HR = 0.76, P = 8.38 × 10⁻⁴) and
DDFS (HR = 0.73, P = 1.28 × 10⁻²). Increased expression of the
pur-ple coexpression module (140 probesets) was exclusively associated with OS and indicated good prognosis (HR = 0.74, P = 2.05 × 10⁻²).
Validation of genes within coexpression modules associated with OS in an independent gene expression data set
To assess the utility of WGCNA as a means of identifying novel genes indicative of prognosis, we carried out survival analysis for probesets
contained within those coexpression modules associated with OS endpoints. Survival analysis was initially carried out for individual probesets within the publically available gene expression data set (n = 2342). The HRs and accompanying P-values for all 5500 probe-sets within the analysis against DFS, DDFS and OS can be found in
Supplementary File 1, available at Carcinogenesis Online. For those genes correlating with survival, we compared their prognostic perfor-mance within an independent in-house data set (n = 104) that was not used to generate the coexpression clusters.
Elevated expression of the yellow coexpression module (con-taining 723 probesets) was found to be indicative of poor outcome for the three OS endpoints across the publically available data set (n = 2342; Table I). The prognostic ability of the coexpression module with respect to OS was confirmed within the independent in-house data set (HR = 2.26, P = 0.03; Supplementary Table 4, available at Carcinogenesis Online). Single-gene survival analysis for OS identified 157 probesets (Supplementary Table 5, available at Carcinogenesis Online) that were significantly (P < 0.05) asso-ciated with poor outcome in both the publically available data set and also the independent data set (a HR of >1 was observed for 592/723 probesets in the independent data set). Several well-known proliferation markers such as MKI67, AURKA, AURKB, CCNE1, CDC20, MCM10 and MCM4 are significant in both data sets. We also identified several markers which to our knowledge have not been associated with OS in breast cancer previously. For example, high expression of the UBE2S gene was found to correlate with poor outcome for OS within the public data (HR = 2.38, P = 3.21 × 10⁻¹⁰;
Figure 3A) and the independent data set (HR = 3.01, P = 6.24 × 10⁻³;
Figure 3B).
Increased expression of the green coexpression module, containing 984 probesets, was found to be associated with good prognosis using OS as the endpoint in both the publically available data set (HR = 0.68,
P = 3.45 × 10⁻³) and independent in-house data set (HR = 0.26,
P = 2.18 × 10⁻⁴; data not shown). We again carried out survival
analysis for the individual probesets identifying 219 (Supplementary Table 6, available at Carcinogenesis Online) that were significantly associated (P < 0.05) with favorable breast cancer outcome within both data sets (852/984 probesets had a HR < 1 in the independent data set). This cluster also contained putative novel prognostic markers for breast cancer. For example, the furry homolog (FRY), a gene not previously associated with breast cancer in the literature, was found to be associated with favorable outcome within the main data set (HR = 0.55, P = 6.41 × 10⁻⁶; Figure 3C) and the independent data
set (HR = 0.29, P = 1.5 × 10⁻³; Figure 3D).
Identification of gene coexpression modules with significant breast cancer subtype-specific survival associations
In addition to survival analysis in breast cancer as a whole, we also determined if significant associations between the gene
Table I. Survival analysis for gene coexpression modules with DDFS, DFS and OS as endpoints No. of
probesets DDFS (n = 977) DFS (n = 1454) OS (n = 1054)
HR P-value CI HR P-value CI HR P-value CI
MEblack 206 0.73 1.28 × 10⁻² 0.57–0.93 0.76 8.38 × 10⁻⁴ 0.64–0.89 0.54 3.49 × 10⁻⁶ 0.42–0.7 MEblue 928 0.99 9.58 × 10⁻¹ 0.78–1.27 0.91 2.75 × 10⁻¹ 0.78–1.07 0.79 7.38 × 10⁻² 0.62–1.02 MEbrown 299 1.14 2.92 × 10⁻¹ 0.89–1.46 0.84 3.51 × 10⁻² 0.72–0.99 0.90 3.90 × 10⁻¹ 0.7–1.15 MEcyan 53 1.37 1.39 × 10⁻² 1.07–1.76 1.31 1.04 × 10⁻³ 1.12–1.54 1.58 4.75 × 10⁻⁴ 1.22–2.04 MEgreen 984 0.76 3.13 × 10⁻² 0.59–0.98 0.87 8.54 × 10⁻² 0.74–1.02 0.68 3.45 × 10⁻³ 0.53–0.88 MEgray 79 1.01 9.33 × 10⁻¹ 0.79–1.3 1.00 9.94 × 10⁻¹ 0.85–1.18 0.94 6.25 × 10⁻¹ 0.73–1.21 MEmagenta 30 1.33 2.29 × 10⁻² 1.04–1.71 1.05 5.24 × 10⁻¹ 0.9–1.24 1.14 2.98 × 10⁻¹ 0.89–1.47 MEorange 634 0.76 3.18 × 10⁻² 0.59–0.98 0.95 4.96 × 10⁻¹ 0.8–1.11 0.72 1.06 × 10⁻² 0.55–0.92 MEpurple 140 0.95 6.93 × 10⁻¹ 0.74–1.22 0.99 8.57 × 10⁻¹ 0.84–1.16 0.74 2.05 × 10⁻² 0.57–0.95 MEred 404 1.14 2.91 × 10⁻¹ 0.89–1.47 1.15 8.25 × 10⁻² 0.98–1.36 1.31 3.70 × 10⁻² 1.02–1.69 MEturquoise 1020 0.98 8.70 × 10⁻¹ 0.76–1.26 1.09 2.92 × 10⁻¹ 0.93–1.28 1.12 3.85 × 10⁻¹ 0.87–1.44 MEyellow 723 1.89 1.13 × 10⁻⁶ 1.46–2.45 1.97 1.11 × 10⁻¹⁵ 1.67–2.33 2.39 1.57 × 10⁻¹⁰ 1.83–3.13
Significant HRs (*P < 0.05) are given in bold. CI, 95% confidence interval; n = sample number.
at Trinity College Dublin on August 25, 2014
http://carcin.oxfordjournals.org/
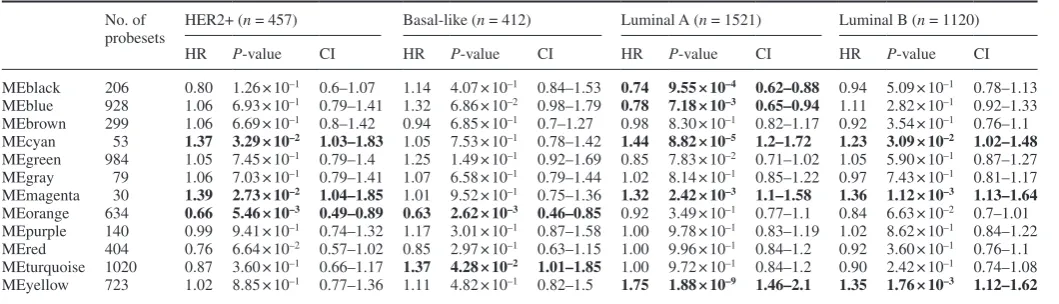
coexpression modules and the molecular subtypes could be found. Survival analysis identified a number of coexpression modules that were associated with survival within molecular subtypes and also modules associated with a single subtype (Table II). Increased expression of the black (206 probesets) and blue (containing 928 probesets) coexpression modules were found to be associated with good prognosis for the luminal A subtype (HR = 0.74, P = 9. 55 × 10–4 and HR = 0.78, P = 7.18 × 10⁻³, respectively). Following
GO enrichment analysis, both groups of genes were found to be enriched for similar biological processes including cell adhesion, cell motility and regulation of proliferation (Supplementary File 2, available at Carcinogenesis Online). For the luminal B subtype, poor survival was found to be associated with increased expression of three coexpression modules (cyan, magenta and yellow). The yellow module, while significant for all three OS endpoints (Table I), was found to be associated only with ER+ breast cancer, that is, the luminal A (HR = 1.75, P = 1.88 × 10⁻⁹) and luminal B (HR = 1.35,
P = 1. 76 × 10–3) subtypes.
Conversely, upregulation of those genes contained within the orange module was associated with good outcome exclusively for the non-luminal subtypes, that is, HER2+ (HR = 0.66, P = 5.46 × 10⁻³)
and basal-like (HR = 0.63, P = 2.62 × 10⁻³). GO enrichment analysis
revealed the over-representation of genes related to immune response (Supplementary File 2, available at Carcinogenesis Online); these findings are in agreement with previous studies on ER− breast can-cer subtypes (47). An increase in expression of the magenta module (containing 30 probesets) was found to be associated with poor out-come within the HER2+ (HR = 1.39, P = 2.73 × 10⁻²) and also the
luminal A (HR = 1.32, P = 2.42 × 10⁻³) and luminal B (HR = 1.36,
P = 1.12 × 10⁻³) subtypes. High expression of the turquoise module
(containing 1020 probesets) was found to indicate poor prognosis exclusively for the basal-like subtype (HR = 1.37, P = 4.28 × 10⁻²).
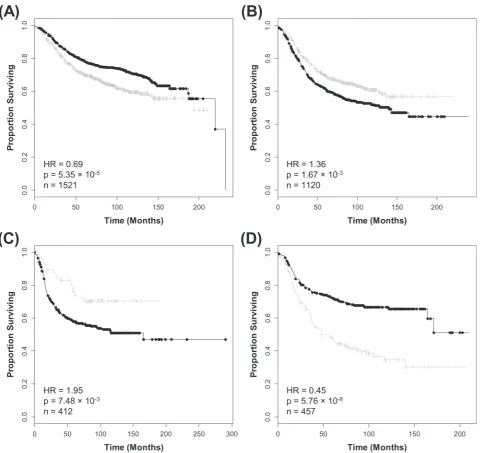
[image:5.612.56.538.53.494.2]We also calculated HRs and accompanying P-values to highlight single probeset markers for the luminal A, luminal B, HER2+ and basal-like subtypes (Supplementary File 1, available at Carcinogenesis Online). We were unable to compare the results for individual genes
Fig. 2. Elevated expression of the yellow ME, a group of coexpressed probesets related to cell proliferation indicates poor outcome in breast cancer. Kaplan– Meier survival plots for (A) OS, (B) DDFS and (C) DFS. Increased expression (black) of this coexpressed group is associated with poor outcome in breast cancer as a whole. (D) GO enrichment analysis for the 723 probesets comprising the yellow module identifies multiple processes related to cell proliferation. The original significance outputted from DAVID for GO biological processes were transformed to ‘–log(P-value)’ for plotting (Supplementary File 2, available at Carcinogenesis Online).
at Trinity College Dublin on August 25, 2014
http://carcin.oxfordjournals.org/
to the in-house data set with respect to molecular subtypes due to sam-ple numbers. Analysis of blue module probesets within the luminal A group highlighted a number of single-gene indicators including PDZ and LIM domain 4 (PDLIM4), a candidate tumor suppressor gene downregulated in prostate cancer (48) and thought to be suppressed via hypermethylation in breast cancer (49). PDLIM4 is particularly interesting as increased expression of this gene is indicative of good prognosis within the luminal A subtype (HR = 0.69, P = 5.35 × 10⁻⁵;
Figure 4A) and luminal B subtypes (HR = 0.80, P = 2.41 × 10⁻²),
while the opposite relationship is observed for basal-like breast can-cer (HR = 1.58, 3.34 × 10⁻³). The forkhead box protein M1 (FOXM1)
gene was associated with poor outcome within the luminal B molec-ular subtype (HR = 1.36, P = 1.67 × 10⁻³; Figure 4B). This result
confirms the utility of the approach as FOXM1 is a well-studied tran-scription factor with roles in various cancers including breast cancer (50). For the turquoise coexpression module, we identified a number of genes where increased expression correlated with poor prognosis
exclusively for the basal-like molecular subtype. For example, the potassium channel, subfamily K, member 5 (KCNK5) gene when highly expressed was associated with poor survival (HR = 1.95,
P = 7.48 × 10⁻³; Figure 4C). The orange module, a group of genes
enriched for GO immune system processes (Supplementary File 2, available at Carcinogenesis Online), was indicative of good outcome for both HER2+ and basal-like breast cancers. Once again, individual probesets within this module follow a similar pattern to that of the coexpression cluster, for instance, CD53 had significant associations with good prognosis for both the HER2+ (HR = 0.45, P = 5.76 × 10⁻⁸;
Figure 4D) and basal-like subtypes (HR = 0.58, P = 4 × 10⁻⁴;
Supplementary Table 1, available at Carcinogenesis Online).
Discussion
[image:6.612.78.560.52.504.2]We have utilized a coexpression-based method to analyze a messen-ger RNA expression data set containing 2342 breast cancer samples
Fig. 3. Consistent associations between OS and the UBE2S and FRY genes are observed across the main data set and an independent in-house data set. (A) Kaplan–Meier survival plot for OS within the main data set. Increased expression (black) of UBE2S indicates poor prognosis. (B) Kaplan–Meier survival plot for OS for UBE2S within the independent data set, again increased expression (black) of this gene is indicative of poor outcome. (C) Kaplan–Meier survival plot for OS indicating that elevated expression (black) of the FRY gene within the main data set indicates good prognosis. (D) Kaplan–Meier survival plot for OS demonstrating that high FRY expression (black) is also indicative of good prognosis in the independent data set.
at Trinity College Dublin on August 25, 2014
http://carcin.oxfordjournals.org/
to identify genes correlating with clinical variables and associated with prognosis. The diversity of the patient cohort under investiga-tion captures the heterogeneous nature of breast cancer and identifies gene candidates with a high degree of statistical power. The WGCNA approach is ideally suited to the analysis of such data sets. The under-lying philosophy of the algorithm turns the complexity of the data set into an advantage to elucidate gene relationships above the level of noise and remain constant across all samples. The unsupervised nature of WGCNA avoids subjective decisions and potential biases associated with defining control samples for supervised approaches or selecting genes previously associated with breast cancer. This is of particular relevance when focusing on the less common basal-like subtype as it is not characterized by any of those genes utilized in pre-vious coexpression analyses (e.g. AURKA, ESR1 or ERRB2).
In this study, we identified 11 distinct coexpression modules from 5500 probesets that passed our pre-filtering criteria for WGCNA anal-ysis. A comparison measure known as the ME was calculated to assess the relevance of each gene cluster in terms of the clincopathological variables and survival endpoints using the PCC and Cox regression, respectively. As one might expect the associations observed between these two analyses are not mutually exclusive in that where we observed a meaningful association with a clinical variable, the module tended to be significant for survival (although the opposite was not always the case). Increased association of the yellow module comprised of 723 probesets and enriched for genes related to cellular proliferation cor-related with higher tumor grade and was associated with lower ER and PR expression. Well-known breast cancer biomarkers including
AURKA (utilized as a ‘prototype’ gene in the Wirapati coexpression study) (20) and MKI67 were present within this gene cluster along with
UBE2S, a potential novel marker that was validated in our independent data set. As we would expect, this coexpressed gene cluster involved in cell growth was significantly associated with poor outcome for the DFS, DDFS and OS endpoints. Although significant associations with survival between the yellow module and luminal A and luminal B sub-types were observed, there was no significant association with basal-like and HER2+, perhaps indicating the difficulty in characterizing these subtypes. Following survival analysis of single genes within the yellow module against the main data set and within an independent data set, we observed that ~22% genes were significant in both data sets for OS. Considering the relatively small size and/or potential sam-ple bias within the in-house breast cancer data set, we would not expect to see 100% concordance in gene significance. Our aim here was to demonstrate that genes within coexpressed clusters are significant and also prioritize novel genes through comparison with an independent data set. Perhaps the most compelling observation is that following evaluation of the HRs between the public data set and the independent data set, a similar trend (a HR > 1 for the OS endpoint) was observed for ~82% (592/723) of the probesets in the yellow module.
Increased expression of the green coexpression module and clini-cal variables was found to be associated with positive ER and PR receptor expression along with lower tumor grade. Elevated expres-sion of genes within the green module was also found to be indica-tive of good prognosis for DDFS and OS. These associations are the reverse of those observed for the yellow module and as we would expect the increased expression of green module genes including
GATA3, CA12 and ESR1 (another of the prototype genes utilized in the Wirapati study) (21) are associated with favorable outcome. The green module contained several genes that were previously linked to breast cancer outcome including the leucine-rich repeats and immunoglobulin-like domains 1 (LRIG1), a protein known to be involved in growth factor signaling (51). Recent studies have linked increased LRIG1 expression with good DFS outcome in ER+ breast cancer (52), negative regulation of receptor tyrosine kinases (53) and ErbB signaling (54). Following comparison of single-gene survival analyses to the independent testing data set, we highlighted a gene from this module, FRY, as a potential novel prognostic biomarker. In total ~22% of genes from this group were found to significantly correlate to survival in the independent data set (with 852/984 probesets returning a HR < 1 for the OS end-point), once again identifying novel genes and demonstrating the utility of the approach.
The magenta module containing 30 probesets including one tar-geting the ERBB2/HER2 gene was the only coexpression cluster found to correlate with HER2+ status. Upregulation of this module and another relatively small module, cyan, were found to corre-late with poor prognosis for 3/4 molecular subtypes (luminal A, luminal B and HER2+). Perhaps, the utility of this coexpression analysis is exemplified by the molecular subtype-specific survival association of the increased turquoise module expression with poor outcome exclusively for the basal-like breast cancer subtype. From this module, we have highlighted the significant association between the potential novel marker, KCNK5, and poor outcome within the basal-like molecular subtype. We expect that this work will prove particularly useful for researchers currently focusing on the difficult to treat basal-like tumors, considering the current paucity of useful makers within this subtype. We also found that increased expression of genes within the orange module contain-ing 634 probesets indicated good prognosis within the HER2+ and basal-like subset. Closer examination of the orange module revealed the enrichment of genes involved in the immune process related GO categories. Furthermore, we demonstrated the correla-tion of the CD53 gene with good prognosis in both the HER2+ and basal-like subtypes.
[image:7.612.36.566.73.225.2]In summary, we have identified 11 gene coexpression clusters from a large-scale breast cancer data set using WGCNA. We asso-ciated a number of these network modules to clinicopathological
Table II. Breast cancer molecular subtype survival analysis for gene coexpression modules No. of
probesets
HER2+ (n = 457) Basal-like (n = 412) Luminal A (n = 1521) Luminal B (n = 1120)
HR P-value CI HR P-value CI HR P-value CI HR P-value CI
MEblack 206 0.80 1.26 × 10⁻¹ 0.6–1.07 1.14 4.07 × 10⁻¹ 0.84–1.53 0.74 9.55 × 10⁻⁴ 0.62–0.88 0.94 5.09 × 10⁻¹ 0.78–1.13 MEblue 928 1.06 6.93 × 10⁻¹ 0.79–1.41 1.32 6.86 × 10⁻² 0.98–1.79 0.78 7.18 × 10⁻³ 0.65–0.94 1.11 2.82 × 10⁻¹ 0.92–1.33 MEbrown 299 1.06 6.69 × 10⁻¹ 0.8–1.42 0.94 6.85 × 10⁻¹ 0.7–1.27 0.98 8.30 × 10⁻¹ 0.82–1.17 0.92 3.54 × 10⁻¹ 0.76–1.1 MEcyan 53 1.37 3.29 × 10⁻² 1.03–1.83 1.05 7.53 × 10⁻¹ 0.78–1.42 1.44 8.82 × 10⁻⁵ 1.2–1.72 1.23 3.09 × 10⁻² 1.02–1.48 MEgreen 984 1.05 7.45 × 10⁻¹ 0.79–1.4 1.25 1.49 × 10⁻¹ 0.92–1.69 0.85 7.83 × 10⁻² 0.71–1.02 1.05 5.90 × 10⁻¹ 0.87–1.27 MEgray 79 1.06 7.03 × 10⁻¹ 0.79–1.41 1.07 6.58 × 10⁻¹ 0.79–1.44 1.02 8.14 × 10⁻¹ 0.85–1.22 0.97 7.43 × 10⁻¹ 0.81–1.17 MEmagenta 30 1.39 2.73 × 10⁻² 1.04–1.85 1.01 9.52 × 10⁻¹ 0.75–1.36 1.32 2.42 × 10⁻³ 1.1–1.58 1.36 1.12 × 10⁻³ 1.13–1.64 MEorange 634 0.66 5.46 × 10⁻³ 0.49–0.89 0.63 2.62 × 10⁻³ 0.46–0.85 0.92 3.49 × 10⁻¹ 0.77–1.1 0.84 6.63 × 10⁻² 0.7–1.01 MEpurple 140 0.99 9.41 × 10⁻¹ 0.74–1.32 1.17 3.01 × 10⁻¹ 0.87–1.58 1.00 9.78 × 10⁻¹ 0.83–1.19 1.02 8.62 × 10⁻¹ 0.84–1.22 MEred 404 0.76 6.64 × 10⁻² 0.57–1.02 0.85 2.97 × 10⁻¹ 0.63–1.15 1.00 9.96 × 10⁻¹ 0.84–1.2 0.92 3.60 × 10⁻¹ 0.76–1.1 MEturquoise 1020 0.87 3.60 × 10⁻¹ 0.66–1.17 1.37 4.28 × 10⁻² 1.01–1.85 1.00 9.72 × 10⁻¹ 0.84–1.2 0.90 2.42 × 10⁻¹ 0.74–1.08 MEyellow 723 1.02 8.85 × 10⁻¹ 0.77–1.36 1.11 4.82 × 10⁻¹ 0.82–1.5 1.75 1.88 × 10⁻⁹ 1.46–2.1 1.35 1.76 × 10⁻³ 1.12–1.62
Significant HRs (*P < 0.05) are given in bold. CI, 95% confidence interval; n = sample number.
at Trinity College Dublin on August 25, 2014
http://carcin.oxfordjournals.org/
variables as well as DFS, DDFS and OS. We demonstrated the prognostic relevance of single genes within significant groups against an in-house independent gene expression data set. In addi-tion, we were able to identify coexpression network modules indicative of patient outcome for luminal A, luminal B, HER2+ and basal-like molecular subtypes. In some cases, modules were corre-lated with survival in a subtype-specific manner and it is expected that some individual genes contained with these modules will also validate in independent data sets. WGCNA is a powerful method to investigate underlying biological mechanisms and to identify genes indicative of patient outcome in large-scale cancer gene expression data sets. The practical utility of this approach is exem-plified through the identification of novel prognostic makers via guilt-by-association with well-established markers such as MKI67 and AURKA. We have developed an online database (http://glados. ucd.ie/Coexpression/) enabling user-friendly identification of novel
genes providing a valuable resource for the breast cancer research community.
Supplementary material
Supplementary Figures 1 and 2 and Supplementary Tables 1–6 can be found at http://carcin.oxfordjournals.org/
Supplementary Files 1 and 2 are available from http://www.nicb.dcu. ie/WGCNA_BC_Supp_data/Supplementary_File_1.xlsx and http:// www.nicb.dcu.ie/WGCNA_BC_Supp_data/Supplementary_File_2. xlsx, respectively.
Funding
[image:8.612.78.559.53.506.2]Science Foundation Ireland (07/IN.1/B1323, 08/SRC/B1410); FP7 Collaborative Health programme, RATHER.
Fig. 4. Individual genes within coexpression modules linked to subtype survival also correlate to outcome. (A) Kaplan–Meier survival plot for the PDLIM4 gene (a member of the blue coexpression module) for the luminal A subtype. Increased expression this gene (black) indicates good prognosis. (B) Kaplan–Meier survival plot for the FOXM1 gene (a member of the yellow coexpression module) within the luminal B subtype. Increased expression (black) of this gene indicates poor prognosis. (C) Kaplan–Meier survival plot for the KCNK5 gene (a member of the turquoise coexpression module) within the basal-like subtype. Increased expression (black) of this indicates poor prognosis. (D) Kaplan–Meier survival plot for the CD53 gene (a member of the orange coexpression module) within the HER2+ molecular subtype. Increased expression (black) of this gene indicates good prognosis.
at Trinity College Dublin on August 25, 2014
http://carcin.oxfordjournals.org/
Acknowledgements
The authors wish to acknowledge the FP7 Collaborative Health programme, RATHER (www.ratherproject.com) for additional funding.
Conflict of Interest Statement: None declared.
References
1. Goldhirsch,A. et al. (2009) Thresholds for therapies: highlights of the St Gallen International Expert Consensus on the primary therapy of early breast cancer 2009. Ann. Oncol., 20, 1319–1329.
2. Perou,C.M. et al. (2000) Molecular portraits of human breast tumours. Nature, 406, 747–752.
3. Curtis,C. et al. (2012) The genomic and transcriptomic architecture of 2,000 breast tumours reveals novel subgroups. Nature, 486, 346–352. 4. Network,T.C.G.A. (2012) Comprehensive molecular portraits of human
breast tumours. Nature, 490, 61–70.
5. van ‘t Veer,L.J. et al. (2002) Gene expression profiling predicts clinical outcome of breast cancer. Nature, 415, 530–536.
6. Paik,S. et al. (2004) A multigene assay to predict recurrence of tamoxifen-treated, node-negative breast cancer. N. Engl. J. Med., 351, 2817–2826. 7. Schmid,P.R. et al. (2012) Making sense out of massive data by going
beyond differential expression. Proc. Natl Acad. Sci. USA, 109, 5594–5599. 8. Rhodes,D.R. et al. (2004) Large-scale meta-analysis of cancer microarray
data identifies common transcriptional profiles of neoplastic transforma-tion and progression. Proc. Natl Acad. Sci. USA, 101, 9309–9314. 9. Xu,L. et al. (2007) Large-scale integration of cancer microarray data
iden-tifies a robust common cancer signature. BMC Bioinformatics, 8, 275. 10. Botling,J. et al. (2013) Biomarker discovery in non-small cell lung cancer:
integrating gene expression profiling, meta-analysis, and tissue microarray validation. Clin. Cancer Res., 19, 194–204.
11. Alles,M.C. et al. (2009) Meta-analysis and gene set enrichment relative to er status reveal elevated activity of MYC and E2F in the “basal” breast cancer subgroup. PLoS One, 4, e4710.
12. Mehra,R. et al. (2005) Identification of GATA3 as a breast cancer prog-nostic marker by global gene expression meta-analysis. Cancer Res., 65, 11259–11264.
13.Madden,S.F. et al. (2013) BreastMark: an integrated approach to mining publicly available transcriptomic datasets relating to breast cancer out-come. Breast Cancer Res., in press.
14. Györffy,B. et al. (2010) An online survival analysis tool to rapidly assess the effect of 22,277 genes on breast cancer prognosis using microarray data of 1,809 patients. Breast Cancer Res. Treat., 123, 725–731.
15. Stuart,J.M. et al. (2003) A gene-coexpression network for global discovery of conserved genetic modules. Science, 302, 249–255.
16. Oldham,M.C. et al. (2006) Conservation and evolution of gene coexpres-sion networks in human and chimpanzee brains. Proc. Natl Acad. Sci. USA, 103, 17973–17978.
17. Oldham,M.C. et al. (2008) Functional organization of the transcriptome in human brain. Nat. Neurosci., 11, 1271–1282.
18. Clarke,C. et al. (2011) Large scale microarray profiling and coexpression network analysis of CHO cells identifies transcriptional modules associ-ated with growth and productivity. J. Biotechnol., 155, 350–359. 19. Wang,L. et al. (2009) Gene networks and microRNAs implicated in
aggres-sive prostate cancer. Cancer Res., 69, 9490–9497.
20. Horvath,S. et al. (2006) Analysis of oncogenic signaling networks in glio-blastoma identifies ASPM as a molecular target. Proc. Natl Acad. Sci. USA, 103, 17402–17407.
21. Wirapati,P. et al. (2008) Meta-analysis of gene expression profiles in breast cancer: toward a unified understanding of breast cancer subtyping and prognosis signatures. Breast Cancer Res., 10, R65.
22. Zhang,B. et al. (2005) A general framework for weighted gene co-expres-sion network analysis. Stat. Appl. Genet. Mol. Biol., 4, Article 17. 23. Desmedt,C. et al. (2009) The Gene expression Grade Index: a potential
predictor of relapse for endocrine-treated breast cancer patients in the BIG 1-98 trial. BMC Med. Genomics, 2, 40.
24. Desmedt,C. et al. (2007) Strong time dependence of the 76-gene prognos-tic signature for node-negative breast cancer patients in the TRANSBIG multicenter independent validation series. Clin. Cancer Res., 13, 3207–3214.
25. Loi,S. et al. (2008) Predicting prognosis using molecular profiling in estrogen receptor-positive breast cancer treated with tamoxifen. BMC Genomics, 9, 239.
26. Miller,L.D. et al. (2005) An expression signature for p53 status in human breast cancer predicts mutation status, transcriptional effects, and patient survival. Proc. Natl Acad. Sci. USA, 102, 13550–13555.
27. Pawitan,Y. et al. (2005) Gene expression profiling spares early breast can-cer patients from adjuvant therapy: derived and validated in two popula-tion-based cohorts. Breast Cancer Res., 7, R953–R964.
28. Sabatier,R. et al. (2011) A gene expression signature identifies two prog-nostic subgroups of basal breast cancer. Breast Cancer Res. Treat., 126, 407–420.
29. Schmidt,M. et al. (2008) The humoral immune system has a key prognostic impact in node-negative breast cancer. Cancer Res., 68, 5405–5413. 30. Wang,Y. et al. (2005) Gene-expression profiles to predict distant
metastasis of lymph-node-negative primary breast cancer. Lancet, 365, 671–679.
31. Zhang,Y. et al. (2009) The 76-gene signature defines high-risk patients that benefit from adjuvant tamoxifen therapy. Breast Cancer Res. Treat., 116, 303–309.
32. Kao,K.J. et al. (2011) Correlation of microarray-based breast cancer molecular subtypes and clinical outcomes: implications for treatment opti-mization. BMC Cancer, 11, 143.
33. Bos,P.D. et al. (2009) Genes that mediate breast cancer metastasis to the brain. Nature, 459, 1005–1009.
34. Sircoulomb,F. et al. (2010) Genome profiling of ERBB2-amplified breast cancers. BMC Cancer, 10, 539.
35. Nagalla,S. et al. (2013) Interactions between immunity, proliferation and molecular subtype in breast cancer prognosis. Genome Biol., 14, R34. 36. Irizarry,R.A. et al. (2003) Exploration, normalization, and summaries
of high density oligonucleotide array probe level data. Biostatistics, 4, 249–264.
37. Johnson,W.E. et al. (2007) Adjusting batch effects in microarray expres-sion data using empirical Bayes methods. Biostatistics, 8, 118–127. 38. Sorlie,T. et al. (2003) Repeated observation of breast tumor subtypes in
independent gene expression data sets. Proc. Natl Acad. Sci. USA, 100, 8418–8423.
39. Hu,Z. et al. (2006) The molecular portraits of breast tumors are conserved across microarray platforms. BMC Genomics, 7, 96.
40. Parker,J.S. et al. (2009) Supervised risk predictor of breast cancer based on intrinsic subtypes. J. Clin. Oncol., 27, 1160–1167.
41. Martinez,V. et al. (2008) Drug metabolism-related genes as potential bio-markers: analysis of expression in normal and tumour breast tissue. Breast Cancer Res. Treat., 110, 521–530.
42. Langfelder,P. et al. (2008) WGCNA: an R package for weighted correlation network analysis. BMC Bioinformatics, 9, 559.
43. Mason,M.J. et al. (2009) Signed weighted gene co-expression network analysis of transcriptional regulation in murine embryonic stem cells. BMC Genomics, 10, 327.
44. Ravasz,E. et al. (2002) Hierarchical organization of modularity in meta-bolic networks. Science, 297, 1551–1555.
45. Horvath,S. et al. (2008) Geometric interpretation of gene coexpression net-work analysis. PLoS Comput. Biol., 4, e1000117.
46. Dannenfelser,R. et al. (2011) FNV: light-weight flash-based network and pathway viewer. Bioinformatics, 27, 1181–1182.
47. Teschendorff,A.E. et al. (2007) An immune response gene expression mod-ule identifies a good prognosis subtype in estrogen receptor negative breast cancer. Genome Biol., 8, R157.
48. Vanaja,D.K. et al. (2009) PDLIM4, an actin binding protein, suppresses prostate cancer cell growth. Cancer Invest., 27, 264–272.
49. Xu,J. et al. (2012) Methylation of HIN-1, RASSF1A, RIL and CDH13 in breast cancer is associated with clinical characteristics, but only RASSF1A methylation is associated with outcome. BMC Cancer, 12, 243.
50. Koo,C.Y. et al. (2012) FOXM1: From cancer initiation to progression and treatment. Biochim. Biophys. Acta, 1819, 28–37.
51. Hedman,H. et al. (2007) LRIG inhibitors of growth factor signalling - dou-ble-edged swords in human cancer? Eur. J. Cancer, 43, 676–682. 52. Krig,S.R. et al. (2011) Lrig1 is an estrogen-regulated growth suppressor
and correlates with longer relapse-free survival in ERα-positive breast can-cer. Mol. Cancer Res., 9, 1406–1417.
53. Bai,L. et al. (2012) LRIG1 modulates cancer cell sensitivity to Smac mimetics by regulating TNFα expression and receptor tyrosine kinase sign-aling. Cancer Res., 72, 1229–1238.
54. Powell,A.E. et al. (2012) The pan-ErbB negative regulator Lrig1 is an intestinal stem cell marker that functions as a tumor suppressor. Cell, 149, 146–158.
Received February 5, 2013; revised May 16, 2013; accepted May 30, 2013
at Trinity College Dublin on August 25, 2014
http://carcin.oxfordjournals.org/