Abstract — The first part of this work focuses on the implementation of a modified Activated Sludge Model No. 3 in the Benchmark Simulation Model No. 1. The mathematical model includes two additional processes that describe the direct growth of the heterotrophic biomass on readily biodegradable substrate, in both anoxic and oxic conditions. For a better representation of the real plant behavior, the secondary settler is considered to be reactive. The reactive settler model is a combination of the Takács settler model and the activated sludge model. The second part of the paper presents the implementation of two control strategies on the simulated wastewater treatment plant. The control architectures are assessed from an operational costs point of view, and improved by adding another level of control. The upper control level dictates the optimal set-point for the two control structures by taking into consideration the influent ammonia nitrogen concentration in the aerated part of the wastewater treatment plant. The simulations showed that by using this improved control structure the operational costs can be significantly reduced.
Index Terms— ASM3, BSM1, MPC, PI, Reactive Settler
I. INTRODUCTION
HE most widely used method for wastewater treatment is the activated sludge process (ASP). The ASP is characterized by its intricate behavior and nonlinearity, making it hard to control and predict. Mathematical models have become important tools for process prediction and
This work was supported by the Sectoral Operational Program for Human Resources Development 2007-2013, Contract no.: POSDRU/88/1.5/S/60185–“Innovative doctoral studies in a Knowledge Based Society “.
George S. Ostace is with Babes-Bolyai University, Faculty of Chemistry and Chemical Engineering, 11 Arany Janos, 400028 Cluj-Napoca, Romania, phone: +40-264-593.833 int.5659; fax: +40-264-590818; e-mail: george.ostace@ ubbcluj.ro.
Anca Gal is with Babes-Bolyai University, Faculty of Chemistry and Chemical Engineering, 11 Arany Janos, 400028 Cluj-Napoca, Romania, e-mail: [email protected].
Vasile M. Cristea is with Babes-Bolyai University, Faculty of Chemistry and Chemical Engineering, 11 Arany Janos, 400028 Cluj-Napoca, Romania, e-mail: mcristea@ chem.ubbcluj.ro.
Paul S. Agachi is with Babes-Bolyai University, Faculty of Chemistry and Chemical Engineering, 11 Arany Janos, 400028 Cluj-Napoca, Romania, e-mail: serban.agachi@ ubbcluj.ro.
development of new control strategies meant to reduce effluent pollutants and operational costs.
The current state of biological wastewater treatment modeling consists in the Activated Sludge Model Suite which includes the Activated Sludge Model No. 1, 2, 2d and 3 (ASM1, ASM2, ASM2d, ASM3). The ASM1 was first presented in 1987 by Henze et al. [1] and is mainly used for municipal activated sludge wastewater treatment plants and it describes the removal of organic carbon and ammonium nitrogen. ASM1 is based on eight biological processes that describe the growth and decay of heterotrophic and autotrophic bacteria that are involved in the activated sludge processes.
In 1995, Henze et al. [2], presented the ASM2, which is a mathematical model for the ASP that also includes phosphorus removal. Later, this model was further improved by Henze et al. in [3], and named ASM2d, a model similar to the ASM2, but with the storage of poly-phosphate under anoxic conditions incorporated.
The ASM3 was introduced by Gujer et al. [4] in 1999 and it is the first activated sludge model that considers the internal storage of rapidly biodegradable substrate by the heterotrophic biomass. The model is developed to describe the removal of organic carbon and ammonium nitrogen and is more complex than the ASM1. All these models have suffered extensions over the past years [5]-[17].
The ASM3 assumes that the preliminary step for the heterotrophic growth is the internal storage of rapidly biodegradable substrate, and the growth of the heterotrophic biomass takes place only on the stored products. Experimental data [18]-[20] proved that this is not a valid mechanism, the stored polymers being used for growth by the heterotrophic bacteria only after the depletion of the primary substrate. Therefore, the first aim of this work is to implement a modified ASM3 in the Benchmark Simulation Model No. 1 (BSM1) considering the direct growth of the heterotrophic biomass on the primary substrate and on the internal storage products.
Wastewater treatment plants (WWTPs) should be controlled in a way that minimizes plant operating costs (OC), while effluent standards are carefully maintained [21]. The performance of WWTPs has been improved over the years by using automatic control systems [22] [23]. Attention has been also paid to set-point optimization [21] [24], in order to improve control performance.
The second objective of this research is to investigate and propose a set-point optimisation scheme for two control strategies of the WWTP. The improved architecture is intended to reduce the operational costs by manipulating the set-point of these control structures.
Operational Costs Reduction for the WWTP by
Means of Substrate to Dissolved Oxygen
Correlation – A Simulation Study
George S. Ostace, Anca Gal, Vasile M. Cristea, Paul S. Agachi
II. MATERIALS AND METHODS
The simulation model and the control strategies were implemented in the Matlab/Simulink™ platform. In order to reduce the simulation time and spare the computer resources, the mathematical model was written in C programming language and compiled toa Matlab executable file. The simulations were performed on an Intel(R) Core(TM)
2 Quad CPU Q 6600 2.4GHz with 3.00 GB RAM, on a Windows XP SP3 platform.
III. BENCHMARK DEVELOPMENT
A. Benchmark Simulation Model No. 1
The Benchmark Simulation Model No. 1 wastewater treatment plant was developed by The International Association of Water Quality (IAWQ) and European Cooperation, in the field of Scientific and Technical Research (COST) 624 group in 2002 [25]. The purpose of the BSM1 is to study control strategies for biological wastewater treatment plants. The wastewater treatment plant the BSM1 is based on is as a Modified Ludzak-Ettinger (MLE) process. The MLE is one of the most common architectures used for biological nitrogen removal in municipal wastewater treatment.
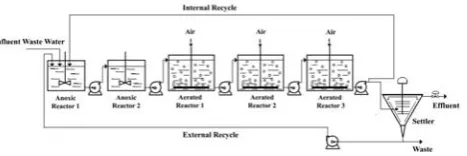
The BSM1 plant has five biological reactors arranged in series (Fig. 1). The first two reactors are anoxic and each has a volume of 1000 m3. The last three reactors are aerated,
each of them with a volume of 1333 m3. The total biological
volume is 6000 m3.
The reactors are followed by a secondary settler that has a depth of 4 m and a cross-section of 1500 m2.
The plant has two recycle flows:
The sludge recycle flow, from the bottom of the settler to the first anoxic tank Qrs = 18446 m3 day-1.
The nitrates recycle flow, from the last aerated reactor to the first anoxic tank Qa = 55338 m3 day-1.
The aeration is indirectly manipulated using the oxygen transfer coefficient (KLa) which is constrained to a
maximum of 240 day-1.
The waste flow rate (Qw) is set to 358 m3day-1 to ensure a
[image:2.595.51.285.564.642.2]sludge age close to 8 days just like for the original BSM1.
Fig. 1. Layout of the BSM1 benchmark simulation plant
B. Reactive settler model
The BSM1 considers that no biological activity occurs in the secondary settler. The present study assumes the secondary settler to be reactive in order to achieve a better agreement between real WWTP behaviour and the model.
The reactive settler model is built by combining the model described by Takács et. al [26] with the activated sludge model [27] [28]. The Takács settler model is one-dimensional and predicts the solids concentration in the settler, by dividing it into 10 layers of constant thickness. A
solids balance is performed around each hypothetical layer in order to predict the suspended solids concentration in the settler. The continuity equation for the reactive settler is formulated as:
X
X J
R 0
t z
(1)
where: X is the suspended component concentration [g/m3]; t – time [h]; J – solids flux [g/(h×m2)]; z – layer height [m]; RX – conversion rate of the suspended component.
The reactive settler model parameters and default values are the same as the ones proposed in the BSM1 [25].
C. Model description
The studied model has the same components as the original ASM3. The difference consists of two dynamic processes that are added to the original ASM3. These two processes describe the direct growth on readily biodegradable substrate of the heterotrophic biomass in both anoxic and oxic conditions.
The processes that describe the heterotrophic growth on the internal storage products have an additional switch function KS/(KS+SS) that inhibits the process when the
biodegradable substrate is available. In this way, the growth on internal storage polymers occurs only after the depletion of the primary substrate.
TABLEI
NEW DYNAMIC PROCESSES INCLUDED IN THE ASM3
j PROCESS Process Rate Equation
1 Aerobic Growth on SS
H S S
S Alk Alk
Alk SNH NH
SNH O O
O
H X
S K
S S K
S S K
S S K
S
4 4
4
2 2
2
2 Anoxic Growth on SS
H S S
S
Alk Alk
Alk
SNH NH
SNH
NO NOx
NO
O O
O
H X
S K
S S K
S S K
S S K
S S K
K
4 4
4
2 2
2
TABLEII
STOICHIOMETRIC MATRIX OF THE NEW PROCESSES
j SS SO2 SNO SNH SAlk XH
1
H Y
1
H H
Y Y
1 iN.BN
14 86 . 2 14
1 N.BN
H H i
Y Y
1
2
H Y
1
H H Y Y 86 . 2
1 iN.BN
14 .BN N i
1
TABLEIII
KINETIC AND STOICHIOMETRIC COEFFICIENTS OF THE NEW PROCESSES
PARAMETER
DESCRIPTION SYMBOL VALUE UNIT
Maximum XH growth rate μH 4.00 Day-1
Saturation constant for SO2 KO2 0.20 g O2/m3
Saturation constant for SNH4 KNH4 0.01 g N/m3
Saturation constant for SAlk KAlk 0.10 mole HCO-3
Saturation constant for SS KS 2.00 g COD/m3
Saturation constant for SNO KNOx 0.50 g N/m3
Yield of XH for direct growth YH 0.67 g COD/g N
Anoxic reduction factor η 0.60 -
N content of biomass XH iN.BN 0.07 g N/g COD
[image:2.595.307.566.604.715.2]used parameter, respectively. The rest of the stoichiometric relationships of the model processes are identical to those of the original ASM3. All the remaining kinetic and stoichiometric coefficients used in the model and not presented in Table III have the same values that were proposed by Gujer et al. [4], considered at a temperature of 15ºC.
D. Influent composition
The influent composition for the present study was generated with the three influent files provided by the BSM1, originally designed for the ASM1. These three influent files provide input data of dry weather, rain weather and storm weather for a period of 14 days of operation, at an interval of 15 minutes and mimic dry weather, rain weather and storm weather conditions.
In order to couple these influent files with the modified ASM3, the following assumptions were made:
The readily biodegradable substrate concentration SS, which is the growth substrate for the heterotrophic
biomass, has the same value as for the ASM1.
The total input nitrogen in the ASM3 is equal to the total nitrogen in the ASM1 influent. ASM3 does not include the particulate biodegradable organic nitrogen XND and the soluble biodegradable organic
nitrogen SND. These two components are transformed
into ammonia nitrogen in the ASM1, trough hydrolysis and ammonification. By excluding these components from the ASM3, the ammonia nitrogen concentration in the influent should be slightly higher for the ASM3 compared with the ASM1. The ammonia nitrogen concentration SNH was computed using the total
nitrogen equations from the two models, as presented in eq. (1) and eq. (2). For ASM1:
BH A
XP
P I
XB ND ND NO ASM NH ASM tot X X i X X i X S S S N . 1 1
. (1)
where: iXB is the fraction of nitrogen in the biomass
and it equals 0.08 gN/gCOD; iXP is the fraction of
nitrogen in the particulate products and is equal with 0.06 gN/gCOD; XBH and XA are the heterotrophic and
autotrophic biomass from the ASM1; XP is the
particulate products, results of biomass decay; XI
particulate inert organic matter, and for ASM3:
H A
BM N S XS N I XI N S SS N I SI N NO ASM NH ASM tot X X i X i X i S i S i S S N . . . . . 3 . 3
. (2)
where: iN.SI nitrogen content of SI; iN.SS nitrogen
content of SS; iN.XI nitrogen content of XI; iN.XS nitrogen
content of XS; iN.BM nitrogen content of XH and XA.
The particulate COD components (XI, XS and XH)
have the same values for the two models.
The influent concentration of the internal storage product of the heterotrophic organisms XSTO is equal to
zero.
The input values of the SNO, SO and XA
components are equal to zero.
IV. CONTROL APPROACH
A. Operational costs function development
This part of the paper focuses on the investigation and optimisation of two control strategies designed to reduce the operational costs of the WWTP. The operational costs were calculated using the following formula:
AE ME
EFOC (3) where: AE is the aeration energy [kWh·day-1]; ME – mixing
energy [kWh·day-1]; EF – effluent fines; γ– electricity price
0.1 [€/kWh];
Because the external recycle flow rate (Qr), waste flow
rate (Qw) and internal flow rate (Qa) were set to constant
values throughout all the simulations, the pumping energy costs are excluded from the formula.
The average aeration energy costs were calculated using the equation proposed by Copp [25]:
K t K t
dtT AE d t d t i i Lai Lai
28 22 5 1 2 8408 . 7 4032 . 024 (4)
where: KLai(t) is the mass transfer coefficient in the ith
aerated reactor at time t [h-1] and T=7 days.
The mixing energy is a function of the compartment volume and it wascalculated with the equation suggested by Alex et. al [29]:
dt
otherwise d t K if V T ME d t d t i i Lai i
28 22 5 1 1 0 20 005 . 024 (5)
where: Vi is the reactor volume [m3];
The effluent fines [30] [31] were calculated by comparing the total nitrogen and ammonia in the effluent with their maximal allowable discharge limits. The total nitrogen concentration was calculated with equation 2. As a result, it can be noted that ammonia is penalized twice. A mathematical description of the cost function used for the effluent fines is presented in eq. (6) [30] [31]:
Lj j ef Lj j ef ef Lj j ef j ef j ef Lj j ef j ef j C C C C if if Q C C Q Q C Q C t Cost . . 0 . . ) ( (6)
The ammonia and total nitrogen parameter values used in this research were obtained from [21]. The parameters used to compute the EF are presented in Table IV.
TABLEIV
PARAMETERS USED FOR THE EFFLUENT THE FINES CALCULATION
Effluent
Variable j
(€·kg-1)
j
(€·kg-1)
0
(€·m-3)
Lj C
(mg·L-1)
SNH 4.00 12.00 2.70×10⁻³ 4.00
Ntot 2.70 8.10 1.40×10
-3 18.00
B. Control architectures
control is achieved by manipulating the air flow rate (indirectly, by the oxygen transfer coefficient KLa). This
flow rate is constrained to a maximum of 240 day-1. The
control scheme is built of three PI controllers, one for each control loop. The PI controllers are tuned as suggested by Copp [25] with a proportional gain of K=500, integral time constant of Ti=0.001 and anti-windup time constant of Tt=0.0002. This control architecture will be further referred
to as 3DO.
The second control architecture proposed in this paper is a cascade control scheme. On the outer level of the cascade control architecture, a Model Predictive Controller (MPC) adjusts the DO set-point values for the aerated reactors. This control scheme has to keep the nitrate (SNO3) concentration
in the third aerated reactor at a set-point of 9 mg L-1. The
inner control level consists of PI controllers that keep the DO concentration in the aerated reactors at the set-points imposed by the MPC. To prevent excessive aeration, the set-points provided by the MPC are constrained to a maximum of 2 mg L-1. The sampling time of the MPC controller was
set to Δt=1 minute. The prediction horizon and the control horizon have the values of Hp=200 and Hc=3. The tuning of
the PI controllers was the same as the one used for the first control strategy. This control scheme will be further referred to as NO5.
C. Performance assessment and optimization
The proposed control strategies were simulated for 28 days with the three influent files. Only the last seven days of the simulation were considered for performance assessment. The closed loop simulations results were compared with the results of the open loop simulation and to each other. For the open loop simulation, constant KLa values of 240
day-1 were assumed for each aerated reactor, i.e. maximum
aeration.
The average operational costs for the last seven days of the simulations are presented in Table V.
TABLEV
RESULTS OF THE CONTROL SCHEMES OPERASTEING IN ALL INFLUENT CONDITIONS AND RESULTS OF THE OPEN LOOP SIMULATION
Influent Control Strategy
AE €/Day
ME €/Day
EF €/Day
OC €/Day
Dry
OL 854.84 0 971.09 1825.93
3DO 671.14 0 970.60 1641.74
NO5 647.02 1.02 996.18 1644.23
Rain
OL 854.84 0 1254.06 2108.13
3DO 627.49 0 1340.68 1968.49
NO5 617.75 0.57 1356.76 1974.75
Storm
OL 854.84 0 1185.29 2040.13
3DO 663.81 0 1225.16 1888.98
NO5 653.90 0.45 1245.58 1899.90
The results presented in table V show that in case of the 3DO control, the difference in EF value for the Dry weather conditions, compared with the open loop simulation, is 0.49 €/day but the total OC are lower with 184.19 €/day due to reduced aeration. This fact shows that by using this control strategy the operational costs can be reduced with almost 67,500 €/year and while keeping the same effluent quality as in case of operation of the WWTP with aeration turned on to maximum capacity. The same overall improvement in the operational costs can be observed in case of NO5 control. The difference in this case is that the EF is higher
with 25.09 €/day compared to the open loop simulation but the aeration costs are further reduced compared with the 3DO scheme. These improvements are observable in case of all weather influent conditions. The NO5 control scheme achieves lower aeration costs compared to the 3DO architecture, with savings of 24 €/day for dry weather and almost of 10 €/day for the rain and storm influent files. The downside of the NO5 scheme compared with the 3DO architecture is that the effluent fines are higher with a mean value of 20 €/day for the three influent conditions.
Both control schemes improve the total operational cost, with savings of 49,000 – 67,500 €/year, depending on the weather influent conditions.
[image:4.595.320.533.356.474.2]Fig. 2. Ammonia nitrogen concentration in the last aerated reactor.
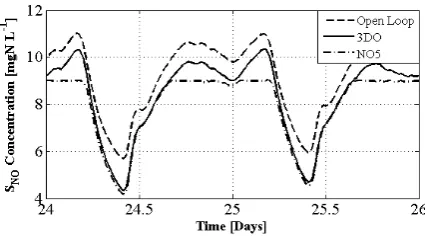
Fig. 3. Nitrate nitrogen concentration in the last aerated reactor.
Figures 2 and 3 present the SNH and SNO concentrations in
the last aerated reactor for all three control strategies. It can be depicted that when the SNH concentrations are low, he
SNO values are low as well. The fact that nitrification is a
strict aerobic process and SNO is the end product of this
process, leads to the conclusion that when the SNH
[image:4.595.45.292.523.632.2]concentration is low, the oxygen requirements are also low.
Fig. 4. Oxygen concentration in the last aerated reactor.
Figure 4 presents the variation of the DO concentration for the three control strategies in the last aerated reactor. It can be noted that when the SNH values are low, the DO
concentration for the open loop simulation has a value of 5.5 mg L-1. This shows that when S
low in the aerobic compartment, the oxygen uptake rate is smaller. Therefore the aeration during these periods is excessive and energy is wasted.
In case of the NO5 control scheme, the DO concentration value is of 2 mg L-1, during periods exhibiting low S
NH
concentration values. The MPC at the outer level of the cascade control architecture sends high set-points for the PI controller at the inner control level, because of the relatively high error between the desired set-point and the current value of the SNO in the system.
All these facts lead to the conclusion that when SNH
concentrations are low in the aerated part of the plant, the DO requirements are low, and the control schemes carry out excessive aeration. Therefore the dissolved oxygen concentration in the aerated reactors should be correlated with the available ammonia concentration. In this way, during low substrate concentration, imposing lower DO values in the aerated reactors should reduce the aeration costs, and as a consequence, the overall operational costs will be reduced.
In order to correlate the ammonia concentration with the dissolved oxygen requirements, another level of control was designed and added to the 3DO and NO5 control architectures. This level of control provides improved set-points to the control schemes by considering the amount of ammonia nitrogen that enters the aerated part of the plant.
The set-point changing algorithm is governed by a linear function as presented in equation 5 and 6.
5 . 4 01 . 0
S
refDO (5)
0 . 6 02 . 0
S
refNO (6)
where refDO and refNO is the optimal set-point and S is the
inlet ammonia in the aerated part of the plant, measured in kg/day.
The set-point for the 3DO control scheme is constrained to a maximum of 2 mg L-1 and a minimum of 0.5 mg L-1.
The set-point for the NO5 architecture varies from 4 to 9 mg L-1.
The optimized control architectures will be further referred to as FF_3DO and FF_NO5.
The improved control strategies were simulated for 28 days with the three influent files. The results for the last seven days of simulation are presented in table VI.
TABLEVI
RESULTS OF THE OPTIMISED CONTROL SCHEMES OERATEING IN ALL INFLUENT CONDITIONS
Influent Control Strategy
AE €/Day
ME €/Day
EF €/Day
OC €/Day
Dry
FF_3DO 633.68 0 940.18 1573.86
FF_NO5 635.55 2.4 974.40 1612.35
Rain
FF_3DO 593.56 0 1328.07 1921.63
FF_NO5 597.82 2.45 1342.91 1943.18
Storm
FF_3DO 628.70 0.02 1205.29 1834.02
FF_NO5 627.61 2.43 1228.06 1858.10
By comparing the results presented in Table V and VI it can be observed that the operational costs are lower for the improved control strategies in all operating conditions compared to the simple control architectures.
The FF_3DO control scheme brings a reduction of 67.88 €/day compared to the original architecture for the dry weather simulation. The operational cost reduction due to spared aeration energy is 37.46 €/day, which represents 55% of the total cost improvement. The rest of 45% is due to lower effluent fines. The effluent fines present a drop of 28.5 €/day on account of the minimization of the total nitrogen fines, while the ammonia nitrogen fines are higher with 2 €/day.
The FF_NO5 has a reduction of 31.88 €/day for the dry weather influent conditions. In this case the majority of the improvement, amounting a value of 21.77 €/day, is due to the lower effluent fines. This represents 68% of the total cost reduction.
The overall cost cutback compared to the open loop simulations, for the dry weather influent conditions, is of about 92,000 €/year in case of the FF_3DO scheme, and 78,000 €/year in case of the FF_NO5 scheme.
For the rain weather conditions, the FF_3DO scheme presents an overall cost improvement of 46.86 €/day. The largest part of it, i.e. 33.93 €/day, are savings due to reduction of the aeration cost and the rest are due to the drop of the effluent fines. In case of the same rain influent conditions, the FF_NO5 strategy presents a cost reduction of 31.57 €/day. Part of it, i.e. 19.93 €/day (63.12%) is due to lower aeration costs. It can be observed that the major improvement of the operational cost, in case of both control strategies, is due to reduced aeration costs.
The same pattern is observed in case of storm weather influent conditions. The FF_3DO structure brings a decrease of 35.11 €/day of the aeration cost, while the effluent fines decrease with 19.87 €/day, resulting in a total operational cost reduction of 54.98 €/day. Compared to the open loop, storm conditions simulation, the operational costs reduction is of 206.11 €/day and adds up to approximately 72,000 €/year.
With the FF_NO5 control architecture, a cutback of 41.8 €/day can be achieved compared to the NO5 strategy, and a cutback of 182.03 €/day compared to the open loop simulation.
V. CONCLUSION
This paper presents the development and implementation of a modified Activated Sludge Model No. 3, which considers direct growth of the heterotrophic biomass on substrate, in the Benchmark Simulation Model No. 1.
In order to bring the WWTP simulator closer to the real plant behavior, a reactive secondary settler model was included in the simulator model.
The second part of the paper highlights the importance of automatic control of the WWTP. By the implementation of specially designed control strategies on the WWTP, the operational costs can be reduced with 49,000 – 67,500 €/year, depending on the control strategy and operating conditions, while the effluent standards are maintained.
sludge process.
The FF_NO5 control scheme presented good results in the reduction of the operational costs compared to the NO5 scheme, as the achieved savings range from 11,000 to 15,000 €/year.
The FF_3DO control scheme presented the best improvement of the operational costs. Compared to the 3DO scheme, the obtained cost reduction was of about 25,000€/year in case of dry weather conditions, 17,000 €/year for the rain event and 20,000 €/year for the storm influent conditions. The most important overall cost minimization, compared to the open loop simulation costs, was attained in case of the dry weather influent file, i.e. a value of 92,000 €/year.
ACKNOWLEDGMENT
The authors wish to thank for the financial support provided from programs co-financed by the Sectoral Operational Program for Human Resources Development 2007-2013, Contract no.: POSDRU/88/1.5/S/60185–“Innovative doctoral studies in a Knowledge Based Society “.
REFERENCES
[1] M. Henze, C.P.L. Grady Jr., , W. Gujer, G.V.R Marais, and T. Matsuo
T., “Activated Sludge Model No. 1”, IAWQ Scientific and Technical
Report No. 1, London, UK, 1987.
[2] M. Henze, W. Gujer, T. Mino, T. Matsuo, M.C. Wentzel, and G.v.R.
Marais, “Activated Sludge Model No. 2.” IAWQ Scientific and
Technical Report No. 3. London, IAWQ, 1995.
[3] M. Henze, W. Gujer, T. Mino, T. Matsuo, M.C. Wentzel, G.v.R.
Marais and M.C.M van Loosdrecht, “Activated Sludge Model No. 2d,
ASM2d”, Wat. Sci. Technol, vol. 39 (1), pp 165–182, 1999.
[4] W. Gujer, M. Henze, T. Mino, and M.C.M. van Loosdrecht,
“Activated Sludge Model No. 3”, Wat. Sci. Technol, vol. 39 (1), pp
183–193, 1999.
[5] G.S. Ostace, V.M. Cristea and P.S. Agachi, “Cost reduction of the
wastewater treatment plant operation by MPC based on modified
ASM1 with two-step nitrification/denitrification model”, Computers
and Chemical Engineering, 2011, [Online], Available:
http://www.sciencedirect.com/science/article/pii/S0098135411001219
[6] E. Giusti, S. Marsili-Libelli and A Spagni, “Modelling microbial
population dynamics in nitritation processes”, Environmental
Modelling and Software, vol. 26, pp 938-949, 2011.
[7] I. Iacopozzi, V. Innocenti, S. Marsili-Libelli and E. Giusti, “A
modified Activated Sludge Model No. 3 (ASM3) with two-step
nitrification/denitrification”, Environmental Modelling and Software,
vol. 22, pp 847-861, 2007.
[8] S. Marsili-Libelli, P. Ratini, A. Spagni and G. Bortone,
“Implementation, study and calibration of a modified ASM2d for the
simulation of SBR processes”, Water Science and Technology, vol.
43, pp 69-76, 2001.
[9] G. Sin and P.A. Vanrolleghem, “Evolution of an ASM2d-like model
structure due to operational changes of an SBR process”, Water
Science and Technology, vol. 53, pp 237-245, 2006.
[10] D. Kaelin, R. Manser, L. Rieger, J. Eugster, K. Rottermann and H.
Siegrist, “Extension of ASM3 for two-step nitrification and denitrification and its calibration and validation with batch tests and
pilot scale data”, Water Reserch, vol. 43, pp 1680-1692, 2009.
[11] Ni B.J., Yu H.Q., (2008), An approach for modeling two-step
denitrification in activated sludge systems, Chemical Engineering Science, 63, 1449-1459.
[12] M.K. de Kreuk, C. Picioreanu, M. Hosseini, J.B. Xavier, and M.C.M.
van Loosdrecht , “Kinetic model of a granular sludge SBR: influences
on nutrient removal”, Biotechnology and Bioengineering, vol. 97, pp
801–815, 2007.
[13] E.I.P Volcke, M. Sbarciog, M. Loccufier, P.A. Vanrolleghem and
E.J.L. Noldus, “Influence of microbial growth kinetics on steady state multiplicity and stability of a two-step nitrification (SHARON)
model”, Biotechnology and Bioengineering, vol. 98, pp 882–893,
2007.
[14] J.B. Xavier, M.K. de Kreuk, C. Picioreanu, and M.C.M van
Loosdrecht, “Multi-scale individual-based model of microbial and
bioconversion dynamics in aerobic granular sludge”, Environmental
Science and Technology, vol. 41, pp 6410–6417, 2007.
[15] O. Nowak, K. Svardal and F. Schweighofer, “The dynamic behaviour
of nitrifying activated sludge system influenced by inhibiting
wastewater compounds”, Water Science and Technology, vol. 31, pp
115-124, 1995.
[16] P.J. Ossenbruggen, H. Spanjers and A. Klapwik, “Assessment of a
two-step nitrification model for activated sludge”, Water Research,
vol. 30, pp 939-953, 1996.
[17] Ö. Karahan-Gül, M.C.M. van Loosdrecht and D. Orhon.
“Modification of Activated Sludge Model no. 3 considering direct
growth on primary substrate”. Water Science and Technology, vol 47
(11), pp 219–225, 2003.
[18] Aalst-van Leeuwen, M.A. Pot, M.C.M. van Loosdrecht, and J.J.
Heijnen, “Kinetic modeling of poly (β-hydroxybutyrate) production
and consumption by P. P. under dynamic substrate supply”. Biotech.
Bioeng., vol. 55(5), pp 773–782, 1997.
[19] K. Dircks, J.J. Beun, M.C.M. van Loosdrecht, J.J. Heijnen and M.
Henze, “Glycogen metabolism in aerobic mixed cultures”. Biotechnol.
Bioeng., vol. 73(2), pp 85–94, 2001.
[20] J.J. Beun, F. Paletta, M.C.M. van Loosdrecht, and J.J. Heijnen,
”Stoichiometry and kinetics of poly-β-hydroxybutyrate metabolism in
aerobic, slow growing, activated sludge cultures”. Biotechnol.
Bioeng., vol. 67(4), pp 379–389, 2000.
[21] A. Stare, D. Vrecko, N. Hvala, and S. Strmcnik, “Comparison of
control strategies for nitrogen removal in an activated sludge process
in terms of operating costs”, Water Research, vol. 41, pp 2004-2014,
2007.
[22] L. Benedetti, B. de Baets, I. Nopens and P.A. Vanrolleghem,
“Multi-criteria analysis of wastewater treatment plant design and control
scenarios under uncertainty”. Environ. Model. Softw. Vol. 25, pp
616-621, 2010.
[23] D. Cecil and M. Kozlowska. “Software sensors are a real alternative
to true sensors”. Environ. Model. Softw. Vol. 25, pp 622-625, 2010.
[24] J. Guerrero, A. Guisasola, R. Vilanova and A.J. Baeza, “Improving
the performance of a WWTP control system by model-based setpoint
Optimisation”. Environmental Modelling & Software, vol. 26, pp
492-497. 2011.
[25] J.B. Copp, “The COST Simulation Benchmark: Description and
Simulator Manual”, Office for Official Publications of the European
Communities, Luxembourg, 2002.
[26] I. Takács, G.C. Patry and D. Nolasco, “A dynamic model of the
clarification-thickening process”, Water Research, vol. 25, pp
1263-1271, 1991.
[27] G.S. Ostace, V.M. Cristea and P.S. Agachi, “Investigation of
Different Control Strategies for the BSM1 Waste Water Treatment
Plant with Reactive Secondary Settler Model”, 20th European
Symposium on Computer Aided Process Engineering, Ischia, pp 1841-1846, 2010.
[28] K.V. Gernaey, U. Jeppsson, D.J. Batstone and P. Ingildsen, “Impact
of reactive settler models on simulated WWTP performance”, Water
Science and Technology, vol. 53, pp 159-167, 2006.
[29] J.L. Alex, L. Benedetti, J.B. Copp, K.V. Gernaey, U. Jeppsson, I.
Nopens, M.N. Pons, C. Rosen, J.P. Steyer, P. Vanrolleghem and S.
Winkler, “Benchmark Simulation Model no.1 (BSM1)”, Tech. Report
no. LUTEDX/(TEIE- 7229)/1-62/(2008).
[30] J. Carstensen, “Identification of wastewater processes” Ph.D. Thesis,
Institute of Mathematical Modelling, Technical University of Denmark, 1994.
[31] P.A. Vanrolleghem, U. Jeppsson, J. Carstensen, B. Carlsson, and G.
Olsson, “Integration of wastewater treatment plant design and
operation e a systematic approach using cost functions”, Water