879
©IJRASET: All Rights are Reserved
Performance Characterization & Multi-Objective
Optimization of Laser Beam Cutting Process on
Steel
Nitin N. Gotkhindikar 1
1
Department of Mechanical Engineering, IIT Roorkee, Uttarakhand
Abstract: Laser cutting is a popular process, which finds wide application in various manufacturing industries because of its precision of operation and low cost. Laser cutting, being a non-contact process, does not involve any mechanical cutting forces and tool wear. To maintain a high production rate and an acceptable level of quality for the cut parts, there is need to select the optimum combination of process parameters. This paper presents method of optimization for multi performance characteristics of LBC process for mild steel. Surface roughness (SR) and material removal rate (MRR) are multi performance characteristics and nozzle dia., gas pressure, cutting speed and cutting power are taken as input process parameters. Grey relational analysis (GRA) technique is used for optimization. ANOVA technique is also used to find significant and sub significant parameter. This experimental work will be helpful in deciding optimum parameters and to improve LBC process.
Keywords: LBC, Grey Relational Analysis, Taguchi Method, Mild Steel, ANOVA
I. INTRODUCTION
Laser beam cutting process uses focused laser light, by which work piece material is locally melted. The melt is then coming out of the kerf with an assist gas that flows coaxial with the laser beam. When using oxygen as assist gas, it will drag the melt away as well as provide exothermic reaction in the cutting section enhancing the energy available for increasing the cutting speed. CO₂ laser cutting is one of the processes which is used to cut sheets and having ability to produce accurate cut edges and surfaces with higher accuracy and surface finish. Post processing is not required for laser cut parts.
Ulas Caydas et al. (2008) presented an effective approach for the optimization of laser cutting process of st-37 steel based on the grey relational analysis and Taguchi method of orthogonal arrays. B.Adelmann et al. (2011) reported on a fast laser cutting optimization algorithm (FALCOA) to optimize the laser parameters for the laser fusion cutting of 1 mm aluminium sheets. Avanish Kumar Dubey et al. (2012) experimented on the laser cutting of Duralumin sheet and Fuzzy logic theory has been applied to compute the fuzzy multi-response performance index. The confirmation tests show considerable reduction of 50% to 71% in kerf deviations at top and bottom sides. Koji Hirano et al. (2011) observed striation generation mechanism in inert gas laser cutting of 3mm thick low carbon mild steel. Vinod Yadava et al. (2013) optimized cut quality characteristics during Nd:YAG laser cutting of aluminium alloy thin sheet with the use of Taguchi Methodology (TM) and Response Surface Methodology (RSM) in combination. Optimum kerf deviation and kerf taper are obtained by applying grey relational analysis (GRA) with entropy measurement (EM). In the fusion cutting of stainless steel, the minimum roughness is reached at the maximum cutting speed. The maximum cutting speed has the higher value in the fibre-laser case at the same laser power (V.B.Shulyatyev et al. 2014).
II. EXPERIMENTALPROCEDURE
880
[image:2.612.183.429.87.134.2]©IJRASET: All Rights are Reserved
TABLE I
Chemical composition of mild steel
To measure the surface roughness Taylor-Hobson surface profile meter was used. Surface roughness was measured at all four cut faces of sheet and average of all these four values is taken as resulting surface roughness for that laser cut work piece. Measurement of material removal rate was taken by using following formula
(1)
(2)
Perimeter=87.33 mm
A. Design of Experiments
To conduct experiments, design of experiment (DOE) method used was based on Taguchi Method of orthogonal array. With consideration of four factors, one at two levels and remaining at three levels each, Taguchi’s L18 array was used. Parameter level and their values are given in TABLE II. The results of experiments for material removal rate (MRR) and Surface roughness (SR) for each 18 runs are shown in TABLE III. These results were further used for finding optimum parameters by S/N ratio technique as well as to determine contribution of parameters using ANOVA.
TABLE III Parameter level and values
Process Parameter Level 1 Level 2 Level 3
Nozzle Diameter(mm) 1.2 2.0 -
Gas Pressure(MPa) 0.12 0.14 0.16
Cutting Speed (mm/min.) 2300 2500 2700
Cutting Power(W) 1800 1900 2000
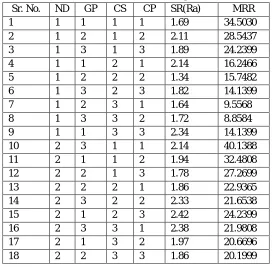
TABLE IIIII Observations for L18 experimentation
Sr. No. ND GP CS CP SR(Ra) MRR
1 1 1 1 1 1.69 34.5030
2 1 2 1 2 2.11 28.5437
3 1 3 1 3 1.89 24.2399
4 1 1 2 1 2.14 16.2466
5 1 2 2 2 1.34 15.7482
6 1 3 2 3 1.82 14.1399
7 1 2 3 1 1.64 9.5568
8 1 3 3 2 1.72 8.8584
9 1 1 3 3 2.34 14.1399
10 2 3 1 1 2.14 40.1388
11 2 1 1 2 1.94 32.4808
12 2 2 1 3 1.78 27.2699
13 2 2 2 1 1.86 22.9365
14 2 3 2 2 2.33 21.6538
15 2 1 2 3 2.42 24.2399
16 2 3 3 1 2.38 21.9808
17 2 1 3 2 1.97 20.6696
18 2 2 3 3 1.86 20.1999
In table abbreviations are as ND-Nozzle Diameter, GP-Gas Pressure, CS- Cutting Speed CP-Cutting Power, SR- Surface Roughness, MRR-Material Removal Rate
Element Si S P C Mn
[image:2.612.170.444.434.701.2]881
©IJRASET: All Rights are Reserved
III.RESULTSANDDISCUSSION
Above given data is analysed to determine optimum setting of parameters. For analysing the data, statistical tools like ANOVA and S/N ratio are used. Results of the analysis are discussed as follows
A. Design of Experiments
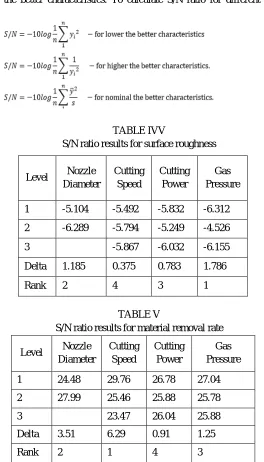
In the Taguchi method, the term ‘signal’ represents the desirable value (mean) for the response characteristic and the term ‘noise’ represents the undesirable value (S.D) for the output characteristic. So that the S/N ratio is the ratio of the mean to the S.D. S/N ratio is used to measure the quality characteristic deviating from the desired value. By calculating S/N ratio of each input parameter for both the response parameter, optimum setting of input parameters can be find out. TABLE IV gives result of S/N ratio analysis for smaller the better characteristics i.e. surface roughness (Ra). S/N ratio analysis for material removal rate is given in TABLE V. Material removal rate is higher the better characteristics. To calculate S/N ratio for different kind of response characteristics, following formulas are used
[image:3.612.173.437.210.672.2](3)
TABLE IVV
S/N ratio results for surface roughness
TABLE V
S/N ratio results for material removal rate
Level Nozzle Diameter
Cutting Speed
Cutting Power
Gas Pressure
1 24.48 29.76 26.78 27.04
2 27.99 25.46 25.88 25.78
3 23.47 26.04 25.88
Delta 3.51 6.29 0.91 1.25
Rank 2 1 4 3
From TABLE IV and TABLE V we get the results of S/N ratio analysis for surface roughness and material removal rate respectively. For each level of input parameter S/N ratio is calculated. Higher value of S/N ratio for the level shows that the particular level can give optimum value of response parameter. In this way optimum setting of input parameters is predicted for both the response parameters.
Level Nozzle Diameter
Cutting Speed
Cutting Power
Gas Pressure
1 -5.104 -5.492 -5.832 -6.312
2 -6.289 -5.794 -5.249 -4.526
3 -5.867 -6.032 -6.155
Delta 1.185 0.375 0.783 1.786
882
[image:4.612.199.416.79.354.2]©IJRASET: All Rights are Reserved
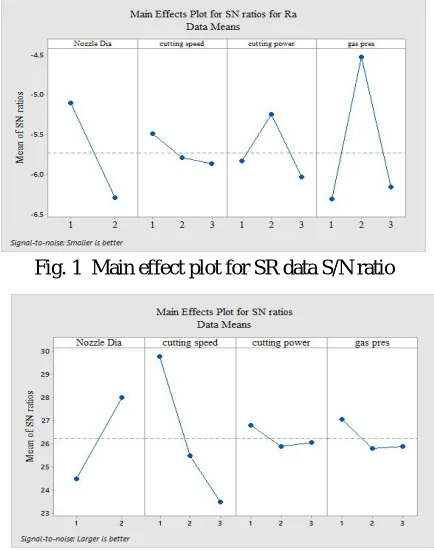
Fig. 1 Main effect plot for SR data S/N ratio
Fig. 2 Main effect plot for MRR data S/N ratio
Figure 1 and Figure 2 shows the plot of S/N ratio and factor levels. From this plot and above table we can predict that for optimum value of surface roughness can be obtained by setting nozzle diameter at level 1, cutting speed at level 1, cutting power at level 2 and gas pressure at level 2 . Similarly for MRR setting should be nozzle diameter at level 2, cutting speed at level 1, cutting power at level 1 and gas pressure at level 1.
B. Analysis of Variance (ANOVA)
The analysis of variance (ANOVA) technique is generally used to investigate or to determine which input process parameters are significantly affects the performance characteristics. TABLE VI and TABLE VII Shows the results of analysis of variance for surface roughness (Ra) and material removal rate respectively. This analysis is carried out for 5% significance level, i.e. the confidence level for process is 95%. The selected process parameter is significant or not is determined by the P-value. When P-value for the factor is less than 0.05 then that factor is having significant effect on responses.
TABLE VI ANOVA table for surface roughness
Source DF Adj.SS Adj MS F-Value P-Value
Nozzle Dia. 1 0.4533 0.4533 16.42 0.003 Cutting
Speed 2 0.1728 0.08639 3.13 0.093
Cutting
Power 2 0.2356 0.11781 4.27 0.050
Gas Pressure 2 0.7331 0.3665 13.28 0.002
Error 9 0.2484 0.02760
Total 16 1.4286
S=0.1661 R-sq=82.61%
883
©IJRASET: All Rights are Reserved
Table VII Anova table for Material removal rate
Source DF Adj SS Adj MS F-Value P-Value
Nozzle Dia. 1 239.03 239.03 20.42 0.001
Cutting Speed 2 778.83 389.41 33.27 0.002
Cutting Power 2 42.42 21.21 1.81 0.213
Gas Pressure 2 27.64 13.82 1.18 0.346
Error 10 117.06 11.71
Total 17 1204.97
S=3.42139 R-sq=90.29 Rsq(adj)=83.49%
By how much percent input parameter is significant is also calculated. It indicates that the nozzle diameter (mm) is most affecting parameter on surface roughness with 42.79% and gas pressure (MPa) is contributing 34.86% followed by cutting power (W) and cutting speed (mm/min) with 33.48 and 2.68% contribution respectively. On material removal rate cutting speed is most affecting parameter with 57.67% and nozzle diameter has 2nd contribution with 35.40% followed by cutting power and gas pressure with 3.14% and 2.04% contribution respectively.
IV.CONCLUSION
1) The Taguchi method with L18 array is used successfully to conduct experiments. S/N ratio analysis suggests the optimum setting of laser cutting parameters for surface roughness at nozzle diameter 1.2 mm, cutting speed 2300 mm/min, cutting power 1900 watt and gas pressure 0.14 MPa. For material removal rate method gives optimum settings as nozzle diameter 2.0 mm, cutting speed 2300 mm/min, cutting power 1800 watt and gas pressure 0.12 MPa.
2) From the ANOVA results shown in TABLE VII with the help p-values we can find for surface roughness gas pressure, cutting power and nozzle diameter are significant and for MRR nozzle diameter and cutting speed are significant as they are having p-value less than 0.05.
3) Contribution of each parameter in percentage is also calculated and is given as follows. For surface roughness nozzle diameter (mm) is most affecting parameter with 42.79% and gas pressure (MPa) is contributing 34.86% followed by cutting power (W) and cutting speed (mm/min) with 33.48 and 2.68% respectively. On material removal rate cutting speed is most affecting parameter with 57.67% and nozzle diameter has 2nd contribution with 35.40% followed by cutting power and gas pressure with 3.14% and 2.04% contribution respectively.
V. ACKNOWLEDGMENT
The author would like to thank the management of Indian Institute of Technology, Roorkee, Uttarakhand, India for extending the help in preparation of this research paper.
REFERENCES
[1] Ulas Caydas , Ahmet Hascalık, “Use of the grey relational analysis to determine optimum laser cutting parameters with multi-performance characteristics” International Journal of Optics & Laser Technology, Vol.40, (2008) ,pp. 987–994.
[2] B.Adelmanna, R. Hellmanna, “Fast Laser Cutting Optimization Algorithm” Physics Procedia, Vol. 12, 2011, pp. 591–598
[3] Arun Kumar Pandey, Avanish Kumar Dubey, “Taguchi based fuzzy logic optimization of multiple quality characteristics in laser cutting of Duralumin sheet” Optics and Lasers In Engineering, Vol. 50, 2012, pp. 328-335
[4] Koji Hiranoa, Remy Fabbroa “Experimental Observation of Hydrodynamics of Melt Layer and Striation Generation during Laser Cutting of Steel” Physics Procedia, Vol. 12, 2011, pp.555–564
[5] Amit Sharma, Vinod Yadava “Modelling and optimization of cut quality during pulsed Nd:YAG laser cutting of thin Al-alloy sheet for curved profile” Optics and Lasers In Engineering, Vol. 51, 2013, pp.77-88
[6] A.M. Orishicha, A.G. Malikova, V.B. Shulyatyeva, A.A. Golysheva “Experimental comparison of laser cutting of steel with fiber and lasers on the basis of minimal roughness” , Physics Procedia Vol. 56 , 2014 ,pp. 875 – 884
[7] Avanish Kumar Dubey , Vinod Yadava , “Multi-objective optimisation of laser beam cutting process” International Jouranal Of Optics & Laser Technology,Vol. 40, 2008, pp. 562–570
[8] H.A. Eltawahnia,n, M. Haginob, K.Y. Benyounisd, T. Inoueb, A.G. Olabic “Effect of CO2 laser cutting process parameters on edge quality and operating cost of AISI316L” International Jouranal Of Optics & Laser Technology,Vol. 44, 2012, pp.1068-1082
[9] L.slatineanu , M.Coteata , O. Doduna, I.Besliu “Obtaining slots and channels by using a 1070 nm wavelength laser” The Seventeenth CIRP Conference on Electro Physical and Chemical Machining (ISEM), Physics Procedia CIRP , Vol. 6 , 2013 , pp. 479 – 485