141
©IJRASET: All Rights are ReservedMachine Learning Prediction of Glaucoma
Associated Proteins from Integrated Composition
Features
Anitha Duraisamy1, Suganthi M2, Gnanendra Shanmugam3
1
Centre for Advanced Research, Electronics and Communication Engineering, Mahendra College of Engineering, Salem, Tamil Nadu, India
2,3
Research Division, Origene Biosolutions, Salem, Tamilnadu, INDIA,
Abstract: Glaucoma is being one of the major causes of blindness. It has been considered that around 2 to 8% of the human genes and associated proteins play the crucial role in glaucoma disease prognosis. In this work, compared the discriminative power of the each protein sequence features such as amino acid composition (AAC), dipeptide composition (DPC) and combined version of these methods and also explores the classification capabilities of machine learning algorithms such as Support vector machine (SVM) and K-nearest neighbor (K-NN). It is observed that SVM has yielded higher success rate with 89.27 % while compared to that of K-NN with the prediction accuracy of 86.14 %. However, the overall performance of SVM in terms of accuracy, sensitivity and specificity is found to be lower than that of K-NN performance. Thus suggesting the usages of K-NN over SVM classifiers as the best classifier for predicting the proteins sequence based on their compositions.
Keywords: Glaucoma, Machine learning, Support vector machine, and K-nearest neighbor
I. INTRODUCTION
Glaucoma is being one of the major causes of blindness and it is anticipated to have an effect on over 80 million people by 2020 [1]. The recent survey of world health organization reveals that glaucoma tops the list for the cause of permanent and irreversible visual impairment [2]. Understanding the glaucoma at the molecular level is very complex, which usually involves numerous genes, proteins and pathways. It has been considered that around 2 to 8% of the human genes play the crucial role in glaucoma disease prognosis [3]. However, the glaucoma associated genes validated by experiments are accounted for only 1% of the human genome which suggests that hundreds or even thousands of genes that are associated to glaucoma still remained unidentified [4]. Thus the knowledge of glaucoma associated genes may help clinicians to make an early detection of glaucoma and develop molecularly targeted therapeutics. Therefore, it is valuable to identify glaucoma-related genes as far as the diagnosis and treatment, which may significantly improve a patient’s prognosis and reduce the blindness [5].
In general, the conventional gene mapping methods are used to localize the causal genes to a candidate region in the genome, which often contains lots of candidate genes which is usually a laborious and time consuming process [6]. With the advent of recent ‘omics’ technologies, the increase in data such as a genomics, proteomics, and epigenomics, has lead the path in discovering genes associated in many diseases including glaucoma [7]. Also the drastic advances in the hardware and software have lead to the development of various computational approaches that can complement the traditional genetic analysis by integrating prior knowledge on disease biology and genome wide measurements [8]. In this scenario, we focused on the discriminative power of the each features model and to explore the classification capabilities of machine learning algorithms such as Support vector machine (SVM) and K-nearest neighbor (K-NN). Hence in this present work, the amino acid composition (AAC), dipeptide composition (DPC) and combined version of these methods are used as input features. SVM and K-NN are used as base learners for the classification and their performance were statistically evaluated by applying ten-fold cross-validation.
II. METHODS
A. Dataset
142
©IJRASET: All Rights are Reservedthe negative dataset with 251 sequences are obtained. Totally, the dataset of 481 sequences are used to compare the classification capabilities of SVM and K-NN algorithms.
C. Input Features
1) The Amino acid composition (ACC): Every protein sequences are a combination of 20 amino acids and the composition of amino acids decided its nature [11]. Thus, amino acid composition is considered as feature and represented as a 20 dimension feature vectors. ACC = total number of ith amino acid in the entire sequence, Where i is every single amino acid from the list of 20.
2) Dipeptide Composition (Dpc): In this method, the occurrence of two adjacent amino acid residues that represents a protein by a vector of 400 dimension feature vectors [12]. It takes an advantage over AAC by measuring the two adjacent aminoacidcombination. The combination of two amino acids in protein sequence is calculated as DP (i) =(Total number of aminoacid combination (i))/(Total number of all combintaions of amino acids (400)) DP (i) is ith aminoacid combination. 3) Composite method Analysis: In this method, a total of 420 features are used as vector by combining the amino acid composition
(20) and dipeptide composition (400) features.K-NN
D. Machine Learning Algorithms
1) Support vector machine (SVM) : In computational biology, SVM is considered as successful machine learning (ML)-technique due to it significant advantages such as noise handling, large dataset and large feature space abilities. This algorithm can efficiently classify the positive and negative instances with high margin [13]-[14]. Here, we have optimized the kernels such as linear, polynomial, radial base function (RBF) and sigmoid and evaluated the best performance of SVM classifiers by using AAC, DPC and combined features as input.
2) K-nearest neighbor (K-NN): K-NN is considered as one of the most widely accepted machine learning algorithm in classification and pattern recognition due to its simplicity and good generalization capabilities [15]. This is a nonparametric classification algorithm and can classify the data with proximity in the feature space and neighbors. Absolute, Euclidean, Hamming and Mahalanobis are the various distance measure in K-NN [16]. In this work we have used Euclidean distances for the classification of our data by using AAC, DPC and combined features as input.
3) Cross Validation and Performance Evaluation: The Leave-One-Out Cross-Validation (LOOCV) is an effective statistical method to evaluate a classifier algorithm [17]. In this work, we have used 5-fold cross-validation to evaluate the SVM and K-NN classification performance based on their inputs. For this, the training dataset was randomly divided into 5 subsets in which both the positive and negative dataset of glaucoma proteins sequences amino acid; dipeptide and combined features are present. Then, the classifiers were trained on four subsets and their classification performance was evaluated with fifth subset. Eventually, the process was iterated five times such that all the 5 subsets were used as test and training dataset. At last, the average of the performance was considered as the final performance of a classifier. Further, the performances of these algorithms were assessed by measuring the threshold dependent parameters such as accuracy, sensitivity and specificity of each test dataset
Sensitivity (Sn) measures the ability of algorithm in predicting the correct results
Specificity (Sp) measures the ability of algorithm to predict incorrect results.
143
©IJRASET: All Rights are Reservedtp: true positive; tn: true negative; fn: false negative; fp: false positive.
III.RESULTANDDISCUSSION
The availability of human genome and its protein sequences helps to identify pattern, function and its association with other proteins can help to determine the relationship of various diseases including glaucoma and its associated proteins [18]. The disease seriousness of glaucoma and the complexity its predicting its related genes has drastically attracted many ophthalmologists and researchers to develop prediction methods or computational tools [19]. Hitherto, many predicting algorithms are proposed by many research groups and machine learning algorithms are existed as a choice to deal this prediction strategy. Thus in this study, a comparative predictive ability of SVM and K-NN algorithms and their classification reliability were determined by a widely used cross-validation test. By using three feature representation methods as input.
A. Prediction Algorithm
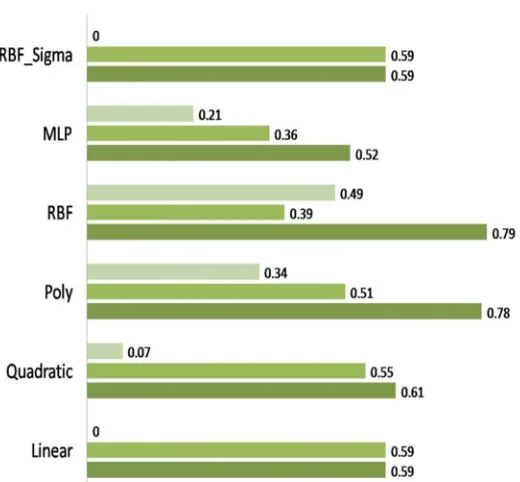
[image:3.612.171.431.382.623.2]The SVM classifier was trained and optimized with AAC, DPC and composite (AAC+DPC) features. Various kernels such as linear, quadratic, polynomial, radial basis function (RBF), MLP and RBF_sigma were optimized for the best performance of the SVM classifiers. The kernel parameters (C and gamma) corresponding to maximum accuracy were optimized as best parameter values. The specificity, sensitivity and accuracy were given in figure.1. The SVM classifier optimized with RBF kernel showed the highest accuracy of 79.13% followed by Polynomial kernel with 78.54% for AAC input. The lowest accuracy of 52.38 % was exhibited by MLP kernel. The average accuracy was considered for the best performance of a kernel. Thus in the present study, RBF kernel was considered as the best kernel for the SVM classifiers-training and testing with AAC features (20 vectors).
Fig. 1 The performance evaluation of SVM classifier for AAC with various kernels
144
©IJRASET: All Rights are ReservedFig. 2 The performance evaluation of SVM classifier for DPC with various kernels
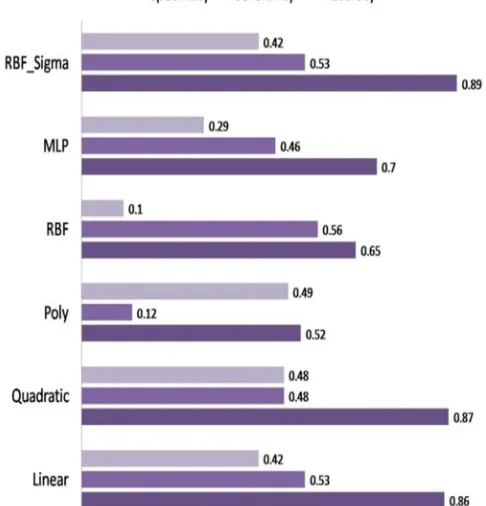
Further, we made an attempt to enhance the prediction accuracy, the SVM classifier was trained with composite features as 420 vectors (AAC +DPC). It is observed that the RBF-Sigma kernel exhibited the highest accuracy of 89.27 % followed by quadratic kernel with 87.75 % of accuracy. The accuracy, sensitivity and specificity were shown in figure.3. Interestingly, the increase in 1.5 % accuracy was observed for composite SVM classifier with RBF-Sigma kernel when compared to that of AAC (RBF) and DPC (quadratic) SVM classifiers (Figure.4). The accuracy, sensitivity and specificity of various kernels evaluated for AAC, DPC and composite features were shown in the figures 5-7 respectively .The average accuracy was considered for the best performance of a kernel. Thus the RBF-Sigma kernel was considered for the SVM classifier training and testing with composite features. This significantly suggests that the number of features and the kernel parameters pays a significant role in prediction performance of SVM algorithm. Thus suggesting RBF for AAC features; Quadratic for DPC features and RBF-Sigma for Composite features as best kernels.
[image:4.612.197.440.451.704.2]145
©IJRASET: All Rights are ReservedFig.4 The performance evaluation of SVM classifier for AAC, DPC and Composite method with various kernels
Further, the effect of feature representation methods (AAC, DPC and Composite) on the classification performances of SVM and
K-NN were evaluated. Initially, the classifiers trained with AAC features revealed the accuracy of 79.13 % for SVM, while it is of 88.33% for NN, which significantly evidenced that, the overall performance in terms of specificity, sensitivity and accuracy of K-NN is higher than that of SVM. Thus suggesting usage of K-K-NN classifier would result in the accurate prediction of protein sequence while using their AAC features as input vectors.
In dipeptide composition (DPC), the combination of amino acid in protein sequence is used as feature classifiers are trained. DPC has showed a greater improvement in the SVM classier performance with the highest accuracy of 88.07% which is relatively higher than the accuracy of K-NN classifier. It means SVM classifiers is reliably good while using quadratic kernel in discriminating the proteins based on their dipeptide composition, as these dipeptides provides the amino acid composition information and their order. However, the low sensitivity and specificity value of SVM suggests that it might be due to the low frequency occurrence of dipeptides in the dataset.
146
©IJRASET: All Rights are Reservedperformance of SVM in terms of accuracy, sensitivity and specificity is found to be lower than that of K-NN performance (figure.5). Many previous reports shows that the prediction methods based on compositional features are more accurate in predicting the function, secondary structures and sub-cellular localization of proteins [20]-[22]. Similarly, in this study also it is observed that the AAC, DPC and the composite modules used in both SVM and K-NN were found to have higher accuracy.
The prediction accuracy of SVM is almost 10% and 3% higher than the K-NN while using DPC and composite features. Whereas, the sensitivity and specificity of K-NN exhibited huge difference compared to SVM for all the AAC, DPC and composite methods. This significantly suggests that the even though the raise in performance of SVM classifiers for DPC and composite model are observed the low sensitivity and specificity values might be due the discrimination power of the large number of feature extraction strategies. Thus suggesting the usages of K-NN over SVM classifiers as the best classifier for predicting the proteins sequence based on their compositions.
The discriminate power of the classifiers evaluated by various statistical parameters is appropriate for both the methods while considering the kernels, which significantly implies that there is no statistically significant difference in the accuracy in the evaluated methods, which further envisages that the usage of K-NN method over SVM to be the better choice of prediction algorithm to predict the protein sequence as positive. Taking in to the account of total accuracy, sensitivity and specificity of SVM and K-NN classifiers the unbalance of classification efficiency in predicting the positive and negative set of protein sequences are observed. It is also observed that while using SVM classifiers, the accuracy varies from features to feature while using kernel parameter suggesting that few kernels are good in predicting the sequences with high sensitivity and some kernels with the highest specificity values indicating their good ability in predicting the sequences. However, the performance of exhibited by the K-NN classifiers makes it as a choice of best classifying algorithm. In line with this the oldest fishers linear discriminate analysis that ranks much greater than over each method indicates the performance limits of various kernels and classifiers assessed in this study. Also suggesting that the optimization of parameters will result in high discriminating power of SVM and K-NN classifiers.
IV.CONCLUSIONS
Predicting the protein sequence as that plays a key role in the early prediction of glaucoma and leads to the development of novel drug. In this study, various kernel parameters of SVM classifier were evaluated on the non-redundant dataset protein sequences. The amino acid composition, dipeptide composition and composite methods were used as input features. Fivefold cross validation was applied to evaluate the SVM and K-NN classifiers performance and measured with standard parameters like accuracy, sensitivity, false positive rate, precision, recall, f-measure and specificity. It is observed that the K-NN classifier exhibited higher accuracy with AAC features, while SVM exhibited higher accuracy over K-NN by using DPC and composite methods. But taking into the account of sensitivity and specificity, the K-NN classifier exhibited better performance over SVM while using DPC and composite methods, which are higher than that of sensitivity and specificity values of SVM classifier. Thus this study provides information on general tendency of protein sequence dataset and suggests the researchers to select the best classifier and its optimization. Also it provides insights into future researcher to avoid assessment of data by using only one method and also suggests choosing the optimal ML algorithms for glaucoma researchers.
REFERENCES
[1] H.R.Taylor and J.E. Keeffe. “World blindness: a 21st century perspective”. British Journal of Ophthalmology, vol.85, pp.261-266. 2001
[2] D. Loza-Pacheco, E. Suaste-Gómez, E. De la Cruz-Burelo. “Blindness and Low Vision, an Overview of Opportunities for Health Services and Preventive Medicine”. International Journal of Advance in Medical Science, vol.3, pp.33-36. 2015
[3] N.K. Tonks. “Protein tyrosine phosphatases: from genes, to function, to disease”. Nature reviews Molecular cell biology. Vol. 7, pp. 833-846. 2006.
[4] K.A. Frazer, S.S. Murray, N.J. Schork and E.J. Topol. “Human genetic variation and its contribution to complex traits”. Nature Reviews Genetics, vol.10, pp.241. 2009
[5] G.R. Howell, D.G. Macalinao, G.L. Sousa, M. Walden, I. Soto, S.C. Kneeland, J.M. Barbay, B.L. King, J.K. Marchant, M. Hibbs, and B. Stevens. “Molecular
clustering identifies complement and endothelin induction as early events in a mouse model of glaucoma”. The Journal of clinical investigation, vol.121, pp.1429-1444, 2011
[6] K. Walder, D. Segal, J. Jowett, J. Blangero and G.R. Collier, “Obesity and diabetes gene discovery approaches”. Current pharmaceutical design, vol.9,
pp.1357-1372. 2003.
[7] V. Chaitankar, G. Karakülah, R. Ratnapriya, F.O. Giuste, M.J. Brooks, and A. Swaroop, “Next generation sequencing technology and genomewide data
147
©IJRASET: All Rights are Reserved[8] R.A. George, J.Y. Liu, L.L. Feng, R.J. Bryson-Richardson, D. Fatkin and M.A. Wouters, “Analysis of protein sequence and interaction data for candidate disease gene prediction”. Nucleic acids research, vol.34, pp.e130-e130. 2006.
[9] A. Bairoch, and R. Apweiler, “The SWISS-PROT protein sequence database and its supplement TrEMBL in 2000”. Nucleic acids research, vol.28, pp.45-48.
2000.
[10] V. Brendel, “PROSET—a fast procedure to create non-redundant sets of protein sequences”. Mathematical and computer modelling, vol.16, pp.37-43. 1992
[11] K.J. Park and M., Kanehisa, “Prediction of protein subcellular locations by support vector machines using compositions of amino acids and amino acid pairs”.
Bioinformatics, vol. 19, pp.1656-1663. 2003.
[12] M. Bhasin, and G.P.S. Raghava, “ESLpred: SVM-based method for subcellular localization of eukaryotic proteins using dipeptide composition and
PSI-BLAST”. Nucleic acids research, vol.32, pp.W414-W419. 2004
[13] Y. Saeys, I. Inza, and P. Larrañaga, “A review of feature selection techniques in bioinformatics”. Bioinformatics, vol.23, pp.2507-2517. 2007
[14] K.P. Bennett, and C. Campbell, “Support vector machines: hype or hallelujah?” Acm Sigkdd Explorations Newsletter, vol.2, pp.1-13. 2000
[15] S.B. Kotsiantis, I. Zaharakis, and P. Pintelas, “Supervised machine learning: A review of classification techniques”. Emerging artificial intelligence applications
in computer engineering, vol.160, pp.3-24.2007
[16] X. Wu, V. Kumar, J.R. Quinlan, J. Ghosh, Q. Yang, H. Motoda, G.J. McLachlan, A. Ng, B. Liu, S.Y. Philip and Z.H. Zhou. “Top 10 algorithms in data mining”. Knowledge and information systems, vol.14, pp.1-37. 2008.
[17] A.W. Moore, and M.S. Lee. “Efficient algorithms for minimizing cross validation error” In Machine Learning Proceedings, pp. 190-198. 1994.
[18] J.L. Wiggs. “Genetic etiologies of glaucoma”. Archives of ophthalmology, vol.125, pp.30-37. 2007
[19] G. Tezel, “A proteomics view of the molecular mechanisms and biomarkers of glaucomatous neurodegeneration”. Progress in retinal and eye research, vol.35,
pp.18-43. 2013.
[20] C.S. Yu, Y.C. Chen, C.H. Lu, and J.K. Hwang “Prediction of protein subcellular localization”. Proteins: Structure, Function, and Bioinformatics, vol.64, pp.643-651. 2006.
[21] K.C. Chou and H.B. Shen, “Recent advances in developing web-servers for predicting protein attributes”. Natural Science, vol.1, p.63. 2009.