Strategic Decision Making On Agriculture Factors
Sheetal Jagtap1, Sumedha Kolhe2, Bhagyashri Shinde3, Pravin Tak (Assistant Professor) 4 1, 2, 3, 4Epartment of Computer Engineering, Zeal College of Engineering and Research, Pune
Abstract: Agriculture always helps in economics of every country. Agriculture depends on different factors of nature and society. Agriculture and India have different relationship from histories. People in India consider treat their land as God and put their faith in agriculture. Farmers are using the same process and their elder's experience in cultivating the plant. As previous farming experiments and research tell only the crop detail at growing time. So this paper is covering the previous decision time for factors to help agriculture to enhance productivity and economic growth. Paper considers the different crop of different area and their yield to predict the helpful crop. Paper list outs many crops according to different area and their weather and soil types. Main Purpose through this paper is enhancing the productivity and help farmer to grow in every condition. To achieve these result paper consider the different supervised algorithm to predict the analyzed data
Keywords: Agriculture, C4.5 Decision Tree, Classification Techniques, K-Nearest Neighbor, Regression Techniques
I. INTRODUCTION
[image:1.612.198.415.414.597.2]Agriculture is always crucial part of our life .Agriculture is considered as the resource of food from long time of histories. As the time passes agriculture enhance in helping the different factors such as making the bio-fuel, medicinal plant and others products used for sustaining and enhancing individual life. Agriculture growth depends on different factors which include soil type, fertility, and water and weather condition and market requirement. Increase in the population, the nutritional status of the poor is growing bad, which must be improved. Providing the required amount of food to the world is great necessity. Table 1 represent the contribution of agriculture to national income and its share in export is declining consistently. Different soil and climatic parameters help to decide the cropping system of that region [1]. These decisions with respect to choice of crops and cropping systems are:
Table 1: India: Position of agriculture in national income and total export (1950-91)
Year
Contribution of agriculture
to national
income
Share of
agriculture to
total exports of India
1950-51 54 52.5
1960-61 49 44.0
1970-71 47 37.5
1980-81 36 25.5
1990-91 31 16.5
A. Infrastructure Facilities
Marketing, post-harvest handling and processing and irrigation, transport, storage, trade etc.
Socio-economic factors: Type of land holding, household needs of food, fodder, fuel, fiber and finance, labor availability, financial resource base, land ownership, size etc.
B. Technological Factors
Table 2: Regions and districts of Maharashtra Regions Districts name Districts
Kokan Kokan
division
Mumbai city, Mumbai
suburban, Thane, Sindhudurg, Palghar, Raigad, Ratanagiri
Marathwada Aurangaba
d division
Aurangabad, Osmanabad,
Latur, Nanded, Parbhani,
Hingoli Pashim
Maharashtra Pune division
Kolhapur, Pune, Sangali,
Satara, Solapur
Uttar Maharashtra
Nashik division
Ahmednagar, Dhule, Jalgaon, Nandurbar, Nashik
Vidharbha Amravati
division
Akola, Amravati, Buldhana, Yawatmal, Washim
Vidharbha Nagpur
division
Bhandara,Chandrapur,Gadchir oli, Gondia, Nagpur, Wardha
Farmer uses his experience for particular crop and field to predict the price. As farmers are using their experience and previous farming method for cultivation of crop unable to get desired output. Hence to overcome these challenges and help farmer to grow in every direction by predicting the crop this will provide the maximum output in particular area. To do this prediction, paper is using supervised algorithm those are C4.5 algorithm for crop yield production and Knn algorithm for price prediction.
II. LITERATURESURVEY
III.PROPOSEDWORK
As farmers are facing many problems to decide the crop which crop will give maximum productivity and profit. The main work of this paper is to help farmer in deciding crop that they can take in their farms with the estimated crop yield and the market price prediction of that particular crop by considering different parameters. The paper considers parameters such as climatic condition with soil type/land type, size of land, water resource. System includes an input module which is responsible to take input from user in the form of soil type/land type, location of farm, size of farm and water resource.
[image:3.612.105.510.229.548.2]After getting location as parameter, the input query block is responsible for selecting the preferred crop for that location by considering the climatic condition. After selecting crops based on location the input query block will perform the selection procedure again based on water resource, land type/soil type and size of land. It provides the all crop based on all the parameters which given by user. After selecting the crop by using input module and input query module the prediction analyzer is come in frame to predict the weather and market price for crop.
Figure 1: System Architecture
By performing prediction analyzing operation on previously selected crop based on input module provide the final result to user which includes the favorable crop according to location and future market price. Below table 3 contain the information of different soil in different region with crops grown in it. The main feature of the system is it gives output in statistics form. To this end, the methodological approach that it will follow is composed of these steps:
A. The description of user’s farm.
B. The selection of crops suitable.
C. Predictive analytics modelling for predicting total yield and market price of those crops. Strategic Module consists of 2 blocks:
D. Query Bloc
E. Predictive Analytics block
Table 3: Different Crops according to Different Region
Regions Soil in different
regions
Crops
grown in
different regions
Kokan Deep black
soil ,Reddish black soil, Sandy loam
soil, Coarse
shallow soil, Deep
soil, Coastal
Alluvium soil,
Coastal saline
Rice, Sugarcane, Cashew nut, Fruits
Marathwada Deep black soil,
Rocky soil, Thin layered soil ,Black
cotton, Shallow
soil, Red soil,
Jowar, Sugarcane, Wheat, Cotton, Pashim Maharashtra
Medium black
soil, Deep black soil, shallow soil,
Jowar, Bajara, Cotton, Sugarcane, Rice, Wheat Uttar Maharashtra
Deep fertile soil,
Medium deep
coarse soil,
Shallow stony soil, Lateritic
black(kali) soil,
Reddish brown
(mal) soil
Sugarcan
e, Rice,
Jowar, Cotton, Wheat Vidharbha (Amravati division)
Black soil,
Shallow soil,
Medium deep
black soil, Deep
black soil,
Murmad soil,
Shallow coarse soil
Wheat, cotton, Jowar, Soybean, Vidharbha(Nag pur division)
Rich alluvial
soil, Clayey loamy
soil, shallow
coarse soil, Deep black soil, Lateritic black soil, Kankar soil, Morand soil, Khardi soil, Bardi soil, Black cotton soil,
Data mining give advances in field of artificial intelligence and statistics which is being used for pattern recognition and classification of problems [9]. contain (if it is a variable that varies with time, it’s called 'time series' prediction).
F. Classification
For grouping classification identify the parameters. To predict the new instance work existing data is useful. Classification models are developed by already classified data. These existing cases come from a historical. They may also come from an experiment in which a sample of the entire database is tested in the real world and the results used to create a classifier. Sometimes an expert classifies a sample of the database, and this classification is then used to create the model which will be applied to the entire database [9].
G. Regression
Regression is estimating the new value by considering existing values. Linear regression is used for simple problem. As real world problem are not simply linear projections of previous value. Complex interaction of multiple predictor variables are difficult to predict. The same model types can often be used for both regression and classification. Different techniques are used for classification and regression such as Support Vector Machine(SVM),Artificial Neural Network(ANN),Naïve Bayesian Classifier, Genetic Algorithm and K-Nearest Neighbor(KNN)
System uses predictive analytics which extract knowledge from existing data to plan and give idea about trends and outcomes [5]. Predictive analytics predicting the terms those are:
1) Crop according to location
2) Crop Yield
3) Crop Price To predict these terms it uses the algorithms:
4) C4.5 for predicting crop according to different weather and yield prediction.
5) K-Nearest Neighbour for crop price prediction.
IV. ALGORITHMS
A. C4.5 Algorithm
[image:5.612.196.466.496.717.2]C4.5 is supervised algorithm.C4.5 algorithm is used to create a decision tree. The generated decision tree is helpful in classification and referred as statistical classifier. It uses the information gain while generating the decision tree. Pruning process is also used to reduce the over-fitting. It can handle continuous and discrete data. The tree developed by c4.5 is classifier. To predict the new data class belonging c4.5 uses many data representing thing. It supports tree pruning and missing value handling [11].The below fig2 gives the idea about C4.5 working.
The objective of c4.5 is predicting the crop according to location. It will check the parameters of dataset, which contain the crop information such as name, location, crop yield, crop price, etc. All these are attributes defined in system. From these entire attribute we want to predict which crop is suitable for land in that environment. Using these crop attributes and crop information class, by using attribute c4.5 developed a decision tree for crop [11].
B. C4.5 Tree Construction
The decision tree is constructed by using training data set S, which is set of tuples in database terminology. The tree is constructed using divide and conquers method. Attribute is selected in such a way that it will split the information in effective manner. Each attribute have either discrete or continuous values. Leaves and nodes are part of decision tree. Class value is described by leaf and decision node describes a test on attribute. Child node represents the possible outcome. The path from root to leaf of decision tree is followed by attribute values of case. The class which is present at leaf node is predicted by the decision tree [11]
C. Algorithm C4.5(S)
1) Input: Dataset S with attribute value
2) Output: Decision tree or/and set of rules that assigns a class to a new case
a) Tree= {
b) Compute Class Frequency(S
c) If one Class Return leaf; Create decision Tree
d) For Each Attribute A; Compute Gain (A)
e) D.test=Best attribute according to above Criteria (Step 4);
f) If D.test continue Find threshold
g) ForEach S' in the splitting of
h) If S' is Empty Child of D is a lea Els
i) Child of D=formTree(S' BAttach T Tree to the corresponding branch of Tree;
j) Compute Errors of D Return decision Tree D;
Let S be the dataset given to the system. At start the Tree is empty having no node. The weighted frequency of dataset S is
computed (step (2)) freq (bi, S) in S which contain class bi for i € [1, Dclass].If all cases belong to same class (step (3)), node
represent as leaf for same class (respectively with most frequent class). To calculate information gain, S contains cases belonging to two or more classes (step (4)). For splitting the cases in S into sets with distinct attribute values, information gain is used for district values. For continues attributes, the information gain split the set S into subsets, namely, cases with an attribute value which is not greater than a local threshold which is determined during gain [11].
High gain contained by attribute is (step (5)) selected for next process. The test select the continuous attribute then threshold is
calculated (step (6)) as the calculated threshold is below the local threshold. . If Si empty then the child c node is set as leaf, for most
frequently used class. If Si is containing value, then divide and conquer approach apply recursively on same operation n set and also
on unknown parameters.
D. Information Gain
Attribute A information gain is calculated as:
Where,
Figure 3: Example of c4.5 for finding correlations between the heavy metal contents in soil and in plant tissues[15]
E. K-nearest Neighbor Algorithm
KNN is simple classification technique which is suitable for little or prior knowledge about how data is distributed. It is a supervised learning algorithm. It is machine learning algorithm with lazy learning. Higher similarity to test is containing the record of k training data. It is helpful to determine the contribution of the neighbors, so that the nearer neighbor contributes more than distant.
When new unlabeled data comes in frame it uses a classification technique. It looks at k closet labeled training data input. To classify new data neighbor class is used for better idea. When neighbors are not from same class it uses a voting method.
F. Steps to perform KNN
1) Find value of k, which is number of nearest neighbor
2) Calculate the distance between the query instance and all the training samples.
3) Sort the distance and determine nearest neighbor based on kth minimum distance
4) Gather the category of nearest neighbors
5) Use simple majority of category of nearest neighbors as the prediction value of the query instance.
KNN is useful for small size of training data and robust to the noisy training data. KNN is accurate in determining the value of parameter k. This method is very sensitive to variables that are irrelevant or redundant because all the variables contributing to the similarity and classification To compare testing data with training data KNN uses similarity measure. Similarity measure used in
the Euclidean distance between training data (xtrain) and data testing (xtest), is presented as
For predicting value KNN regression consider the following formula,
Where,
k = nearest neighbor of yj
For predicting output variables k a training data is close to testing data in predicting output variables. Nearest neighbor value is consider to predict the output value for unknown data.
Where,
Wj = weight of j-th neighbor.
Wj = j/n, to adjust weight based on observed data
n= Training data number
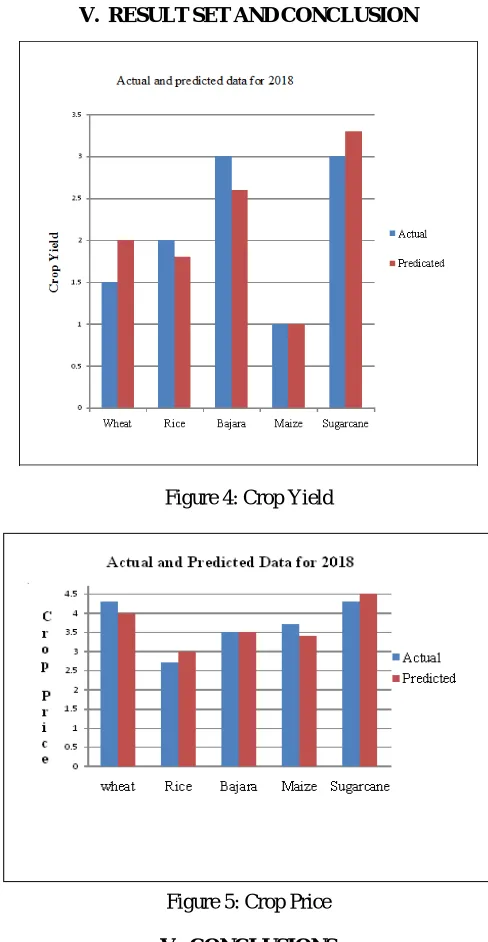
[image:8.612.182.426.204.675.2]V. RESULTSETANDCONCLUSION
Figure 4: Crop Yield
Figure 5: Crop Price
V. CONCLUSIONS
VI.ACKNOWLEDGMENT
Author like to thanks Society and College and Faculty and Family for their support and their faith.
REFERENCES
[1] Dewi Sinta , Ensemble K-Nearest Neighbors Method to Predict Rice Price in Indonesia, AppliedMathematical Sciences, Vol. 8, 2014, no. 160, 7993 – 8005
[2] Aditya Shastry, H.A. Sanjay and E. Bhanusree, 2017. Prediction of Crop Yield Using Regression Techniques. International Journal of Soft Computing, 12:
96-102.
[3] Fahad Sheikh, S. Karthick, D. Malathi, J. S. Sudarsanand C. Arun, , 2016. Analysis of Data Mining Techniques for Weather Prediction. Indian Journal of
Science and Technology, Vol 9(38)
[4] Kaur, Manpreet & Gulati, Heena & Kundra, Harish. (2014). Data Mining in Agriculture on Crop Price Prediction: Techniques and Applications. International
Journal of Computer Applications. 99. 1-3. 10.5120/17422-8273.
[5] S. Lamrhari, H. Elghazi, T. Sadiki and A. El Faker, "A profile-based Big data architecture for agricultural context," 2016 International Conference on Electrical and Information Technologies (ICEIT), Tangiers, 2016, pp. 22-27.
[6] M. R. Bendre, R. C. Thool and V. R. Thool, "Big data in precision agriculture: Weather forecasting for future farming," 2015 1st International Conference on
Next Generation Computing Technologies (NGCT), Dehradun, 2015, pp. 744-750.
[7] Alkhatib K, Najadat H, Hmeidi I, Shatnawi MKA. 2013. Stock Price Prediction Using K-Nearest Neighbor (kNN) Algorithm. International Journal of
Business, Humanities and Technology. 3 (3): 32 - 44.
[8] Chitra A, Uma S. 2010. An Ensemble Model of Multiple Classifiers for Time Series Prediction. International Journal of Computer Theory and Engineering. 2
(3): 454 - 458. http://dx.doi.org/10.7763/ijcte.2010.v2.184
[9] Imandoust, S.B. & Bolandraftar, Mohammad. (2013). Application of K-nearest neighbor (KNN) approach for predicting economic events theoretical
background. Int J Eng Res Appl. 3. 605-610.
[10] R. Sujatha and P. Isakki, "A study on crop yield forecasting using classification techniques," 2016 International Conference on Computing Technologies and
Intelligent Data Engineering (ICCTIDE'16), Kovilpatti, 2016, pp. 1-4.
[11] S. Ruggieri, "Efficient C4.5 [classification algorithm]," in IEEE Transactions on Knowledge and Data Engineering, vol. 14, no. 2, pp. 438-444, Mar/Apr 2002.
[12] S. Nagini, T. V. R. Kanth and B. V. Kiranmayee, "Agriculture yield prediction using predictive analytic techniques," 2016 2nd International Conference on
Contemporary Computing and Informatics (IC3I), Noida, 2016, pp. 783-788.
[13] C. Huang & J. R. G. Townshend (2003) A stepwise regression tree for nonlinear approximation: Applications to estimating subpixel land cover, International
Journal of Remote Sensing, 24:1, 75-90.
[14] G. Ravichandran and R. S. Koteeshwari, "Agricultural crop predictor and advisor using ANN for Smartphone’s," 2016 International Conference on Emerging
Trends in Engineering, Technology and Science (ICETETS), Pudukkottai, 2016, pp. 1-6