Original Article
Therapeutic effects of anti-VEGF drugs, combined
with laser therapy, on diabetic retinopathy
and its effects on choroid thickness
Ping Wang1,2, Aihua Ma3, Juanjuan Sun2, Bojun Zhao1
1Department of Ophthalmology, Shandong Provincial Hospital Affiliated to Shandong University, Jinan, Shandong Province, China; 2Department of Ophthalmology, Affiliated Hospital of Weifang Medical University, Weifang, Shandong Province, China; 3Department of Pediatrics, Shandong Provincial Hospital Affiliated to Shandong
University, Jinan, China
Received December 24, 2018; Accepted February 11, 2019; Epub May 15, 2019; Published May 30, 2019
Abstract: Objective: The aim of this study was to observe the therapeutic effects of anti-vascular endothelial growth factor (VEGF) drugs, combined with laser treatment, on diabetic retinopathy, evaluating its effects on choroidal thickness. Method: A total of 64 patients with diabetic retinopathy were randomly divided into groups A and B. Group A included 32 patients that received anti-VEGF drugs, combined with laser treatment. In group B, 32 patients received laser therapy alone. Therapeutic effects of the two groups, after treatment, were recorded. Results of in-traocular pressure, vision, thickness of retinal nerve epithelium in the macular area, and choroid thickness under macular fovea in the two groups, at different treatment stages, were compared. Results: The visual acuity of group
A, at 1 month after treatment and 3 months after treatment, was significantly higher than that of group B, with sta
-tistically significant differences (P<0.05). There were no significant differences in the visual acuity of group B before
treatment, 1 week after treatment, 1 month after treatment, and 3 months after treatment (P>0.05). In group A,
the thickness of the retinal nerve epithelium in the macular area was significantly lower than that of group B after 1
month of treatment and 3 months after treatment. Choroid thickness under the macular fovea of patients in group
A, after 3 months of treatment, was significantly lower than that in group B, with statistically significant differences (P<0.05). Conclusion: The clinical efficacy of anti-vascular endothelial growth factor (VEGF) drugs, combined with
laser treatment, on diabetic retinopathy is better than that of laser treatment alone.
Keywords: VEGF, laser therapy, diabetic retinopathy, choroid
Introduction
Diabetic retinopathy is a kind of microvascular fundus lesion unique to diabetic patients [1]. It is due to the increased viscosity of red blood cells in the blood of diabetic patients, leading to the blockage of retinal capillaries. Due to the lack of blood supply to the retina, it stimulates the growth of a large number of new blood ves-sels in the retina, resulting in various diabetic eye diseases [2, 3]. Relevant studies have shown that retinopathy is the main cause of blindness in diabetic patients [4]. Incidence of diabetic retinopathy is extremely high [5]. Thus, how to treat and prevent diabetic retinopathy has become the focus of much attention. Laser therapy has been recognized as an
recent years, a large number of clinical studies have shown that injections of an appropriate amount of anti-VEGF drugs have good clinical effects in the treatment of retinopathy [11]. This study aimed to observe the therapeutic effects of anti-vascular endothelial growth fac-tor (VEGF) drugs, combined with laser therapy, on diabetic retinopathy, examining its effects on choroidal thickness.
Materials and methods
Patients
A total of 64 patients with diabetic retinopathy were randomly divided into groups A and B, using the random number table method. In group A, 32 patients received anti-VEGF drugs, combined with laser treatment. In group B, 32 patients received laser therapy alone. There were 15 males and 17 females in group A, with ages ranging from 39 to 73 years and an aver-age aver-age of 52.45±7.56. There were 16 males and 16 females in group B, with ages ranging from 42 to 69 years and an average age of 52.08±6.76. Inclusion criteria: All patients in- cluded were diagnosed as non-proliferative or proliferative diabetic retinopathy with focal or diffuse macular edema after clinical examina-tions, optical coherence tomography (OCT), and other examinations [11]. Exclusion criteria: Patients that underwent any retinal photocoag-ulation or intravitreal injections; Patients with other eye diseases; Patients with severe cardio-vascular disease; Patients with other serious systemic diseases. All patients and families provided informed consent in advance. This study was approved by the Ethics Committee of Shandong Provincial Hospital affiliated to Shandong University.
Therapeutic method
Group B was treated with laser therapy alone. Levofloxacin hydrochloride eye drops (Zhong- shan Branch of Zhuhai Federal Pharmaceutical Co., Ltd., drug approval number H20020327) were given to the affected eyes 2 days before laser surgery. The patients were treated with compound tropicamide eye drops (Handan Kangye Pharmaceutical Co., Ltd., drug approval number H20044926) in the half hour of laser surgery for mydriasis. Oxybuprocaine hydro-chloride eye drops were given during laser sur-gery (Santen Pharmaceutical Co., Ltd., drug
approval number J20100128) to provide topi-cal anesthesia. Relevant parameters of the laser were then adjusted to an appropriate level. In the whole retinal photocoagulation, a frequency-doubled semiconductor laser (532 nm) (Zeiss Company, Germany) was used. The diameter of the rear pole was set to 100 um~200 um. The spot diameter of light spot in the middle and periphery was set to 200 um~350 um. Exposure time was set to 0.15 s~0.3 seconds and the working power was set as within the range of 100 MW~500 MW. Laser range: Photocoagulation from the outer edge of the 2 DD on the side of the macula, the upper and lower sides of the optic disc, and the 1.5 DD outside the nasal cavity to the equatorial ampulla. The interval between the spots was set to be 1 spot diameter. The total number of spots was controlled within the range of 1000 to 1500 and the total retinal photocoagulation was performed 3 or 4 times in total, once a week.
The methods and related parameters of laser instrument in group A are the same as those used for group B. However, patients in group A were treated with anti-VEGF drugs (Conbercept) as well.
Outcome measures
Clinical efficacy, intraocular pressure, visual acuity, thickness of retinal nerve epithelium in the macular area, and choroid thickness under macular fovea were monitored before treat-ment and 1 week, one month, and 3 months after treatment. Group A and group B were then compared. The clinical efficacy of group A and group B, after treatment for diabetic retinopa-thy, was evaluated using the classification and severity grading of diabetic retinopathy [12] and OCT examinations:
Cure refers to no hemorrhaging in the patient’s fundus. The patient’s visual acuity is the same as before onset or restored to 1.0 and the results of OCT examination show that the mac-ular area of the eye is normal. Marked effect means that more than one-half of the fundus hemorrhaging has been absorbed. Results of OCT examination show that the macular area of
the two groups. P<0.05 indicates statistical significance.
Results
General clinical data comparison between two groups
The comparison of general clinical data be- tween the two groups showed no significant dif-ferences (P>0.05). Thus, the two groups were comparable. See Table 1.
Therapeutic effects of patients treated in group A and group B
[image:3.612.92.363.83.442.2]Curative rates, markedly effective rates, effec-tive rates, and total effeceffec-tive rates of patients in group A were significantly higher than those in group B. Differences in curative ratios and total effective rates between the two gro- ups were statistically significant (P<0.05). Ther- Table 1. General baseline data of patients in both groups [n (%)]
Group A group (n=32) B group (n=32) t/X2 P
Gender 0.063 0.803
Male 15 (46.88) 16 (50.00)
Female 17 (53.13) 16 (50.00)
Age (years) 52.45±7.56 52.08±6.76 0.206 0.838
Weight (Kg) 57.55±6.40 59.28±5.12 1.194 0.237
Hypertension 0.063 0.803
Yes 17 (53.13) 16 (50.00)
NO 15 (46.88) 16 (50.00)
Type 0.000 1.000
Simpleness 0 (0.00) 0 (0.00)
Proliferative 32 (100.00) 32 (100.00)
Other drug use 0.000 1.000
Yes 0 (0.00) 0 (0.00)
NO 32 (100.00) 32 (100.00)
Routine blood
Hb (gm/dl) 10.24±1.56 7.48±3.21 4.375 <0.001
RBC (×1012/L) 4.28±0.53 6.02±0.12 18.110 <0.001
PLT (×109/L) 149.96±29.24 146.75±28.14 0.448 0.656
Liver function
ALT (U/L) 22.05±11.38 20.43±10.58 0.590 0.558
AST (U/L) 19.28±9.25 18.02±7.66 0.594 0.555
Renal function
TP (g/L ) 125.48±12.69 76.54±10.21 17.000 <0.001
UREA (mmoI/L) 8.13±1.22 4.34±1.96 9.286 <0.001
CRE (μmoI/L) 183.04±37.45 93.38±19.01 12.080 <0.001
UA (μmoI/L) 601.58±38.77 214.78±55.02 32.510 <0.001
the eye was generally normal and the patient’s visual acuity recovered more than 4 lines. Effective means more than one-third but less than one-half of fundus hemorrhaging has been absorbed. Results of OCT exami-nation show that the edema in macular area is improved and visual acuity recovered in 2~3 lines. Ineffective means that the patient’s fundus hemorrhaging is the same as before treatment or the fundus hemorrhaging is aggravated and visual acuity is reduced.
Statistical methods
apeutic inefficiency rates of patients in group A were significantly lower than in group B and dif-ferences were statistically significant (P<0.05). Present results show that the clinical efficacy of anti-VEGF drugs, combined with laser treat-ment, for diabetic retinopathy is better than laser treatment alone (Table 2). Intraocular pressure levels of patients in group A and group B were not statistically significant before treat-ment and 1 week after treattreat-ment, 1 month after treatment, and 3 months after treatment (P>0.05).
Intraocular pressure and visual acuity at differ-ent times before and after treatmdiffer-ent
Intraocular pressure at different times before and after treatment in the two groups: Intraocular pressure levels of patients in group A before treatment and 1 week after treatment, 1 month after treatment, and 3 months after treatment were (17.24±4.64) mmHg, (18.04± 3.02) mmHg, (17.67±4.38) mmHg, and (16.69± 3.29) mmHg, respectively. Intraocular pressure rates of patients in group B before treatment and 1 week after treatment, 1 month after treatment, and 3 months after treatment we- re (17.00±3.04) mmHg, (19.03±4.25) mmHg, (18.44±4.02) mmHg, and (17.23±2.63) mmHg, respectively. Comparisons between groups showed no statistically significant differences in intraocular pressure before treatment and 1 week after treatment, 1 month after treatment, and 3 months after treatment in group A and
ned to pre-treatment levels at the third month after treatment. Based on the above results, it was speculated that there were no significant differences in the effects of anti-VEGF drugs, combined with laser therapy, on intraocular pressure in patients with diabetic retinopathy, compared with those treated with laser treat-ment alone (Table 3).
[image:4.612.90.385.97.175.2]Visual acuity at different times before and after treatment: The visual acuity of patients in group A before treatment and 1 week after treatment, 1 month after treatment, and 3 months af- ter treatment was (0.43±0.37), (0.46±0.36), (0.68±0.41), and (0.69±0.47), respectively. The visual acuity of patients in group B before treat-ment and 1 week after treattreat-ment, 1 month after treatment, and 3 months after treatment was (0.44±0.38), (0.45±0.35), (0.46±0.38), and (0.46±0.38), respectively. There were no significant differences in visual acuity between the two groups before treatment and 1 week after treatment (P>0.05). Intra-group compari-sons showed no statistically significant differ-ences in visual acuity in group B before treat-ment and 1 week after treattreat-ment, 1 month after treatment, and 3 months after treatment (P>0.05). The visual acuity of patients in group A gradually increased from before treatment to 3 months after treatment. The visual acuity of patients at 1 month after treatment and 3 months after treatment was different from before treatment and 1 week before treatment, with statistically significant differences (P< Table 2. Therapeutic effects of patients in the two groups after
treat-ment [n (%)]
Group n Cure Effective Significant effect Invalid Total effective rate
A group 32 10 (31.25) 13 (40.61) 8 (25.00) 1 (3.13) 31 (96.88)
B group 32 2 (6.25) 11 (34.38) 12 (37.50) 7 (21.88) 25 (78.13)
X2 6.564 0.267 1.164 5.143 5.143
P 0.010 0.606 0.281 0.023 0.023
Table 3. Intraocular pressure (mmHg) before and after treatment
Group A group (n=32) B group (n=32) P
Before treatment 17.24±4.64 17.00±3.04 0.808
After 1 week of treatment 18.04±3.02 19.03±4.25 1.074
After treatment for 1 month 17.67±4.38 18.44±4.02 0.467
After 3 months of treatment 16.69±3.29 17.23±2.63 0.471
P 0.547 0.072
[image:4.612.90.385.209.288.2]Table 4. Visual acuity before and after treatment
Group A group (n=32) B group (n=32) P
Before treatment 0.43±0.37 0.44±0.38 0.915
After 1 week of treatment 0.46±0.36 0.45±0.35 0.911
After treatment for 1 month 0.68±0.41*,# 0.46±0.38 0.030
After 3 months of treatment 0.69±0.47*,# 0.46±0.38 0.035
P 0.012 0.996
Note: *indicates that the difference in visual acuity is statistically significant compared
with 1 week before and 1 week before treatment (P<0.05). #indicates that the difference in visual acuity between this group and group B at the same time point was statistically
significant (P<0.05).
0.05). The above results suggest that the effects of visual acuity in patients with diabetic retinopathy treated with anti-VEGF drugs, com-bined with laser therapy, are better than those with laser treatment alone (Table 4).
Changes in thickness of the retinal nerve epi-thelium in the macular area at different times before and after treatment in the two groups
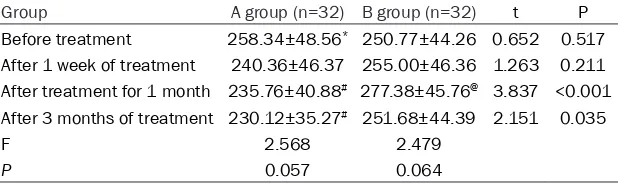
The thickness of retinal nerve epithelium in the macular area before treatment and 1 week after treatment, 1 month after treatment, and 3 months after treatment was (258.34±48.56) μm, (240.36±46.37) μm, (235.76±40.88) μm, and (230.12±35.27) μm, respectively. The thickness of retinal nerve epithelium in the macular area before treatment and 1 week after treatment, 1 month after treatment, and 3 months after treatment was (250.77±44.26) μm, (255.00±46.36) μm, (277.38±45.76) μm, and (251.68±44.39) μm, respectively. There were no significant differences in the thickness of retinal nerve epithelium in the macular area between the two groups before treat- ment and one week after treatment (P>0.05). The thickness of retinal nerve epithelium in
um in the macular area of group B gradually increased from before treatment to one month after treatment. At 3 months after treatment, it gradually decreased to levels before treatment. Differences in retinal nerve epithelium in the macular area after treatment were significant, compared to before treatment and 3 months after treatment (P<0.05) (Table 5).
Changes of choroid thickness under the macu-lar fovea at different times before and after treatment
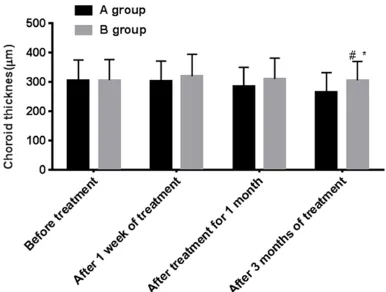
Choroid thickness under the macular fovea of patients in group A before treatment and 1 week after treatment, 1 month after treatment, and 3 months after treatment was (304.28± 70.75) μm, (302.45±69.03) μm, (285.28± 65.02) μm, and (265.14±66.85) μm, respec-tively. Choroid thickness under the macular fovea of patients in group B before treatment and 1 week after treatment, 1 month after treatment, and 3 months after treatment was (306.30±69.86) μm, (319.30±75.24) μm, (310.74±70.46) μm, and (305.45±64.29) μm, respectively. Comparisons between groups showed no statistically significant differences Table 5. Thickness of retinal nerve epithelium in the macular region (μm)
Group A group (n=32) B group (n=32) t P
Before treatment 258.34±48.56* 250.77±44.26 0.652 0.517
After 1 week of treatment 240.36±46.37 255.00±46.36 1.263 0.211
After treatment for 1 month 235.76±40.88# 277.38±45.76@ 3.837 <0.001
After 3 months of treatment 230.12±35.27# 251.68±44.39 2.151 0.035
F 2.568 2.479
P 0.057 0.064
Note: *indicates that the difference is statistically significant (P<0.05) compared with that of January after treatment and March after treatment. @indicates that the difference is
statistically significant compared with that before and after treatment (P<0.05). #indicates that the difference in visual acuity between this group and group B at the same time point
was statistically significant (P<0.05).
[image:5.612.92.401.243.335.2]epitheli-in choroid thickness under the macular fovea before treatment and 1 week after treatment, 1 month after treatment, and 3 months after treatment in group A and group B (P>0.05). Choroid thickness under the macular fovea in group A was significantly lower than that in group B after treatment (P<0.05). Intra-group comparisons showed that choroid thickness
week after treatment, 1 month after treatment, and 3 months after treatment (P>0.05). Choroid thickness under the macular fovea of patients in group A gradually decreased before treat-ment and 1 week after treattreat-ment, 1 month after treatment, and 3 months after treatment. Choroid thickness under the macular fovea was significantly higher at 3 months after treatment than that at 1 week before and 1 week after treatment (P<0.05) (Table 6, Figure 1).
Discussion
Diabetic retinopathy is the most common com-plication of diabetes [13]. The long-term hyper-glycemia state of diabetic patients causes par-tial retinal capillaries to lack oxygen, resulting in microvascular lesions in the fundus, eventu-ally leading to diabetic retinopathy [14, 15]. The circulation of blood in the choroid occupies most of the eyeball and the metabolism is very vigorous. The choroid is capable of transmitting oxygen, heat, and nutrients needed for blood circulation, regulating the temperature of the outer layer of the retina [16, 17]. Related stud-ies have shown that occurrence and develop-ment of such diseases, including choroid polyp-oid angiopathy and chorpolyp-oid macular degenera-tion, are closely related to changes in choroid thickness [18, 19]. Therefore, monitoring changes in choroidal thickness is of great clini-cal value in treating patients with diabetic re- tinopathy.
[image:6.612.89.399.85.178.2]Therefore, this study aimed to explore the effects of anti-VEGF drugs, combined with laser therapy, and laser treatment alone on intraocu-lar pressure, vision, thickness of retinal nerve epithelium in the macular area, choroid thick-ness under the macular fovea, and therapeutic efficacy in patients with diabetic retinopathy. Table 6. Choroid thickness under the macular fovea (μm)
Group A group (n=32) B group (n=32) t P
Before treatment 304.28±70.75 306.30±69.86 0.115 0.909
After 1 week of treatment 302.45±69.03 319.30±75.24 0.934 0.354
After treatment for 1 month 285.28±65.02 310.74±70.46 1.502 0.138 After 3 months of treatment 265.14±66.85*,# 305.45±64.29 2.459 0.017
F 2.304 0.262
P 0.080 0.853
Note: *indicates that the difference is statistically significant compared with 1 week
before and 1 week after treatment (P<0.05). #indicates that the difference in visual
acuity between this group and group B at the same time point was statistically significant (P<0.05).
under the macular fovea in group B showed a gradual downward trend after reaching a peak 1 week after treatment. It was downregulated to pre-treatment levels and at 3 months after treat-ment. However, there were no significant differ-ences in choroid thick-ness under the macular fovea of patients in group B before treatment and 1
Figure 1. Changes in choroid thickness under the macular fovea of patients in the two groups at dif-ferent times before and after treatment. Choroid thickness under the macular fovea after 3 months of
treatment in group A was significantly lower than that in group B. Differences were statistically significant (P<0.05). There were no significant differences in
choroidal thickness under the macular fovea of pa-tients in group B before treatment and 1 week after treatment, 1 month after treatment, and 3 months after treatment (P>0.05). Choroid thickness under the macular fovea in group A at 3 months after
treat-ment was significantly different from that before treatment and 1 week after treatment (P<0.05).
Note: *indicates that the difference in visual acuity
is statistically significant compared with 1 week be
-fore and 1 week after treatment (P<0.05); #indicates
that the difference in visual acuity between this group and group B at the same time was statistically
[image:6.612.91.284.242.388.2]The present study calculated curative effects in group A and group B after treatment. Present results showed that curative rates, markedly effective rates, effective rates, and total effec-tive rates of patients in group A were signifi-cantly higher than those in group B. Curative rates and total effective rates of the two groups were statistically significant. Thus, it was be- lieved that the clinical efficacy of anti-VEGF drugs, combined with laser treatment, for dia-betic retinopathy is better than with laser treat-ment alone. Many studies have shown that the combination of anti-VEGF drugs with laser ther-apy in the treatment of diabetic retinopathy is more conducive to the recovery of vision and improvement of treatment effects [20, 21]. Previous reports examining the effects of anti-VEGF drugs on visual acuity in patients with dia-betic retinopathy have shown that the impor-tant cause for the generation of new blood ves-sels is abnormal expression of VEGF factor [22]. Studies have found that anti-VEGF drugs can block the formation of new blood vessels and accelerate the absorption of edema in the macular area by blocking the binding of VEGF factors to receptors associated with VEGF fac-tors [23].
Monitoring the intraocular pressure and visual acuity of the two groups of patients before and after treatment, no significant differences were found in the effects of the two treatments on the intraocular pressure of patients with dia-betic retinopathy. Patients that received anti-VEGF drugs, combined with laser treatment, had significantly higher visual acuity at 1 month after treatment and 3 months after treatment than those receiving laser therapy alone. The visual acuity of patients that received anti-VEGF drugs, combined with laser treatment, gradual-ly increased from before treatment to 3 months after treatment. The visual acuity of patients 1 month after treatment and 3 months after treatment was different from that 1 week before treatment and before treatment, with statistically significant differences. Related studies have shown that diabetic patients with ocular complications, after receiving anti-VEGF drugs combined with laser treatment, show better recovery of intraocular pressure and vision than with laser treatment alone [25]. Therefore, based on the above results and related references, the current study suggests that the combination of anti-VEGF drugs and
laser treatment for diabetic retinopathy pa- tients can improve visual acuity better than laser treatment alone.
Finally, the current study monitored changes in the thickness of retinal nerve epithelium in the macular area and choroid thickness under the macular fovea, before and after treatment, in the two groups. Results showed that the thick-ness of retinal nerve epithelium in the macular area and choroid thickness under the macular fovea, before and after treatment, in group A showed a gradual downward trend. Compared with that before treatment, the thickness of retinal nerve epithelium in the macular area and choroid thickness under the macular fovea in patients of group B gradually increased, then gradually decreased to pre-treatment levels. The thickness of retinal nerve epithelium in the macular area of patients in group A was signifi-cantly lower than that of group B after 1 month of treatment and 3 months after treatment. Choroid thickness under the macular fovea in group A was significantly lower than that in group B after 3 months of treatment, with sta-tistically significant differences. According to relevant reports, the choroidal thickness of patients with diabetic retinopathy is significant-ly thicker than that of non-diabetic patients. Changes in choroid thickness is closely related to the function of the outer retina [24, 25]. Retinal laser surgery can increase the thick-ness of nerve epithelium under the macular fovea in patients with diabetic retinopathy in the early postoperative period, presenting as macular edema or aggravation of the original macular edema [26]. Thus, it is believed that laser treatment alone does not reduce preop-erative trauma of laser surgery. For patients with diabetic retinopathy treated with anti-VEGF drugs, combined with laser therapy, the ability to block VEGF factor specific to anti-VEGF drugs can be used to alleviate symptoms of macular edema.
of subjects included in this study was too small to be considered adequate data.
In summary, the clinical efficacy of anti-vascu-lar endothelial growth factor (VEGF) drugs, combined with laser therapy, on diabetic reti-nopathy is better than that of laser treatment alone. Changes in thickness of retinal nerve epithelium in the macular region and choroid thickness under the macular fovea can be used as clinical indicators to monitor changes in patients with diabetic retinopathy. They can also be used to predict the therapeutic effects of diabetic retinopathy, to some extent.
Acknowledgements
This work was supported by Shandong Nature Science Foundation to BZ (ZR2019MH111, ZR2017MH021).
Disclosure of conflict of interest
None.
Address correspondence to: Bojun Zhao, De- partment of Ophthalmology, Shandong Provincial
Hospital Affiliated to Shandong University, Jinan
250021, Shandong Province, China. Tel: +86-18660638282; E-mail: bojunzhaoyx@163.com
References
[1] Hollanders K, Hove IV, Sergeys J, Bergen TV, Lefevere E, Kindt N, Castermans K, Vandewalle E, van Pelt J, Moons L, Stalmans I. AMA0428, a potent rock inhibitor, attenuates early and late experimental diabetic retinopathy. Current Eye Research 2016; 42: 260-272.
[2] Faust O, Acharya U R, Ng EY, Ng KH, Suri JS. Algorithms for the automated detection of dia-betic retinopathy using digital fundus images: a review. J Med Syst 2012; 36: 145-57. [3] Nayak J, Bhat PS, Acharya R, Lim CM, Kagathi
M. Automated identification of diabetic reti -nopathy stages using digital fundus images. J Med Syst 2008; 32: 107-15.
[4] Leasher JL, Bourne RR, Flaxman SR, Jonas JB, Keeffe J, Naidoo K, Pesudovs K, Price H, White RA, Wong TY, Resnikoff S, Taylor HR; Vision Loss Expert Group of the Global Burden of Disease Study. Global estimates on the num-ber of people blind or visually impaired by dia-betic retinopathy: a meta-analysis from 1990 to 2010. Diabetes Care 2016; 39: 1643-9. [5] Bastawrous A, Mathenge W, Wing K,
Bastaw-rous M, Rono H, Weiss HA, Macleod D, Foster A, Peto T, Blows P, Burton M, Kuper H. The inci-dence of diabetes mellitus and diabetic
reti-nopathy in a population-based cohort study of people age 50 years and over in Nakuru, Ke-nya. BMC Endocr Disord 2017; 17: 19.
[6] Royle P, Mistry H, Auguste P, Shyangdan D, Freeman K, Lois N, Waugh N. Pan-retinal pho-tocoagulation and other forms of laser treat-ment and drug therapies for non-proliferative diabetic retinopathy: systematic review and economic evaluation. Health Technol Assess 2015; 19: v-xxviii.
[7] Elman MJ, Ayala A, Bressler NM, Browning D, Flaxel CJ, Glassman AR, Jampol LM, Stone TW; Diabetic Retinopathy Clinical Research Net-work. Intravitreal ranibizumab for diabetic macular edema with prompt versus deferred laser treatment: 5-year randomized trial re-sults. Ophthalmology 2015; 122: 375-381. [8] Goldman A, et al. Laser lipolysis: liposuction
using Nd: YAG laser. Rev Soc Bras Cir Plast 2002; 17: 17-26.
[9] Dhoot DS, Baker K, Saroj N, Vitti R, Berliner AJ, Metzig C, Thompson D, Singh RP. Baseline fac-tors affecting changes in diabetic retinopathy
severity scale score after intravitreal afliber -cept or laser for diabetic macular edema: post hoc analyses from VISTA and VIVID. Ophthal-mology 2018; 125: 51-56.
[10] Ghasemi Falavarjani K, Iafe NA, Hubschman JP, Tsui I, Sadda SR, Sarraf D. Optical coher-ence tomography angiography analysis of the foveal avascular zone and macular vessel den-sity after anti-VEGF therapy in eyes with dia-betic macular edema and retinal vein occlu-sion. Invest Ophthalmol Vis Sci 2017; 58: 30-34.
[11] Osaadon P, Fagan XJ, Lifshitz T, Levy J. A review of anti-VEGF agents for proliferative diabetic retinopathy. Eye (Lond) 2014; 28: 510.
[12] Corcóstegui B, Durán S, González-Albarrán MO, Hernández C, Ruiz-Moreno JM, Salvador J, Udaondo P, Simó R. Update on diagnosis and treatment of diabetic retinopathy: a consensus guideline of the working group of ocular health (spanish society of diabetes and spanish vitre-ous and retina society). J Ophthalmol 2017; 2017: 8234186.
[13] Nentwich MM and Ulbig MW. Diabetic retinop-athy-ocular complications of diabetes mellitus. World J Diabetes 2015; 6: 489-99.
[14] Olafsdottir E, Andersson DK, Dedorsson I, Svärdsudd K, Jansson SP, Stefánsson E. Early detection of type 2 diabetes mellitus and screening for retinopathy are associated with reduced prevalence and severity of retinopa-thy. Acta Ophthalmol 2016; 94: 232-9. [15] Perreault L, Pan Q, Aroda VR, Barrett-Connor E,
dis-ease in the Diabetes Prevention Program Outcomes Study (DPPOS). Diabet Med 2017; 34: 1747-1755.
[16] Xuan Y, Zhang Y, Wang M, Guo J, Li L, Liu W, Ye X. Multimodal fundus imaging of outer retinal tubulations in choroidal osteoma patients. Retina 2018; 38: 49-59.
[17] Kaya A. Association between choroidal thick-ness and metabolic activity on positron emis-sion tomography in eyes with choroidal mela-noma. Am J Ophthalmol 2015; 163: 197-198. [18] Bressler NM. Verteporfin toscnia-rmd. two-year
results of a randomized clinical trial including lesions with occult with no classic choroidal
neovascularization-verteporfin in photodynam -ic therapy report 2. Am J Ophthalmol 2001; 133: 168-9.
[19] Azuma K, Obata R, Nomura Y, Tan X, Takahashi
H, Yanagi Y. Angiographic findings of ranibi -zumab-resistant polypoidal choroidal vascu-lopathy after switching to a treat-and-extend
regimen with intravitreal aflibercept. Retina
2016; 36: 2158-2165.
[20] Royle P, Mistry H, Auguste P, Shyangdan D, Freeman K, Lois N, Waugh N. Pan-retinal pho-tocoagulation and other forms of laser treat-ment and drug therapies for non-proliferative diabetic retinopathy: systematic review and economic evaluation. Health Technol Assess 2015; 19: v-xxviii.
[21] Régnier S, Malcolm W, Allen F, Wright J, Bezlyak
V. Efficacy of anti-VEGF and laser photocoagu -lation in the treatment of visual impairment due to diabetic macular edema: a systematic review and network meta-analysis. PLoS One 2014; 9: e102309.
[22] Amadio M, Govoni S, Pascale A. Targeting VEGF in eye neovascularization: what’s new?: a comprehensive review on current therapies and oligonucleotide-based interventions under development. Pharmacol Res 2016; 103: 253-69.
[23] Maturi RK, Bleau L, Saunders J, Mubasher M, Stewart MW. A 12-month, single-masked, ran-domized controlled study of eyes with persis-tent diabetic macular edema after multiple
anti-VEGF injections to assess the efficacy of
the dexamethasone-delayed delivery system as an adjunct to bevacizumab compared with continued bevacizumab monotherapy. Retina 2015; 35: 1604-14.
[24] Zhang Z, Meng X, Wu Z, Zou W, Zhang J, Zhu D, Chen T, Zhang Q. Changes in choroidal thick-ness after panretinal photocoagulation for dia-betic retinopathy: a 12-week longitudinal study. Invest Ophthalmol Vis Sci 2015; 56: 2631-8.
[25] Ahn SJ, Woo SJ, Park KH, Jung C, Hong JH, Han MK. Retinal and choroidal changes and visual outcome in central retinal artery occlusion: an optical coherence tomography study. Am J Ophthalmol 2015; 159: 667-76.
![Table 1. General baseline data of patients in both groups [n (%)]](https://thumb-us.123doks.com/thumbv2/123dok_us/1263884.654213/3.612.92.363.83.442/table-general-baseline-data-patients-groups-n.webp)
![Table 2. Therapeutic effects of patients in the two groups after treat-ment [n (%)]](https://thumb-us.123doks.com/thumbv2/123dok_us/1263884.654213/4.612.90.385.209.288/table-therapeutic-effects-patients-groups-treat-ment-n.webp)