438
THE MICRO-ESTIMATION OF SULPHATES IN
SEA WATER AND THE BODY FLUIDS OF
MARINE ANIMALS
BY D. A. WEBB
1From the Department of Zoology, University of Cambridge
(Received 10 May 1939)
(With Three Text-figures)
IN a series of methods recently proposed (Robertson & Webb, 1939) for the micro-estimation of the principal constituents of sea water and of the body fluids of marine animals, that for sulphate was on the whole the least satisfactory. As there described it consists of precipitation by means of barium chloride and direct titration of the excess barium with sodium sulphate, using rhodizonic acid as indicator. The simplicity of the method is to some extent outweighed by the capricious behaviour of the indicator, which renders the judging of the end-point an operation which, even after considerable practice, it is difficult to perform with great confidence. Although the error may usually be kept without difficulty below 2 %, duplicate titrations are necessary if an occasional error somewhat larger than this is to be avoided. In cases where speed is of greater importance than the highest accuracy the method is probably the best that is available, but it was thought that an alter-native method, based on that of Van Slyke et al. (1927) for total base in blood, might be made to yield more accurate results and require less practice.
The basic principle of this method is the same as that used by Sendroy (1937) for the estimation of chloride; namely, the addition of an insoluble iodate, which reacts with the ion to be estimated so as to form a more insoluble salt and liberate iodate ions'into the solution. For the estimation of chloride silver iodate is used; for sulphate, barium iodate. A few preliminary experiments with lead iodate and lead iodide showed that they were useless except perhaps for very high concentra-tions of sulphate.
The procedure adopted by Van Slyke et al. is first to convert all the bases to sulphates; these are then dissolved in a known volume of very dilute acetic acid and shaken with barium iodate for an hour. After centrifugation the iodate is estimated in an aliquot of the solution by treatment with hydrazine and measurement of the volume of nitrogen liberated. The reactions are:
(1) . (2)
Stoichiometrically therefore each mole of sulphate should yield 3 moles of nitrogen. 1
The Micro-estimation of Sulphates 439
In practice the authors find that the yield is considerably less, which they suppose is due to the fact that the first equation does not go to completion, but reaches equilibrium when there are still significant quantities of sulphate in solution. This point will be discussed further below.
For the present purposes it was considered more convenient to estimate the iodate volumetrically, by titrating the iodine which is released by treatment with potassium iodide in the presence of acid, according to the following equation:
HIO3 + 5HI = 3I2 + 3H2O. (3)
The procedure therefore is as follows. The sample is measured into a centrifuge tube, and a measured volume of 0-2 % acetic acid is added, sufficient to bring the concentration of sulphate to between 0-25 and 0-65 mg. SO4 per ml. (If 1 ml.
samples of sea water or body fluids with a smilar sulphate content are used, 5 ml. is a suitable volume of acetic acid solution.) The acetic acid is present to prevent the precipitation of traces of barium carbonate or phosphate. About 40 mg. of solid barium iodate is added, and the tube securely corked and kept for four hours in a thermostat, or at any rate in such a place that the range of temperature variation will be less than 20 C. During this period it is inverted several times every 15 min.- or so, in order to suspend the barium iodate throughout the solution. Van Slyke et al. recommend the use of a mechanical shaker for an hour, but with solutions containing any considerable quantity of protein this produces so much foaming, even if caprylic alcohol be added, as to render the subsequent analysis almost impossible. By gentle mixing under the conditions described consistent results were obtained. When the reaction is completed the tube is centrifuged and an aliquot (2 or 5 ml.) of the supernatant fluid pipetted off. After the addition of excess solid potassium iodide and a few drops of phosphoric acid the iodine liberated is titrated with iV/50 sodium thiosulphate. If v ml. are taken for titration, and require t ml. of sodium thiosulphate solution whose normality is n, then the con-centration of iodate in the solution at equilibrium was
>-x io3 mM./l.
Unfortunately, the relation between this figure and the initial concentration of sulphate is rather complex. As mentioned above, if equation (1) went completely from left to right each mole of sulphate would yield two of iodate. The equation, however, is a balanced one, and the equilibrium position depends on the relative solubility of barium iodate and barium sulphate, which in their turn vary with temperature, final concentration of iodate in solution, and concentration of other salts (chlorides, etc.).
Assuming constancy of all other conditions it should be possible to calculate from the law of mass action the ratio of initial sulphate concentration to final iodate concentration for various values of the latter. Let Ax and k^ be the solubility products
of barium iodate and barium sulphate respectively, so that
[Ba-][IO,']«=At, (4)
44° D. A. WEBB
then in any system including solid barium iodate and sulphate
[SO
4"] = £[IO,'F. (6)
Assuming all the sulphate in the original solution to be balanced by sodium ions, as in equation (i), then it is clear that at all stages of the reaction the following equation will hold.
2[Ba-] + [Na-] = 2[S(V] + [IO,']. (7)
Using the suffixes i and e to indicate initial and final concentrations respectively, since
[Na-] = 2[SO4*],, (8)
then from (7) 2[Ba-]. + 2[SO4^ = 2 [ S O a + [IO,']., (9)
whence, substituting from (4) and (6) and dividing by 2,
that is,
[so/],,
PO8']. (10)
Since the solution at equilibrium contains both acetic acid and sodium iodate in significant quantities the effective values of kt and k^ are likely to differ
con-siderably from those given by determining their solubility in distilled water. It is true that Sendroy (1937) found that his experimental results were in agreement with those predicted from the solubility products of silver iodate and silver chloride in distilled water, but the present conditions differ from his in two important respects: (1) The solubility product for barium iodate varies as the square of the iodate concentration, so that small differences in solubility will be exaggerated in the values of the solubility product. (2) In Sendroy's case the total range of variation from the stoichiometric ratio is far smaller, so that only large errors in estimating it could be detected.
The values of Ax and k% under the given conditions must therefore be
deter-mined empirically. This was done by determining the value of the ratio [SO4"]</[IO3']
for values of [SCV], at either end of the working range. In Table I each ratio
Table I
[SO/], mM./l.
6
mM./l.
6-04 u-45
represents the mean of three determinations, made at 2370 C.1 on solutions of sodium chloride and sodium sulphate with a SO4/C1 ratio equal to that found in
sea water (0-1396 by weight). By substituting these values in equation (10) simul-1
The Micro-estimatidn of Sulphates 441
taneous equations are obtained for Ax and /%, yielding the values (in terms of
mM./l.)
*i = 3'85. h = 0-00895.
Table II [10,1. mM./l. n-93 1080 9-87 q-oo 8-05 7-54 6-84 626 571 [SO/], (actual) mM./l. 628 5625 512 402 4-125 3-835 3-445 3-105 282 Ratio 0-5263 0-5211 0-5189 0-5131 0-5123 0-5084 0-5033 04963 04938 Ratio predicted from equation (10) 05255 05220 05189 0-5156 0-5113 0-5085 0-5039 04989 0-4947 Error (%) + 0-15 - 0 - 1 7
000 -049 + O-2O
— O-O2
-008 -052 -Ol8 2-04 a 203 2-00
1
•a
1-98 1-96 •§ 1-94 1-92 1-906 7 8 9 10 11
Iodate (mM. per litre) in final solution
12
Fig. 1. The curve is that given by equation (io), except that on the ordinate [KV^/tSO/]^ is plotted instead of its reciprocal. The points are those found empirically by analysis of a solution whose SO4/CI ratio was the same as that of sea water (01396 by weight; 0-0515 by moles). Temperature 23-7° C.
In Table II and Fig. 1 are set out a complete series of determinations over this range, together with the values predicted from equation (10), using the values of
ky and &2 given above. It will be seen that the agreement is remarkably good, the
442 D. A. WEBB
treatment may not be entirely adequate—it omits for example all consideration of BaIO3 ions which are probably present—the closeness of the fit means that it may
be safely used within the range indicated, though it would probably be unwise to extrapolate.
If [IOa'], is plotted directly against [SO4"]( a straight line is obtained, as shown
in Fig. 2, which corresponds to the equation
[SO/],= o-5538 .-0-3375.
Over the range of concentrations studied this equation gives results that do not differ from those given by equation (10) by more than 0-15 %; but it is of course devoid of any theoretical significance.
S 10
3 4 5 6
Initial sulphate (mM. per litre)
Fig. 2. The same points as are shown in Fig. i, plotted to show the relation of [IOST, to [SO4*]<.
It is interesting to compare these results with those obtained by Van Slyke et al. (1927). The differences in chloride concentration and temperature between their conditions and those reported above may for the moment be ignored, since as will be seen later these cannot account for differences of more than 5 %. These authors found that instead of the stoichiometrical relation between initial sulphate concen-tration and nitrogen evolved,
S O / (mM.) = Ns (mM.) x 0-333,
they obtained the following relation:
The Micro-estimation, of Sulphates 443
If, as they assume, equation (2) gives a stoichiometric yield this implies that the relation between sulphate and iodate concentrations is
[SO/], = 0-543 [I08']. + 0-5615. (12)
The most remarkable discrepancy between this and equation (11) is that the fixed term is positive instead of negative. It is difficult to see what this positive term can represent, whereas a negative term clearly represents the iodate that is derived from physical solution of barium iodate irrespective of the presence of sulphates. Furthermore if an attempt is made to derive from the data of Van Slyke et al. values of k-L and £j by substituting their experimental ratios in equation (10), the values obtained are quite meaningless, namely
&i = —14*07, £ 2 = — 0-12.
No explanation can be offered for this discrepancy in the experimental results, since the conditions seem to be almost identical; but since the figures reported in the present paper may be accounted for theoretically by assuming values for the solubility constants which have at any rate the right sign and are of the right order of magnitude, they may perhaps be accepted as reliable.
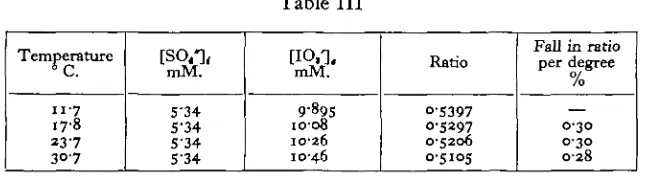
There remain to be considered the influence of temperature and chloride concentration on the position of equilibrium. In Table III are shown the figures for the analysis of a diluted sample of natural sea water at various temperatures. The sulphate content, as calculated from the chlorinity, was 5-34mM./l. It will be seen that there is, throughout the temperature range studied, a fall of 0-3 % in the [SO4*],/[IO8'], ratio for each rise of i° C. It is therefore sufficient to know the
[image:6.451.65.390.408.497.2]temperature at which equilibration takes place to the nearest degree.
Table III
Temperature
n-7 17-8 237 30-7
[SO,*], mM.
5-34 5-34 S-34 5'34
mM.
9-895
1008 10-26 10-46
Ratio
05397 0-5297 0-5206 0-5105
Fall in ratio per degree
0/ /o
0-30 0-30 028
With regard to chloride concentration the results are shown in Fig. 3, for which the points were obtained by the analysis of appropriate mixtures of sodium sulphate and sodium chloride solutions. Smooth curves may be fitted to the points in such a way that the maximum deviation is 1-2 %. Reasonably accurate results may therefore be obtained by interpolating other curves for any other sulphate concen-tration, a fixed point for each being given by the broken curve, which represents the [IO3'],/[SO4*]i ratio given by different sulphate concentrations when the SO^/Cl
444
D. A. WEBBconcentration of sulphate, so that a very rough knowledge of the chloride concen-tration, say to 10 %, is all that is required.
The analytical details from which Fig. 3 is compiled are given in Table IV.
2-3
2-25
2-2
2 2-15
a
GO •a 2-1
•a
% 2-05
,0
£ 1-95
1-9
1-85
1-8
1-75
-1 05 3
NaCl (molar concentration)
Fig. 3. Variation in value of [ I O ^ ^ S O / ^ in accordance with concentration of chloride. Upper curve 2-5, middle curve 5, lower curve i o m M , SO4'/1. The broken curve, derived from that in Fig. 1, shows the value of [IO3'],/[SO«']< for solutions with a SO4/CI ratio equal to that of sea water, and may be used to assist in the interpolation of curves representing intermediate sulphate concen-trations. Temperature 23-7° C.
The Micro-estimation of Sulphates
Table IV445
mM./l. 2-5 2 5 2-5 2'5 2-5 2-5 2'5 2-5 5 5 5 5 5 IO 1 0 10 10 10 10 IO IO IO mM./l. 0 36 4 8 60 96 144 240 300 36 96 144 24O 36O O 36 60 96 I2O 144 192 24O 360 5-15 5-205 5-2S 5-28 539 5-48 5-625 5-805 9-475 9-735 9 8 9 5 9925 io-oo 1795 1806 1794 18-55 1846 18-41 18-71 18-94 18-96 [SO/MICV]. 0-4854 0-4802 0-4762 O-4735 0-4640 0-4560 0-44*4 0-4265 0-5277 0-5136 O'5O53 0-5038 0-5000 O-5S7I O-5537 O-5574 o-539i O-54I7 O-5432 O'5345 0-5280 0-5274difference in the titration figures will therefore, if it is sufficiently small, be directly proportional to the difference in sulphate content.
This double analysis and synthesis of an artificial standard adds of course con-siderably to the labour of the analysis. Nevertheless, if the absence of any necessity for deproteinization be taken into account, this method is no more laborious, and is probably more accurate, than any that has been hitherto proposed for the analysis of similar material.
REFERENCES
ROBERTSON, J. D. & WEBB, D. A. (1939). J. exp. Biol. 16, 155.
SENDROY, J. H. (1937). J. biol. Chem. 120, 355, 405.